SlideShare a Scribd company logo
1 of 1
Download to read offline
Canadian Equity Portfolio Composite
Performance vs benchmark index as of September 30, 2016
Latest quarter performance is estimated based on a representative account, which has
a portfolio composition close to the average of the composite. The performance of the
representative account is used as an estimate for the composite performance due to
the delayed timing of receipt of account statements for clients, which are used to
calculate performance.
$2,214,256
$2,080,706
$750,000
$1,000,000
$1,250,000
$1,500,000
$1,750,000
$2,000,000
$2,250,000
$2,500,000
2008 2009 2010 2011 2012 2013 2014 2015 2016
Goodreid Canadian Equity Portfolio Composite (Gross of fees)
S&P/TSX Composite Index
Annual compound performance
Goodreid
Canadian
Portfolio (CAD)
S&P/TSX
Composite Index
(CAD)
Added
Value
3 month 6.1% 5.5% 0.6%
1 year 12.0% 14.2% -2.2%
3 year 8.6% 8.0% 0.6%
5 year 11.2% 8.1% 3.1%
Annual calendar performance
Goodreid
Canadian
Portfolio (CAD)
S&P/TSX
Composite Index
(CAD)
Added
Value
YTD 12.0% 15.8% -3.8%
2015 -6.5% -8.3% 1.8%
2014 14.2% 10.6% 3.6%
2013 20.4% 13.0% 7.4%
2012 11.6% 7.2% 4.4%
2011 -7.1% -8.7% 1.6%
2010 12.9% 17.6% -4.7%
2009 31.2% 35.1% -3.9%

More Related Content

What's hot

tmbst-reib-success-matrix
tmbst-reib-success-matrixtmbst-reib-success-matrix
tmbst-reib-success-matrix
Sam Rector
 
Real Estate Investment Banking Transactions November 2015
Real Estate Investment Banking Transactions November 2015Real Estate Investment Banking Transactions November 2015
Real Estate Investment Banking Transactions November 2015
Sam Rector
 
Retail news barometer summary- september-2013
Retail news barometer   summary- september-2013Retail news barometer   summary- september-2013
Retail news barometer summary- september-2013
Pragma Consulting
 
Sample Gallery
Sample GallerySample Gallery
Sample Gallery
ebanks.aa
 
Lesson07 2g
Lesson07 2gLesson07 2g
Lesson07 2g
pcomo
 

What's hot (20)

4Q17 Fixed Income Presentation
4Q17 Fixed Income Presentation4Q17 Fixed Income Presentation
4Q17 Fixed Income Presentation
 
SALES CONSTRUCTION 2
SALES CONSTRUCTION 2SALES CONSTRUCTION 2
SALES CONSTRUCTION 2
 
tmbst-reib-success-matrix
tmbst-reib-success-matrixtmbst-reib-success-matrix
tmbst-reib-success-matrix
 
SFAC 6 Elements of Financial Statements Representation in XBRL
SFAC 6 Elements of Financial Statements Representation in XBRLSFAC 6 Elements of Financial Statements Representation in XBRL
SFAC 6 Elements of Financial Statements Representation in XBRL
 
Bentleys: WA Economic Update November 2016
Bentleys: WA Economic Update November 2016Bentleys: WA Economic Update November 2016
Bentleys: WA Economic Update November 2016
 
Real Estate Investment Banking Transactions November 2015
Real Estate Investment Banking Transactions November 2015Real Estate Investment Banking Transactions November 2015
Real Estate Investment Banking Transactions November 2015
 
2.6 budget
2.6 budget2.6 budget
2.6 budget
 
Sd investor presentation q2'18
Sd investor presentation q2'18Sd investor presentation q2'18
Sd investor presentation q2'18
 
Sd investor presentation q2'18
Sd investor presentation q2'18Sd investor presentation q2'18
Sd investor presentation q2'18
 
Sd investor presentation q2'18(1)
Sd investor presentation q2'18(1)Sd investor presentation q2'18(1)
Sd investor presentation q2'18(1)
 
Retail news barometer summary- september-2013
Retail news barometer   summary- september-2013Retail news barometer   summary- september-2013
Retail news barometer summary- september-2013
 
Sample Gallery
Sample GallerySample Gallery
Sample Gallery
 
Exploring the State of Facilities 2014 [Part 4]: Operations Effectiveness & E...
Exploring the State of Facilities 2014 [Part 4]: Operations Effectiveness & E...Exploring the State of Facilities 2014 [Part 4]: Operations Effectiveness & E...
Exploring the State of Facilities 2014 [Part 4]: Operations Effectiveness & E...
 
Lesson07 2g
Lesson07 2gLesson07 2g
Lesson07 2g
 
Asst1 ms261-w12
Asst1 ms261-w12Asst1 ms261-w12
Asst1 ms261-w12
 
Financial Management Policy Ssgc Presentation (29 04-2014)
Financial Management Policy Ssgc Presentation (29 04-2014)Financial Management Policy Ssgc Presentation (29 04-2014)
Financial Management Policy Ssgc Presentation (29 04-2014)
 
3Q17 BBVA Fixed Income Presentation
3Q17 BBVA Fixed Income Presentation3Q17 BBVA Fixed Income Presentation
3Q17 BBVA Fixed Income Presentation
 
Way2wealth morning note
Way2wealth morning noteWay2wealth morning note
Way2wealth morning note
 
Invest or Divest: the New Financial Imperatives
Invest or Divest: the New Financial ImperativesInvest or Divest: the New Financial Imperatives
Invest or Divest: the New Financial Imperatives
 
Acct 212 course project
Acct 212 course projectAcct 212 course project
Acct 212 course project
 

Similar to Goodreid Canadian Performance Sept 30 2016.pptx

Chapter 3 Financial statement analysis (3).ppt
Chapter 3 Financial statement analysis (3).pptChapter 3 Financial statement analysis (3).ppt
Chapter 3 Financial statement analysis (3).ppt
solomontakele1
 
Chapter 3 Financial statement analysis (4).ppt
Chapter 3 Financial statement analysis (4).pptChapter 3 Financial statement analysis (4).ppt
Chapter 3 Financial statement analysis (4).ppt
solomontakele1
 

Similar to Goodreid Canadian Performance Sept 30 2016.pptx (20)

Thermal Energy International - Q3 and YTD Revenue
Thermal Energy International - Q3 and YTD RevenueThermal Energy International - Q3 and YTD Revenue
Thermal Energy International - Q3 and YTD Revenue
 
Supplemental Schedules
Supplemental SchedulesSupplemental Schedules
Supplemental Schedules
 
Chapter 3 Financial statement analysis (2).ppt
Chapter 3 Financial statement analysis (2).pptChapter 3 Financial statement analysis (2).ppt
Chapter 3 Financial statement analysis (2).ppt
 
Chapter 3 Financial statement analysis (3).ppt
Chapter 3 Financial statement analysis (3).pptChapter 3 Financial statement analysis (3).ppt
Chapter 3 Financial statement analysis (3).ppt
 
Chapter 3 Financial statement analysis (4).ppt
Chapter 3 Financial statement analysis (4).pptChapter 3 Financial statement analysis (4).ppt
Chapter 3 Financial statement analysis (4).ppt
 
TRNC Q217 Earnings Presentation
TRNC Q217 Earnings PresentationTRNC Q217 Earnings Presentation
TRNC Q217 Earnings Presentation
 
Q2 2016 Earnings Presentation - Bruker Corporation
Q2 2016 Earnings Presentation - Bruker CorporationQ2 2016 Earnings Presentation - Bruker Corporation
Q2 2016 Earnings Presentation - Bruker Corporation
 
15676 banc abc afs
15676 banc abc afs15676 banc abc afs
15676 banc abc afs
 
Successful Portfolios Guide to Our Client Reports
Successful Portfolios Guide to Our Client ReportsSuccessful Portfolios Guide to Our Client Reports
Successful Portfolios Guide to Our Client Reports
 
Barclays CEO Energy Conference
Barclays CEO Energy ConferenceBarclays CEO Energy Conference
Barclays CEO Energy Conference
 
Barclays CEO Energy Conference
Barclays CEO Energy ConferenceBarclays CEO Energy Conference
Barclays CEO Energy Conference
 
Lvs 3 q15 earnings deck vfinal 2
Lvs 3 q15 earnings deck vfinal 2Lvs 3 q15 earnings deck vfinal 2
Lvs 3 q15 earnings deck vfinal 2
 
sk bioland 052260 Algorithm Investment Report
sk bioland  052260 Algorithm Investment Reportsk bioland  052260 Algorithm Investment Report
sk bioland 052260 Algorithm Investment Report
 
Johnson Rice Energy Conference
Johnson Rice Energy ConferenceJohnson Rice Energy Conference
Johnson Rice Energy Conference
 
2017 Market Outlook - U.S. Equity
2017 Market Outlook - U.S. Equity2017 Market Outlook - U.S. Equity
2017 Market Outlook - U.S. Equity
 
Corporate Presentation August 2018
Corporate Presentation August 2018Corporate Presentation August 2018
Corporate Presentation August 2018
 
Johnson Rice Energy Conference
Johnson Rice Energy ConferenceJohnson Rice Energy Conference
Johnson Rice Energy Conference
 
Johnson Rice Presentation 2016
Johnson Rice Presentation 2016Johnson Rice Presentation 2016
Johnson Rice Presentation 2016
 
Alamo Heights CCM Item #9 ppt 4th qtr fy16 report
Alamo Heights CCM Item #9   ppt 4th qtr fy16 reportAlamo Heights CCM Item #9   ppt 4th qtr fy16 report
Alamo Heights CCM Item #9 ppt 4th qtr fy16 report
 
Aug 2016 presentation
Aug 2016 presentationAug 2016 presentation
Aug 2016 presentation
 

Goodreid Canadian Performance Sept 30 2016.pptx

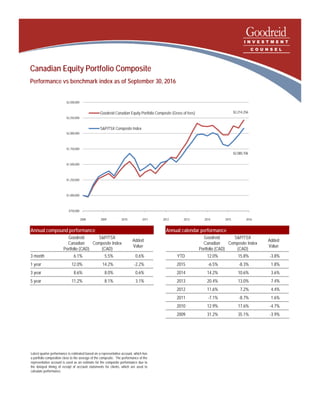
  • 1. Canadian Equity Portfolio Composite Performance vs benchmark index as of September 30, 2016 Latest quarter performance is estimated based on a representative account, which has a portfolio composition close to the average of the composite. The performance of the representative account is used as an estimate for the composite performance due to the delayed timing of receipt of account statements for clients, which are used to calculate performance. $2,214,256 $2,080,706 $750,000 $1,000,000 $1,250,000 $1,500,000 $1,750,000 $2,000,000 $2,250,000 $2,500,000 2008 2009 2010 2011 2012 2013 2014 2015 2016 Goodreid Canadian Equity Portfolio Composite (Gross of fees) S&P/TSX Composite Index Annual compound performance Goodreid Canadian Portfolio (CAD) S&P/TSX Composite Index (CAD) Added Value 3 month 6.1% 5.5% 0.6% 1 year 12.0% 14.2% -2.2% 3 year 8.6% 8.0% 0.6% 5 year 11.2% 8.1% 3.1% Annual calendar performance Goodreid Canadian Portfolio (CAD) S&P/TSX Composite Index (CAD) Added Value YTD 12.0% 15.8% -3.8% 2015 -6.5% -8.3% 1.8% 2014 14.2% 10.6% 3.6% 2013 20.4% 13.0% 7.4% 2012 11.6% 7.2% 4.4% 2011 -7.1% -8.7% 1.6% 2010 12.9% 17.6% -4.7% 2009 31.2% 35.1% -3.9%