This document presents performance data for the Goodreid U.S. Small Cap Equity Portfolio Composite in both Canadian and U.S. dollars versus the Russell 2000 Index from 2000 to 2016. It shows annualized returns for periods of 3 months, 1 year, 3 years, 5 years, 10 years, and since inception, as well as annual returns. For most periods, the portfolio has outperformed the index, particularly over longer time horizons. However, in some recent individual years like 2015 and YTD 2016, the portfolio has underperformed the index.
1. $6,446,304
$2,932,670
$500,000
$2,000,000
$3,500,000
$5,000,000
$6,500,000
$8,000,000
2000 2001 2002 2003 2004 2005 2006 2007 2008 2009 2010 2011 2012 2013 2014 2015 2016
Goodreid U.S. Small Cap Portfolio Composite (CAD - Gross of Fees)
Russell 2000 Index (CAD)
$1,000,000
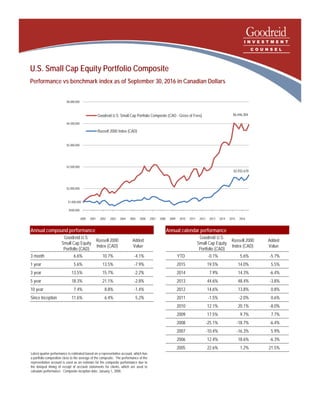
U.S. Small Cap Equity Portfolio Composite
Performance vs benchmark index as of September 30, 2016 in Canadian Dollars
Latest quarter performance is estimated based on a representative account, which has
a portfolio composition close to the average of the composite. The performance of the
representative account is used as an estimate for the composite performance due to
the delayed timing of receipt of account statements for clients, which are used to
calculate performance. Composite inception date: January 1, 2000.
Annual compound performance
Goodreid U.S.
Small Cap Equity
Portfolio (CAD)
Russell 2000
Index (CAD)
Added
Value
3 month 6.6% 10.7% -4.1%
1 year 5.6% 13.5% -7.9%
3 year 13.5% 15.7% -2.2%
5 year 18.3% 21.1% -2.8%
10 year 7.4% 8.8% -1.4%
Since Inception 11.6% 6.4% 5.2%
Annual calendar performance
Goodreid U.S.
Small Cap Equity
Portfolio (CAD)
Russell 2000
Index (CAD)
Added
Value
YTD -0.1% 5.6% -5.7%
2015 19.5% 14.0% 5.5%
2014 7.9% 14.3% -6.4%
2013 44.6% 48.4% -3.8%
2012 14.6% 13.8% 0.8%
2011 -1.5% -2.0% 0.6%
2010 12.1% 20.1% -8.0%
2009 17.5% 9.7% 7.7%
2008 -25.1% -18.7% -6.4%
2007 -10.4% -16.3% 5.9%
2006 12.4% 18.6% -6.3%
2005 22.6% 1.2% 21.5%
2. U.S. Small Cap Equity Portfolio Composite
Performance vs benchmark index as of September 30, 2016 in U.S. Dollars
Latest quarter performance is estimated based on a representative account, which has
a portfolio composition close to the average of the composite. The performance of the
representative account is used as an estimate for the composite performance due to
the delayed timing of receipt of account statements for clients, which are used to
calculate performance. Composite inception date: January 1, 2000.
$6,910,191
$3,100,754
$500,000
$2,000,000
$3,500,000
$5,000,000
$6,500,000
$8,000,000
2000 2001 2002 2003 2004 2005 2006 2007 2008 2009 2010 2011 2012 2013 2014 2015 2016
Goodreid U.S. Small Cap Portfolio Composite (USD - Gross of fees)
Russell 2000 Index (USD)
$1,000,000
Annual compound performance
Goodreid U.S.
Small Cap Equity
Portfolio (USD)
Russell 2000
Index (USD)
Added
Value
3 month 5.0% 9.1% -4.1%
1 year 7.5% 15.5% -8.0%
3 year 4.7% 6.7% -2.0%
5 year 13.2% 15.8% -2.6%
10 year 5.6% 7.1% -1.5%
Since Inception 12.2% 7.0% 5.2%
Annual calendar performance
Goodreid U.S.
Small Cap Equity
Portfolio (USD)
Russell 2000
Index (USD)
Added
Value
YTD 5.4% 11.5% -6.1%
2015 0.1% -4.4% 4.5%
2014 -0.3% 4.9% -5.2%
2013 35.3% 38.8% -3.5%
2012 17.1% 16.3% 0.8%
2011 -3.7% -4.2% 0.5%
2010 18.8% 26.9% -8.1%
2009 36.1% 27.2% 8.9%
2008 -39.0% -33.8% -5.2%
2007 5.4% -1.6% 7.0%
2006 12.1% 18.4% -6.3%
2005 26.7% 4.6% 22.1%