SlideShare a Scribd company logo
1 of 1
Download to read offline
DATA INPUT Inv. PMT
Property Cost PV 75,000.00$
Loan AMT (73,000.00)$ Annual PMT Interest of PMT Ann. EBITDA Depreciation Income Taxes (2,000.00)$
Int Rate 0.03 1 $4,906.75 $2,190.00 6,600.00$ 2,181.00$ -780.15 913.10$
Years 20 2 $4,906.75 $2,108.50 6,600.00$ 2,181.00$ -808.68 884.58$
Tax Rate 0.35 3 $4,906.75 $2,024.55 6,600.00$ 2,181.00$ -838.06 855.20$
Down PMT (2,000.00)$ 4 $4,906.75 $1,938.08 6,600.00$ 2,181.00$ -868.32 824.93$
Future Value of RE 75,000.00$ 5 $4,906.75 $1,849.02 6,600.00$ 2,181.00$ -899.49 793.76$
Cap. Rate(Avg EBITDA/Cost) 0.0880 6 $4,906.75 $1,757.29 6,600.00$ 2,181.00$ -931.60 761.66$
7 $4,906.75 $1,662.81 6,600.00$ 2,181.00$ -964.67 728.59$
8 $4,906.75 $1,565.49 6,600.00$ 2,181.00$ -998.73 694.53$
9 $4,906.75 $1,465.25 6,600.00$ 2,181.00$ -1033.81 659.44$
10 $4,906.75 $1,362.01 6,600.00$ 2,181.00$ -1069.95 623.31$
11 $4,906.75 $1,255.67 6,600.00$ 2,181.00$ -1107.17 586.09$
12 $4,906.75 $1,146.13 6,600.00$ 2,181.00$ -1145.50 547.75$
13 $4,906.75 $1,033.32 6,600.00$ 2,181.00$ -1184.99 508.26$
14 $4,906.75 $917.11 6,600.00$ 2,181.00$ -1225.66 467.59$
15 $4,906.75 $797.42 6,600.00$ 2,181.00$ -1267.55 425.70$
16 $4,906.75 $674.14 6,600.00$ 2,181.00$ -1310.70 382.55$
17 $4,906.75 $547.17 6,600.00$ 2,181.00$ -1355.14 338.11$
18 $4,906.75 $416.38 6,600.00$ 2,181.00$ -1400.92 292.34$
19 $4,906.75 $281.67 6,600.00$ 2,181.00$ -1448.07 245.19$
20 $4,906.75 $142.91 6,600.00$ 2,181.00$ -1496.63 196.62$
75,000.00$
Average NOI 6,600.00$
After TAX IRR on Investment 43%

More Related Content

What's hot

• Financials
 • Financials • Financials
• Financialsfinance5
 
energy east 2Q08_EAS_Supp_Schedules
energy east 2Q08_EAS_Supp_Schedulesenergy east 2Q08_EAS_Supp_Schedules
energy east 2Q08_EAS_Supp_Schedulesfinance40
 
Item #13 PPT 4th Qrt Report
Item #13  PPT 4th Qrt ReportItem #13  PPT 4th Qrt Report
Item #13 PPT 4th Qrt Reportahcitycouncil
 
Well_Economics_Forcast_Back_In__W_I
Well_Economics_Forcast_Back_In__W_IWell_Economics_Forcast_Back_In__W_I
Well_Economics_Forcast_Back_In__W_IAngelo Gasendo
 
TMA Town Hall Series: Leading Through Crisis; "Oil & Gas Distress: Price and ...
TMA Town Hall Series: Leading Through Crisis; "Oil & Gas Distress: Price and ...TMA Town Hall Series: Leading Through Crisis; "Oil & Gas Distress: Price and ...
TMA Town Hall Series: Leading Through Crisis; "Oil & Gas Distress: Price and ...Lugenbuhl, Wheaton, Peck, Rankin & Hubbard
 
Long board surf loft 129,000
Long board surf loft 129,000Long board surf loft 129,000
Long board surf loft 129,000Ron Clayton
 
South Mackay Growth Chart
South Mackay Growth ChartSouth Mackay Growth Chart
South Mackay Growth Chartchrislaval
 
Supplemental Data – Q2 2014 Earnings Call
Supplemental Data – Q2 2014 Earnings CallSupplemental Data – Q2 2014 Earnings Call
Supplemental Data – Q2 2014 Earnings Callirneenahpaperinc
 
BNC Subprime Mortgage Ratesheet 7-2006
BNC Subprime Mortgage Ratesheet 7-2006BNC Subprime Mortgage Ratesheet 7-2006
BNC Subprime Mortgage Ratesheet 7-2006Bitsytask
 
New Century Subprime Mortgage Matrix (Stated Doc / 80%, 550 FICO, 50% DTI) 7-...
New Century Subprime Mortgage Matrix (Stated Doc / 80%, 550 FICO, 50% DTI) 7-...New Century Subprime Mortgage Matrix (Stated Doc / 80%, 550 FICO, 50% DTI) 7-...
New Century Subprime Mortgage Matrix (Stated Doc / 80%, 550 FICO, 50% DTI) 7-...Bitsytask
 
Tax planning for the dentist in an era of uncertainty
Tax planning for the dentist in an era of uncertaintyTax planning for the dentist in an era of uncertainty
Tax planning for the dentist in an era of uncertaintygppcpa
 
Subprime Underwriting Matrix, 100% LTV down to 580 FICO
Subprime Underwriting Matrix, 100% LTV down to 580 FICOSubprime Underwriting Matrix, 100% LTV down to 580 FICO
Subprime Underwriting Matrix, 100% LTV down to 580 FICOBitsytask
 

What's hot (18)

• Financials
 • Financials • Financials
• Financials
 
4.9 Preparing the Financial Reports
4.9 Preparing the Financial Reports4.9 Preparing the Financial Reports
4.9 Preparing the Financial Reports
 
energy east 2Q08_EAS_Supp_Schedules
energy east 2Q08_EAS_Supp_Schedulesenergy east 2Q08_EAS_Supp_Schedules
energy east 2Q08_EAS_Supp_Schedules
 
Item #13 PPT 4th Qrt Report
Item #13  PPT 4th Qrt ReportItem #13  PPT 4th Qrt Report
Item #13 PPT 4th Qrt Report
 
Well_Economics_Forcast_Back_In__W_I
Well_Economics_Forcast_Back_In__W_IWell_Economics_Forcast_Back_In__W_I
Well_Economics_Forcast_Back_In__W_I
 
TMA Town Hall Series: Leading Through Crisis; "Oil & Gas Distress: Price and ...
TMA Town Hall Series: Leading Through Crisis; "Oil & Gas Distress: Price and ...TMA Town Hall Series: Leading Through Crisis; "Oil & Gas Distress: Price and ...
TMA Town Hall Series: Leading Through Crisis; "Oil & Gas Distress: Price and ...
 
Exhibits - Copy
Exhibits - CopyExhibits - Copy
Exhibits - Copy
 
Long board surf loft 129,000
Long board surf loft 129,000Long board surf loft 129,000
Long board surf loft 129,000
 
South Mackay Growth Chart
South Mackay Growth ChartSouth Mackay Growth Chart
South Mackay Growth Chart
 
Sir thomas circle
Sir thomas circleSir thomas circle
Sir thomas circle
 
Supplemental Data – Q2 2014 Earnings Call
Supplemental Data – Q2 2014 Earnings CallSupplemental Data – Q2 2014 Earnings Call
Supplemental Data – Q2 2014 Earnings Call
 
6.5 Posting the Purchases Journal
6.5 Posting the Purchases Journal6.5 Posting the Purchases Journal
6.5 Posting the Purchases Journal
 
BNC Subprime Mortgage Ratesheet 7-2006
BNC Subprime Mortgage Ratesheet 7-2006BNC Subprime Mortgage Ratesheet 7-2006
BNC Subprime Mortgage Ratesheet 7-2006
 
New Century Subprime Mortgage Matrix (Stated Doc / 80%, 550 FICO, 50% DTI) 7-...
New Century Subprime Mortgage Matrix (Stated Doc / 80%, 550 FICO, 50% DTI) 7-...New Century Subprime Mortgage Matrix (Stated Doc / 80%, 550 FICO, 50% DTI) 7-...
New Century Subprime Mortgage Matrix (Stated Doc / 80%, 550 FICO, 50% DTI) 7-...
 
Q1 2013 earnings call v2
Q1 2013 earnings call v2Q1 2013 earnings call v2
Q1 2013 earnings call v2
 
Q1 2013 earnings call v2
Q1 2013 earnings call v2Q1 2013 earnings call v2
Q1 2013 earnings call v2
 
Tax planning for the dentist in an era of uncertainty
Tax planning for the dentist in an era of uncertaintyTax planning for the dentist in an era of uncertainty
Tax planning for the dentist in an era of uncertainty
 
Subprime Underwriting Matrix, 100% LTV down to 580 FICO
Subprime Underwriting Matrix, 100% LTV down to 580 FICOSubprime Underwriting Matrix, 100% LTV down to 580 FICO
Subprime Underwriting Matrix, 100% LTV down to 580 FICO
 

Similar to Small After Tax RE IRR

Sample Investment PropertyAverage InlandSan Diego HomeASSUMPTION.docx
Sample Investment PropertyAverage InlandSan Diego HomeASSUMPTION.docxSample Investment PropertyAverage InlandSan Diego HomeASSUMPTION.docx
Sample Investment PropertyAverage InlandSan Diego HomeASSUMPTION.docxagnesdcarey33086
 
Commercial Property Value Webinar
Commercial Property Value WebinarCommercial Property Value Webinar
Commercial Property Value Webinarucjaclyn
 
J.S. Die & Mold - Operations Review 2006-12-21
J.S. Die & Mold - Operations Review 2006-12-21J.S. Die & Mold - Operations Review 2006-12-21
J.S. Die & Mold - Operations Review 2006-12-21Bob Sloma
 
Principals of Business Finance
Principals of Business FinancePrincipals of Business Finance
Principals of Business FinanceKathleen Boushele
 
Potential Gross Income (PGI) EstimatorPlease Only Change ite.docx
Potential Gross Income (PGI) EstimatorPlease Only Change ite.docxPotential Gross Income (PGI) EstimatorPlease Only Change ite.docx
Potential Gross Income (PGI) EstimatorPlease Only Change ite.docxChantellPantoja184
 
T1FX stable30 investment $30,000
T1FX stable30 investment  $30,000T1FX stable30 investment  $30,000
T1FX stable30 investment $30,000WENDY FOO
 
T1FX stable30 investment $30,000
T1FX stable30 investment  $30,000T1FX stable30 investment  $30,000
T1FX stable30 investment $30,000Wendy Foo
 
Owens_Minor3Q2008_webcast_slides
Owens_Minor3Q2008_webcast_slidesOwens_Minor3Q2008_webcast_slides
Owens_Minor3Q2008_webcast_slidesfinance33
 
Financial Forecasting
Financial ForecastingFinancial Forecasting
Financial ForecastingJamariHodges1
 
Financial Forecasting
Financial ForecastingFinancial Forecasting
Financial ForecastingTravonnLee
 
Corporate Finance Capital Budgeting Case
Corporate Finance Capital Budgeting CaseCorporate Finance Capital Budgeting Case
Corporate Finance Capital Budgeting CaseJoy McVicker
 
5YR Equity ValuationNOTE Rule of thumb - 20 growth in forecast o.docx
5YR Equity ValuationNOTE Rule of thumb - 20 growth in forecast o.docx5YR Equity ValuationNOTE Rule of thumb - 20 growth in forecast o.docx
5YR Equity ValuationNOTE Rule of thumb - 20 growth in forecast o.docxevonnehoggarth79783
 
Owens_Minor_2Q2008_webcast_slides_v_final
Owens_Minor_2Q2008_webcast_slides_v_finalOwens_Minor_2Q2008_webcast_slides_v_final
Owens_Minor_2Q2008_webcast_slides_v_finalfinance33
 
Forecast Vs Actual Budget Powerpoint Presentation Slides
Forecast Vs Actual Budget Powerpoint Presentation SlidesForecast Vs Actual Budget Powerpoint Presentation Slides
Forecast Vs Actual Budget Powerpoint Presentation SlidesSlideTeam
 
Forecast Vs Actual Budget PowerPoint Presentation Slides
Forecast Vs Actual Budget PowerPoint Presentation Slides Forecast Vs Actual Budget PowerPoint Presentation Slides
Forecast Vs Actual Budget PowerPoint Presentation Slides SlideTeam
 
Chapter 10generac flujo caja
Chapter 10generac flujo cajaChapter 10generac flujo caja
Chapter 10generac flujo cajafedericoblanco
 
PV Project Development Economic Feasibility Financial Model Baseline Case
PV Project Development Economic Feasibility Financial Model Baseline CasePV Project Development Economic Feasibility Financial Model Baseline Case
PV Project Development Economic Feasibility Financial Model Baseline CaseFadi Maalouf, PMP
 

Similar to Small After Tax RE IRR (20)

Sample Investment PropertyAverage InlandSan Diego HomeASSUMPTION.docx
Sample Investment PropertyAverage InlandSan Diego HomeASSUMPTION.docxSample Investment PropertyAverage InlandSan Diego HomeASSUMPTION.docx
Sample Investment PropertyAverage InlandSan Diego HomeASSUMPTION.docx
 
Commercial Property Value Webinar
Commercial Property Value WebinarCommercial Property Value Webinar
Commercial Property Value Webinar
 
proforma sample
proforma sampleproforma sample
proforma sample
 
J.S. Die & Mold - Operations Review 2006-12-21
J.S. Die & Mold - Operations Review 2006-12-21J.S. Die & Mold - Operations Review 2006-12-21
J.S. Die & Mold - Operations Review 2006-12-21
 
Principals of Business Finance
Principals of Business FinancePrincipals of Business Finance
Principals of Business Finance
 
Potential Gross Income (PGI) EstimatorPlease Only Change ite.docx
Potential Gross Income (PGI) EstimatorPlease Only Change ite.docxPotential Gross Income (PGI) EstimatorPlease Only Change ite.docx
Potential Gross Income (PGI) EstimatorPlease Only Change ite.docx
 
T1FX stable30 investment $30,000
T1FX stable30 investment  $30,000T1FX stable30 investment  $30,000
T1FX stable30 investment $30,000
 
T1FX stable30 investment $30,000
T1FX stable30 investment  $30,000T1FX stable30 investment  $30,000
T1FX stable30 investment $30,000
 
Owens_Minor3Q2008_webcast_slides
Owens_Minor3Q2008_webcast_slidesOwens_Minor3Q2008_webcast_slides
Owens_Minor3Q2008_webcast_slides
 
02 Project Summary
02 Project Summary02 Project Summary
02 Project Summary
 
Financial Forecasting
Financial ForecastingFinancial Forecasting
Financial Forecasting
 
Financial Forecasting
Financial ForecastingFinancial Forecasting
Financial Forecasting
 
Corporate Finance Capital Budgeting Case
Corporate Finance Capital Budgeting CaseCorporate Finance Capital Budgeting Case
Corporate Finance Capital Budgeting Case
 
5YR Equity ValuationNOTE Rule of thumb - 20 growth in forecast o.docx
5YR Equity ValuationNOTE Rule of thumb - 20 growth in forecast o.docx5YR Equity ValuationNOTE Rule of thumb - 20 growth in forecast o.docx
5YR Equity ValuationNOTE Rule of thumb - 20 growth in forecast o.docx
 
Owens_Minor_2Q2008_webcast_slides_v_final
Owens_Minor_2Q2008_webcast_slides_v_finalOwens_Minor_2Q2008_webcast_slides_v_final
Owens_Minor_2Q2008_webcast_slides_v_final
 
Forecast Vs Actual Budget Powerpoint Presentation Slides
Forecast Vs Actual Budget Powerpoint Presentation SlidesForecast Vs Actual Budget Powerpoint Presentation Slides
Forecast Vs Actual Budget Powerpoint Presentation Slides
 
Forecast Vs Actual Budget PowerPoint Presentation Slides
Forecast Vs Actual Budget PowerPoint Presentation Slides Forecast Vs Actual Budget PowerPoint Presentation Slides
Forecast Vs Actual Budget PowerPoint Presentation Slides
 
Car Net Business Plan
Car Net Business PlanCar Net Business Plan
Car Net Business Plan
 
Chapter 10generac flujo caja
Chapter 10generac flujo cajaChapter 10generac flujo caja
Chapter 10generac flujo caja
 
PV Project Development Economic Feasibility Financial Model Baseline Case
PV Project Development Economic Feasibility Financial Model Baseline CasePV Project Development Economic Feasibility Financial Model Baseline Case
PV Project Development Economic Feasibility Financial Model Baseline Case
 

Small After Tax RE IRR

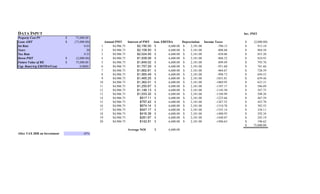
  • 1. DATA INPUT Inv. PMT Property Cost PV 75,000.00$ Loan AMT (73,000.00)$ Annual PMT Interest of PMT Ann. EBITDA Depreciation Income Taxes (2,000.00)$ Int Rate 0.03 1 $4,906.75 $2,190.00 6,600.00$ 2,181.00$ -780.15 913.10$ Years 20 2 $4,906.75 $2,108.50 6,600.00$ 2,181.00$ -808.68 884.58$ Tax Rate 0.35 3 $4,906.75 $2,024.55 6,600.00$ 2,181.00$ -838.06 855.20$ Down PMT (2,000.00)$ 4 $4,906.75 $1,938.08 6,600.00$ 2,181.00$ -868.32 824.93$ Future Value of RE 75,000.00$ 5 $4,906.75 $1,849.02 6,600.00$ 2,181.00$ -899.49 793.76$ Cap. Rate(Avg EBITDA/Cost) 0.0880 6 $4,906.75 $1,757.29 6,600.00$ 2,181.00$ -931.60 761.66$ 7 $4,906.75 $1,662.81 6,600.00$ 2,181.00$ -964.67 728.59$ 8 $4,906.75 $1,565.49 6,600.00$ 2,181.00$ -998.73 694.53$ 9 $4,906.75 $1,465.25 6,600.00$ 2,181.00$ -1033.81 659.44$ 10 $4,906.75 $1,362.01 6,600.00$ 2,181.00$ -1069.95 623.31$ 11 $4,906.75 $1,255.67 6,600.00$ 2,181.00$ -1107.17 586.09$ 12 $4,906.75 $1,146.13 6,600.00$ 2,181.00$ -1145.50 547.75$ 13 $4,906.75 $1,033.32 6,600.00$ 2,181.00$ -1184.99 508.26$ 14 $4,906.75 $917.11 6,600.00$ 2,181.00$ -1225.66 467.59$ 15 $4,906.75 $797.42 6,600.00$ 2,181.00$ -1267.55 425.70$ 16 $4,906.75 $674.14 6,600.00$ 2,181.00$ -1310.70 382.55$ 17 $4,906.75 $547.17 6,600.00$ 2,181.00$ -1355.14 338.11$ 18 $4,906.75 $416.38 6,600.00$ 2,181.00$ -1400.92 292.34$ 19 $4,906.75 $281.67 6,600.00$ 2,181.00$ -1448.07 245.19$ 20 $4,906.75 $142.91 6,600.00$ 2,181.00$ -1496.63 196.62$ 75,000.00$ Average NOI 6,600.00$ After TAX IRR on Investment 43%