Successful Portfolios Guide to Our Client Reports
•
1 like•403 views

Successful Portfolios Client Report
![1. The Yearly and Monthly Tables
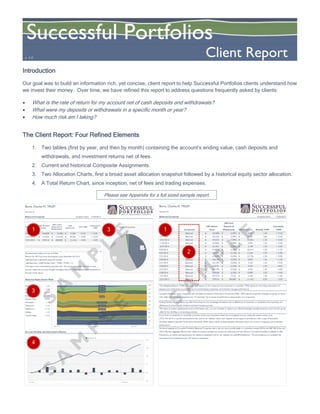
Clients want to know, at a glance, how their accounts are performing. The tables clearly display net of fees returns
since inception (Cumulative TWR), year to date (YTD TWR), and for each month (Monthly TWR). The time-weighted
return formula adjusts for the distortions created by deposits and withdrawals and is a requirement of the Global
Investment Performance Standards (GIPS). Successful Portfolios claims compliance with the GIPS standards and has
been independently verified for the periods March 1, 2010 to March 31, 2014.
The rate of cash deposits and withdraws is an important factor to a retirement account and it can be easy to lose track
of these transactions, especially if the amount or timing varies. For this important reason, we summarize net deposits
and withdrawals (US$ Cash Deposits and Withdrawals) by year and month.
The green arrows on the figure to the left
demonstrate some of the links between the Yearly
and Monthly Tables in the Client Report. Monthly
withdrawals of $2,995 are summed in the Yearly
Table for total withdrawals of $5,990 so far in 2015.
To arrive at the 2014 annual return of 12.8%, take the
product of 1 plus the monthly returns, then subtract 1
from that product. Cumulative returns are calculated
in the same manner.
𝐴𝑛𝑛. 𝑅𝑒𝑡. = [(1 + 𝐽𝑎𝑛) × (1 + 𝐹𝑒𝑏) … × (1 + 𝐷𝑒𝑐)] − 1
2. Composite Assignment
Successful Portfolios manages client portfolios according to mutually agreed risk and return mandates, targeting a
suitable asset class allocation (as seen in the pie chart, a mix of about 40% equities, 60% bonds and cash). As a rule,
a higher allocation to stocks indicates more risk and return potential. There are exceptions. For example, a portfolio
allocated to defensive sector, high-quality, low-beta stocks can be less risky than a portfolio of long duration, high yield
bonds.
We assign accounts to composites based on a client’s risk and return mandate, illustrated by the red arrow above.
These Composites include, in order of decreasing risk and return potential, (1) Growth, (2) Growth and Income, (3)
Balanced, (4) Income and Growth, and (5) Capital Preservation. Our Composite Reports may be found on our
website, www.successfulportfolios.com. A list of all Composites with descriptions is available upon request.
YEARLY TABLE
D ate
US$ M arket
Value
US$ C ash
D epo sits &
Withdrawals
US$
Gain/ Lo ss
YT D T WR
C umulative
T WR
2/28/2015 425,898$ (5,990)$ 17,284$ + 4.2% + 17.2%
12/31/2014 414,525$ (14,433)$ 49,326$ + 12.8% + 12.4%
12/31/2013 379,516$ 300,000$ (1,142)$ - 0.3% - 0.3%
MONTHLY TABLE
Date Composite
US$ Market
Value
US$ Cash
Deposits &
Withdrawals
US$
Gain/Loss
Monthly
TWR
Cumulative
TWR
2/28/2015 Balanced 425,898$ (2,995)$ 6,501$ 1.6% + 17.2%
1/31/2015 Balanced 422,361$ (2,995)$ 10,783$ 2.6% + 15.4%
12/31/2014 Balanced 414,525$ (2,995)$ (5,502)$ -1.3% + 12.4%
11/30/2014 Balanced 423,056$ (2,995)$ 4,975$ 1.2% + 13.9%
10/31/2014 Balanced 421,051$ (2,995)$ 5,198$ 1.3% + 12.6%
9/30/2014 Balanced 418,826$ (2,350)$ (6,551)$ -1.5% + 11.2%
8/31/2014 Balanced 427,761$ (2,100)$ 11,246$ 2.7% + 12.9%
7/31/2014 Balanced 418,589$ (2,350)$ (5,170)$ -1.2% + 10.0%
6/30/2014 Balanced 426,106$ (2,350)$ 6,875$ 1.6% + 11.3%
5/31/2014 Balanced 421,553$ (2,350)$ 5,163$ 1.2% + 9.5%
4/30/2014 Balanced 418,731$ (2,350)$ 9,294$ 2.3% + 8.2%
3/31/2014 Balanced 411,739$ (2,350)$ 5,525$ 1.4% + 5.8%
2/28/2014 Balanced 408,568$ (2,350)$ 13,090$ 3.3% + 4.4%
1/31/2014 Balanced 397,774$ 13,102$ 5,182$ 1.3% + 1.0%
12/31/2013 Balanced 379,516$ 300,000$ (1,142)$ -0.3% - 0.3%
Gains and losses also
expressed in US$
Accounts with similar mandates are grouped into Composites.](data:image/gif;base64,R0lGODlhAQABAIAAAAAAAP///yH5BAEAAAAALAAAAAABAAEAAAIBRAA7)
Recommended
Recommended
More Related Content
What's hot
What's hot (18)
Viewers also liked
Viewers also liked (11)
Similar to Successful Portfolios Guide to Our Client Reports
Similar to Successful Portfolios Guide to Our Client Reports (20)
Recently uploaded
Recently uploaded (20)
Successful Portfolios Guide to Our Client Reports
- 1. Burns, Charles M. TRUST Balanced Composite Inception Date: 12/26/2013 D ate US$ M arket Value US$ C ash D epo sits & Withdrawals US$ Gain/ Lo ss YT D T WR C umulative T WR 2/28/2015 425,898$ (5,990)$ 17,284$ + 4.2% + 17.2% 12/31/2014 414,525$ (14,433)$ 49,326$ + 12.8% + 12.4% 12/31/2013 379,516$ 300,000$ (1,142)$ - 0.3% - 0.3% All performance values are net of all fees. Returns for 2013 are from the inception date, December 26, 2013. Historical Equity Sector Walk Materials 2.9% Info. Tech. 9.4% Financials 10.3% Energy 15.8% Consmr Discr. 11.0% Industrials 5.2% Telecomm. 8.9% Healthcare 14.5% Utilities 7.4% Consmr Stapl. 14.6% Account Monthly and Cummulative Returns Account: 8 US$ Gain/Loss is estimated using the formula: US$ Gain/Loss = (US$ Market Value * TWR) / (TWR + 1). This report is for informational purposes only. We cannot guarantee that returns and account values are accurate, though we believe they are. Please see additional disclosures at the end of this report. -5% 0% 5% 10% 15% 20% DEC 2013 DEC 2014 Account: 8 Consmr Stapl. Utilities Healthcare Telecomm. Industrials Consmr Discr. Energy Financials Info. Tech. Materials 0% 10% 20% 30% 40% 50% 60% 70% 80% 90% 100% DEC 2013 JUN 2014 DEC 2014 EQ 42% FI 56% Cash 2% Asset Allocation Burns, Charles M. TRUST Balanced Composite Inception Date: 12/26/2013 Date Composite US$ Market Value US$ Cash Deposits & Withdrawals US$ Gain/Loss Monthly TWR Cumulative TWR 2/28/2015 Balanced 425,898$ (2,995)$ 6,501$ 1.6% + 17.2% 1/31/2015 Balanced 422,361$ (2,995)$ 10,783$ 2.6% + 15.4% 12/31/2014 Balanced 414,525$ (2,995)$ (5,502)$ -1.3% + 12.4% 11/30/2014 Balanced 423,056$ (2,995)$ 4,975$ 1.2% + 13.9% 10/31/2014 Balanced 421,051$ (2,995)$ 5,198$ 1.3% + 12.6% 9/30/2014 Balanced 418,826$ (2,350)$ (6,551)$ -1.5% + 11.2% 8/31/2014 Balanced 427,761$ (2,100)$ 11,246$ 2.7% + 12.9% 7/31/2014 Balanced 418,589$ (2,350)$ (5,170)$ -1.2% + 10.0% 6/30/2014 Balanced 426,106$ (2,350)$ 6,875$ 1.6% + 11.3% 5/31/2014 Balanced 421,553$ (2,350)$ 5,163$ 1.2% + 9.5% 4/30/2014 Balanced 418,731$ (2,350)$ 9,294$ 2.3% + 8.2% 3/31/2014 Balanced 411,739$ (2,350)$ 5,525$ 1.4% + 5.8% 2/28/2014 Balanced 408,568$ (2,350)$ 13,090$ 3.3% + 4.4% 1/31/2014 Balanced 397,774$ 13,102$ 5,182$ 1.3% + 1.0% 12/31/2013 Balanced 379,516$ 300,000$ (1,142)$ -0.3% - 0.3% Account: 8 Time Weighted Return (TWR) is a widely used measure of the compound rate of growth in a portfolio. TWR adjusts for the timing and amount of deposits and withdrawals on portfolio returns and facilitates comparison of investment manager performance. Successful Portfolios claims compliance with the Global Investment Performance Standards (GIPS). GIPS requires investment managers to group accounts with similar risk and return objectives into “Composites” for purposes of performance measurement and comparison. Ending Monthly Market Values may differ from those on your brokerage statements due to differences in trade-date vs. settlement-date reporting, and differences in accounting for dividend and bond interest accruals. This report provides supplemental account information only. It is not intended to replace your official brokerage custodial statement and it should not be relied for tax, lending, or accounting purposes. If you have any questions or would like to further review your investment objectives and assigned account composite, please contact us at (727) 744-3614 or use the secure private chat tool on our website. Upon your request, we are happy to provide you with a copy of Successful Portfolios Global Investment Performance Standards (GIPS) Report which includes detailed information about our account composites and investment performance. Accounts assigned to Successful Portfolios’ Balanced Composite seek a risk and return profile similar to a portfolio invested 50% in the S&P 500 Index and 50% in Barclays Aggregate Bond Index, subject to investor preferences, unique circumstances and risk tolerance. Successful Portfolios is pleased to offer Finametrica, an award-winning personal risk tolerance assessment tool on our website, SuccessfulPortfolios.com. We encourage you to complete this educational and revealing personal risk tolerance assessment. Introduction Our goal was to build an information rich, yet concise, client report to help Successful Portfolios clients understand how we invest their money. Over time, we have refined this report to address questions frequently asked by clients: What is the rate of return for my account net of cash deposits and withdrawals? What were my deposits or withdrawals in a specific month or year? How much risk am I taking? The Client Report: Four Refined Elements 1. Two tables (first by year, and then by month) containing the account’s ending value, cash deposits and withdrawals, and investment returns net of fees. 2. Current and historical Composite Assignments. 3. Two Allocation Charts, first a broad asset allocation snapshot followed by a historical equity sector allocation. 4. A Total Return Chart, since inception, net of fees and trading expenses. 1 1 3 3 4 Please see Appendix for a full sized sample report. 2 Successful Portfolios Client Reportv. 1.0
- 2. 1. The Yearly and Monthly Tables Clients want to know, at a glance, how their accounts are performing. The tables clearly display net of fees returns since inception (Cumulative TWR), year to date (YTD TWR), and for each month (Monthly TWR). The time-weighted return formula adjusts for the distortions created by deposits and withdrawals and is a requirement of the Global Investment Performance Standards (GIPS). Successful Portfolios claims compliance with the GIPS standards and has been independently verified for the periods March 1, 2010 to March 31, 2014. The rate of cash deposits and withdraws is an important factor to a retirement account and it can be easy to lose track of these transactions, especially if the amount or timing varies. For this important reason, we summarize net deposits and withdrawals (US$ Cash Deposits and Withdrawals) by year and month. The green arrows on the figure to the left demonstrate some of the links between the Yearly and Monthly Tables in the Client Report. Monthly withdrawals of $2,995 are summed in the Yearly Table for total withdrawals of $5,990 so far in 2015. To arrive at the 2014 annual return of 12.8%, take the product of 1 plus the monthly returns, then subtract 1 from that product. Cumulative returns are calculated in the same manner. 𝐴𝑛𝑛. 𝑅𝑒𝑡. = [(1 + 𝐽𝑎𝑛) × (1 + 𝐹𝑒𝑏) … × (1 + 𝐷𝑒𝑐)] − 1 2. Composite Assignment Successful Portfolios manages client portfolios according to mutually agreed risk and return mandates, targeting a suitable asset class allocation (as seen in the pie chart, a mix of about 40% equities, 60% bonds and cash). As a rule, a higher allocation to stocks indicates more risk and return potential. There are exceptions. For example, a portfolio allocated to defensive sector, high-quality, low-beta stocks can be less risky than a portfolio of long duration, high yield bonds. We assign accounts to composites based on a client’s risk and return mandate, illustrated by the red arrow above. These Composites include, in order of decreasing risk and return potential, (1) Growth, (2) Growth and Income, (3) Balanced, (4) Income and Growth, and (5) Capital Preservation. Our Composite Reports may be found on our website, www.successfulportfolios.com. A list of all Composites with descriptions is available upon request. YEARLY TABLE D ate US$ M arket Value US$ C ash D epo sits & Withdrawals US$ Gain/ Lo ss YT D T WR C umulative T WR 2/28/2015 425,898$ (5,990)$ 17,284$ + 4.2% + 17.2% 12/31/2014 414,525$ (14,433)$ 49,326$ + 12.8% + 12.4% 12/31/2013 379,516$ 300,000$ (1,142)$ - 0.3% - 0.3% MONTHLY TABLE Date Composite US$ Market Value US$ Cash Deposits & Withdrawals US$ Gain/Loss Monthly TWR Cumulative TWR 2/28/2015 Balanced 425,898$ (2,995)$ 6,501$ 1.6% + 17.2% 1/31/2015 Balanced 422,361$ (2,995)$ 10,783$ 2.6% + 15.4% 12/31/2014 Balanced 414,525$ (2,995)$ (5,502)$ -1.3% + 12.4% 11/30/2014 Balanced 423,056$ (2,995)$ 4,975$ 1.2% + 13.9% 10/31/2014 Balanced 421,051$ (2,995)$ 5,198$ 1.3% + 12.6% 9/30/2014 Balanced 418,826$ (2,350)$ (6,551)$ -1.5% + 11.2% 8/31/2014 Balanced 427,761$ (2,100)$ 11,246$ 2.7% + 12.9% 7/31/2014 Balanced 418,589$ (2,350)$ (5,170)$ -1.2% + 10.0% 6/30/2014 Balanced 426,106$ (2,350)$ 6,875$ 1.6% + 11.3% 5/31/2014 Balanced 421,553$ (2,350)$ 5,163$ 1.2% + 9.5% 4/30/2014 Balanced 418,731$ (2,350)$ 9,294$ 2.3% + 8.2% 3/31/2014 Balanced 411,739$ (2,350)$ 5,525$ 1.4% + 5.8% 2/28/2014 Balanced 408,568$ (2,350)$ 13,090$ 3.3% + 4.4% 1/31/2014 Balanced 397,774$ 13,102$ 5,182$ 1.3% + 1.0% 12/31/2013 Balanced 379,516$ 300,000$ (1,142)$ -0.3% - 0.3% Gains and losses also expressed in US$ Accounts with similar mandates are grouped into Composites.
- 3. 3. Asset and Equity Sector Allocation Broad asset allocation for a client is displayed in a pie chart shown below. We use Bloomberg to “look through” the underlying investments, so that a bond ETF, for example, is properly recognized as a bond and not a stock. If a fund has a mix of stocks and bonds, say 50/50, we recognize these weightings in the allocation pie chart. We capture more granular information in the Equity Sector Walk, underneath the pie chart. The Equity Class is further divided among the ten equity sectors. Over time, some equity sectors will outperform others. As a result, sectors “drift” away from their initial weights and alter the portfolio’s risk and return potential, making the Sector Walk a useful tool for monitoring portfolio risk. In the Equity Sector Walk, sectors are stacked according to risk as measured by historical standard deviation of returns. The Materials Sector, at the top, is the most risky sector. Consumer Staples, at the bottom of the chart, is the least risky. 4. Total Return Net of Fees Total monthly returns and return from inception, net of all fees and trading expenses, are displayed in the chart to the right. The blue line corresponds to the Cumulative TWR shown in the Yearly and Monthly Tables. The vertical blue bars represent the monthly returns. Conclusion The Successful Portfolios Client Report has evolved over time based on client feedback. Please contact me, Bradley Norbom, CFA by phone 727-744-3614 or at brad@successfulportfolios.com with any questions, comments or suggestions.
- 4. Burns, Charles M. TRUST Balanced Composite Inception Date: 12/26/2013 D ate US$ M arket Value US$ C ash D epo sits & Withdrawals US$ Gain/ Lo ss YT D T WR C umulative T WR 2/28/2015 425,898$ (5,990)$ 17,284$ + 4.2% + 17.2% 12/31/2014 414,525$ (14,433)$ 49,326$ + 12.8% + 12.4% 12/31/2013 379,516$ 300,000$ (1,142)$ - 0.3% - 0.3% All performance values are net of all fees. Returns for 2013 are from the inception date, December 26, 2013. Historical Equity Sector Walk Materials 2.9% Info. Tech. 9.4% Financials 10.3% Energy 15.8% Consmr Discr. 11.0% Industrials 5.2% Telecomm. 8.9% Healthcare 14.5% Utilities 7.4% Consmr Stapl. 14.6% Account Monthly and Cummulative Returns This report is for informational purposes only. We cannot guarantee that returns and account values are accurate, though we believe they are. Please see additional disclosures at the end of this report. US$ Gain/Loss is estimated using the formula: US$ Gain/Loss = (US$ Market Value * TWR) / (TWR + 1). -5% 0% 5% 10% 15% 20% DEC 2013 DEC 2014 Account: 8 Consmr Stapl. Utilities Healthcare Telecomm. Industrials Consmr Discr. Energy Financials Info. Tech. Materials 0% 10% 20% 30% 40% 50% 60% 70% 80% 90% 100% DEC 2013 JUN 2014 DEC 2014 EQ 42% FI 56% Cash 2% Asset Allocation Appendix
- 5. Burns, Charles M. TRUST Balanced Composite Inception Date: 12/26/2013 Date Composite US$ Market Value US$ Cash Deposits & Withdrawals US$ Gain/Loss Monthly TWR Cumulative TWR 2/28/2015 Balanced 425,898$ (2,995)$ 6,501$ 1.6% + 17.2% 1/31/2015 Balanced 422,361$ (2,995)$ 10,783$ 2.6% + 15.4% 12/31/2014 Balanced 414,525$ (2,995)$ (5,502)$ -1.3% + 12.4% 11/30/2014 Balanced 423,056$ (2,995)$ 4,975$ 1.2% + 13.9% 10/31/2014 Balanced 421,051$ (2,995)$ 5,198$ 1.3% + 12.6% 9/30/2014 Balanced 418,826$ (2,350)$ (6,551)$ -1.5% + 11.2% 8/31/2014 Balanced 427,761$ (2,100)$ 11,246$ 2.7% + 12.9% 7/31/2014 Balanced 418,589$ (2,350)$ (5,170)$ -1.2% + 10.0% 6/30/2014 Balanced 426,106$ (2,350)$ 6,875$ 1.6% + 11.3% 5/31/2014 Balanced 421,553$ (2,350)$ 5,163$ 1.2% + 9.5% 4/30/2014 Balanced 418,731$ (2,350)$ 9,294$ 2.3% + 8.2% 3/31/2014 Balanced 411,739$ (2,350)$ 5,525$ 1.4% + 5.8% 2/28/2014 Balanced 408,568$ (2,350)$ 13,090$ 3.3% + 4.4% 1/31/2014 Balanced 397,774$ 13,102$ 5,182$ 1.3% + 1.0% 12/31/2013 Balanced 379,516$ 300,000$ (1,142)$ -0.3% - 0.3% If you have any questions or would like to further review your investment objectives and assigned account composite, please contact us at (727) 744-3614 or use the secure private chat tool on our website. Upon your request, we are happy to provide you with a copy of Successful Portfolios Global Investment Performance Standards (GIPS) Report which includes detailed information about our account composites and investment performance. Accounts assigned to Successful Portfolios’ Balanced Composite seek a risk and return profile similar to a portfolio invested 50% in the S&P 500 Index and 50% in Barclays Aggregate Bond Index, subject to investor preferences, unique circumstances and risk tolerance. Successful Portfolios is pleased to offer Finametrica, an award-winning personal risk tolerance assessment tool on our website, SuccessfulPortfolios.com. We encourage you to complete this educational and revealing personal risk tolerance assessment. Successful Portfolios claims compliance with the Global Investment Performance Standards (GIPS). GIPS requires investment managers to group accounts with similar risk and return objectives into “Composites” for purposes of performance measurement and comparison. Ending Monthly Market Values may differ from those on your brokerage statements due to differences in trade-date vs. settlement-date reporting, and differences in accounting for dividend and bond interest accruals. This report provides supplemental account information only. It is not intended to replace your official brokerage custodial statement and it should not be relied for tax, lending, or accounting purposes. Time Weighted Return (TWR) is a widely used measure of the compound rate of growth in a portfolio. TWR adjusts for the timing and amount of deposits and withdrawals on portfolio returns and facilitates comparison of investment manager performance.