Thermal Energy International - Q3 and YTD Revenue
•
0 likes•4,794 views

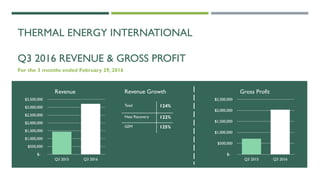
A few slides highlighting the strong revenue growth achieved by Thermal Energy International (TSX-V: TMG) for the third quarter and year-to-date of fiscal 2016.

Recommended
More Related Content
What's hot
What's hot (18)
Viewers also liked
Viewers also liked (20)
Similar to Thermal Energy International - Q3 and YTD Revenue
Similar to Thermal Energy International - Q3 and YTD Revenue (20)
More from Thermal Energy International Inc.
More from Thermal Energy International Inc. (20)
Recently uploaded
Recently uploaded (20)
Thermal Energy International - Q3 and YTD Revenue
- 1. THERMAL ENERGY INTERNATIONAL Q3 2016 REVENUE & GROSS PROFIT For the 3 months ended February 29, 2016 $- $500,000 $1,000,000 $1,500,000 $2,000,000 $2,500,000 $3,000,000 $3,500,000 Q3 2015 Q3 2016 Revenue $- $500,000 $1,000,000 $1,500,000 $2,000,000 $2,500,000 Q3 2015 Q3 2016 Gross ProfitRevenue Growth Total 124% Heat Recovery 122% GEM 125%
- 2. THERMAL ENERGY INTERNATIONAL YTD 2016 REVENUE & GROSS PROFIT For the 9 months ended February 29, 2016 $- $1,000,000 $2,000,000 $3,000,000 $4,000,000 $5,000,000 $6,000,000 $7,000,000 $8,000,000 $9,000,000 YTD 2015 YTD 2016 Revenue $- $500,000 $1,000,000 $1,500,000 $2,000,000 $2,500,000 $3,000,000 $3,500,000 $4,000,000 $4,500,000 $5,000,000 YTD 2015 YTD 2016 Gross ProfitRevenue Growth Total 94% Heat Recovery 130% GEM 67%
- 3. THERMAL ENERGY INTERNATIONAL YTD REVENUE BY PROJECT SIZE For the 9 months ended February 29, 2016 * Mega Projects = single projects representing more than $1.5 million in revenue. YTD 2012, 2013 and 2014 include 2, 1 and 1 Mega Projects respectively ** Compound annual growth rate $- $1,000,000 $2,000,000 $3,000,000 $4,000,000 $5,000,000 $6,000,000 $7,000,000 $8,000,000 $9,000,000 $10,000,000 YTD 2012 YTD 2013 YTD 2014 YTD 2015 YTD 2016 Non Mega Project Revenue Mega Project Revenue RevenueWith and Without Mega Projects* Revenue CAGR** when excluding Mega Projects*23%
- 4. Non-IFRS Financial Measures This presentation discusses our revenue excluding project values of $1.5 million or higher which is a non-IFRS financial measure, does not have a standardized meaning prescribed by IFRS and is therefore unlikely to be comparable to similar measures presented by other companies. This measure is provided as additional information to complement IFRS measures by providing further understanding of the Company’s results of operations from management’s perspective.Accordingly, it should not be considered in isolation nor as a substitute for analysis of our financial information reported under IFRS. Our revenue excluding project values of $1.5 million or higher is calculated for the first three quarters of each of the years since 2012 as follows: ($000’s) 9 months ended February 29, 2016 9 months ended February 28, 2015 9 months ended February 28, 2014 9 months ended February 28, 2013 9 months ended February 28, 2012 Revenue 8,279 4,275 8,434 6,331 9,692 Revenue from projects with values of $1.5 million or higher 0 0 2,245 1,601 6,017 Revenues excluding project values of $1.5 million or higher 8,279 4,275 6,189 4,730 3,675 Number of Mega Projects 0 0 1 1 2