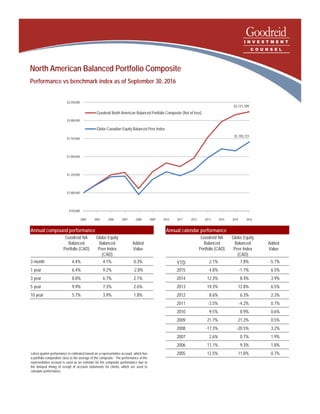
This document summarizes the performance of the North American Balanced Portfolio Composite versus a benchmark index from 2004 to 2016. It shows that the portfolio outperformed the index on a 3-year, 5-year and 10-year basis but underperformed on a 1-year and year-to-date basis. Specifically, the portfolio had 8.8% return over 3 years compared to 6.7% for the index.
1. North American Balanced Portfolio Composite
Performance vs benchmark index as of September 30, 2016
Latest quarter performance is estimated based on a representative account, which has
a portfolio composition close to the average of the composite. The performance of the
representative account is used as an estimate for the composite performance due to
the delayed timing of receipt of account statements for clients, which are used to
calculate performance.
$2,121,109
$1,703,721
$750,000
$1,000,000
$1,250,000
$1,500,000
$1,750,000
$2,000,000
$2,250,000
2004 2005 2006 2007 2008 2009 2010 2011 2012 2013 2014 2015 2016
Goodreid North American Balanced Portfolio Composite (Net of fees)
Globe Canadian Equity Balanced Peer Index
Annual compound performance
Goodreid NA
Balanced
Portfolio (CAD)
Globe Equity
Balanced
Peer Index
(CAD)
Added
Value
3 month 4.4% 4.1% 0.3%
1 year 6.4% 9.2% -2.8%
3 year 8.8% 6.7% 2.1%
5 year 9.9% 7.3% 2.6%
10 year 5.7% 3.9% 1.8%
Annual calendar performance
Goodreid NA
Balanced
Portfolio (CAD)
Globe Equity
Balanced
Peer Index
(CAD)
Added
Value
YTD 2.1% 7.8% -5.7%
2015 4.8% -1.7% 6.5%
2014 12.3% 8.4% 3.9%
2013 19.3% 12.8% 6.5%
2012 8.6% 6.3% 2.3%
2011 -3.5% -4.2% 0.7%
2010 9.5% 8.9% 0.6%
2009 21.7% 21.2% 0.5%
2008 -17.3% -20.5% 3.2%
2007 2.6% 0.7% 1.9%
2006 11.1% 9.3% 1.8%
2005 12.5% 11.8% 0.7%