Multi-scale impacts of land use on stormflow dynamics using radar and GIS
1. MULTI-SCALE IMPACTS OF LAND USE CHANGES ON
STORMFLOW DYNAMICS UTILIZING NEXRAD AND GIS
Timothy L. Negley1, Keith N. Eshleman, and Philip A. Townsend
University of Maryland Center for Environmental Science, Appalachian Laboratory, Frostburg, MD, U.S.A.
1Present address: ARCADIS US Inc., Syracuse, NY, U.S.A.
Introduction
The Appalachian Mountain region forms the headwaters for several of the
nation’s major rivers, including the Potomac and Susquehanna, and
provides water resources to tens of millions of residents of the U.S. east
coast. The rugged Northern Appalachian Plateau physiographic province in
western Pennsylvania, western Maryland, eastern Ohio, and West Virginia is
also rich in other natural resources--in particular the extensive coal seams
that have been mined since the 1800’s and that fueled U.S. economic
development through most of the 20th century. These deposits still contain
billions of tons of recoverable, bituminous coal that continue to sustain a
major portion of electricity generation in the U.S. While these steep,
mountainous regions are mostly forested, many local communities are
plagued by two water resources problems that apparently represent a legacy
of environmental degradation from both underground and surface mining
activities: poor water quality resulting from acid mine drainage and
economic losses and personal hardship from persistent flooding.
Objectives
The purpose of this study was to conduct a comparative, multi-scale
hydro-logical analysis of stormflow generation in the region in order to
assess the effects of surface mining and mined land reclamation practices
on flooding. While many hydrological and geomorphological studies of
flooding have focused on the Appalachian region (including papers by Smith
et al.,1996 and Sturdevant-Rees et al., 2001), few studies have examined
the association between flooding and surface mining/reclamation
activities. The primary objectives of the study were to:
• compare and contrast the stormflow responses of two gaged, “zero-
order” watersheds in the Georges Creek basin in western Maryland;
• relate measurable differences in hydrological response to
differences in land cover and soil properties impacted by previous
mining and reclamation (e.g. soil infiltration capacity, soil texture, bulk
density, and soil organic matter content); and
• quantitatively compare river-basin scale stormflow responses in the
Georges Creek and adjacent Savage River watersheds.
Surface coal mining and reclamation activities in Georges Creek
watershed near Barton, Maryland.
Flooding and flood damage in Georges Creek watershed during
early September 1996 associated with precipitation from the
remnants of Hurricane Fran. Photos courtesy of Randy
Richardson.
Study Sites and Methods
Stream discharge in two “zero-order” watersheds in the headwaters of
Georges Creek basin in western Maryland was gaged using truncated
“Montana” flumes beginning in 1999; precipitation inputs were measured
using a Belfort weighing gage. One of the watersheds (NEF1; area = 3
ha) is entirely covered by a young mixed deciduous forest, while the
second watershed (MAT1; area = 27 ha) is approximately 55% forested
and 45% surface-mined /reclamed land. Since the watersheds are of
similar size, topographic slope, shape, and drainage density, they differ
principally with respect to current land cover, soil properties, and recent
land management history. Soil properties and infiltration capacities were
quantified on three 20 m x 20 m plots established within each
watershed.
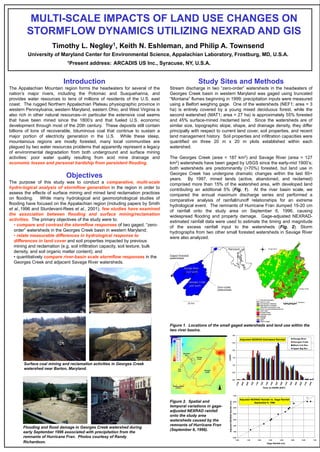
The Georges Creek (area = 187 km2) and Savage River (area = 127
km2) watersheds have been gaged by USGS since the early-mid 1900’s;
both watersheds are predominantly (>70%) forested, but land use in
Georges Creek has undergone dramatic changes within the last 60+
years. By 1997, mined lands (active, abandoned, and reclamed)
comprised more than 15% of the watershed area, with developed land
contributing an additional 5% (Fig. 1). At the river basin scale, we
compared the annual maximum discharge series and performed a
comparative analysis of rainfall/runoff relationships for an extreme
hydrological event. The remnants of Hurricane Fran dumped 15-20 cm
of rainfall onto the study area on September 6, 1996, causing
widespread flooding and property damage. Gage-adjusted NEXRAD-
estimated rainfall data were used to estimate the timing and magnitude
of the excess rainfall input to the watersheds (Fig. 2). Storm
hydrographs from two other small forested watersheds in Savage River
were also analyzed.
Figure 1. Locations of the small gaged watersheds and land use within the
two river basins.
Zero-order
watersheds
10 km
Georges Creek
(187 km2)
Savage River
(127 km2)
Maryland
Gaged forested
watersheds
Adjusted NEXRAD-Estimated Rainfall
0.0
0.5
1.0
1.5
2.0
2.5
3.0
0700
0800
0900
1000
1100
1200
1300
1400
1500
1600
1700
1800
1900
2000
2100
2200
Time on 9/6/96 (EST)
cm/hr
Savage River
Georges Creek
Black Lick Run
Upper Big Run
Adjusted NEXRAD Rainfall vs. Gage Rainfall
September 6, 1996
0.00
1.00
2.00
3.00
4.00
5.00
6.00
7.00
0.00 1.00 2.00 3.00 4.00 5.00 6.00 7.00
Gage Rainfall (cm)
AdjustedNEXRADRainfall(cm)
1:1
Figure 2. Spatial and
temporal variations in gage-
adjusted NEXRAD rainfall
onto the study area
watersheds caused by the
remnants of Hurricane Fran
(September 6, 1996).
2. Results: Zero-Order Watersheds
Annual hydrographs and water balances: Annual water balances for
the two watersheds are consistent with the interpretation that both
watersheds are accurately gaged. Annual runoff during the 2000 water
year (259 mm/year for MAT1 and 283 mm/year for NEF1) was virtually
identical to the annual runoff (264 mm) reported by USGS for the entire
Georges Creek basin.
Figure 3. Rainfall and runoff for MAT1 (left) and NEF1 (right) during the
period September 1999 through July 2001.
Comparison of peak runoff values: Peak runoff responses from the
five largest flood events were consistently higher at MAT1 than at NEF1
(Fig. 3). Total runoff and normalized storm yields were consistently
greater at MAT1 as well (Table 1). The results suggest that the peak
discharge response of surface-mined/reclamed lands can be as much as
1.5-10 times greater than that of forested lands in the basin.
Unit hydrographs: Two-hour unitgraphs were derived from data
collected during a summer 2000 rainstorm event. The shapes of the
resulting unitgraphs are virtually identical (i.e., comparable lags and peak
rates of direct runoff), suggesting that the two watersheds differ principally
with respect to the amount of precipitation "abstracted" during rainstorms
(Fig. 4).
Relationships between stormflow characteristics and soil
properties (Table 2): Steady-state infiltration capacities at NEF1
exceeded 5 mm/min, while the rates at MAT1 were less than 0.5 mm/min.
Surface soil organic matter may be the best predictor of both infiltration
capacity and the stormflow response of the watersheds. Deforestation,
surface mining, and reclamation appear to dramatically reduce the organic
matter present in the soil, especially at the surface where infiltration takes
place. The replacement of an organic rich forest floor with a tightly-
compacted mineral soil apparently reduces infiltration capacities and
increases both effective rainfall and direct runoff.
Table 2. Measured soil properties on the MAT1 and NEF1 watersheds.
Watershed Mass organic layer Organic matter content Bulk density Steady state infiltration
(g/m
2
) mineral soil (% by wgt.) (g/cm
3
) capacity (mm/min)
mean (s.e.) mean (s.e.) mean (s.e.)
MAT1 1127 (140) 7.40 (0.16) 1.22 (0.05) < 0.5 (n = 3)
NEF1 2504 (143) 11.69 (0.68) 0.98 (0.03) 5.0 (n = 2)
0
5
10
15
20
25
30
Oct-99 Dec-99 Mar-00 Jun-00 Sep-00 Dec-00 Mar-01 Jun-01 Sep-01
AverageDailyDischarge(mm/day)
0
10
20
30
40
50
60
70
80
90
100
Precipitation(mm/day)
Precipitation
Mat1
0
5
10
15
20
25
30
Oct-99 Dec-99 Mar-00 Jun-00 Sep-00 Dec-00 Mar-01 Jun-01 Sep-01
AverageDailyDischarge(mm/day)
0
10
20
30
40
50
60
70
80
90
100
Precipitation(mm/day)
Precipitation
Nef1
0.0
0.5
1.0
1.5
2.0
2.5
3.0
0 6 12 18 24 30 36 42 48
Time (hrs)
Discharge(mm/hr)
NEF1 (forested)
MAT1 (mined/reclaimed)
Fig. 4. Two-hour unitgraphs
computed for MAT1 and NEF1.
“Montana” flume (with instrument
shelter housing analog water level
recorder) on the MAT1 watershed.
Table 1. Mean Storm Responses at NEF1 and MAT1.+
-264
CENTROID
LAG, hr
0.8*
0.5
(0.0-1.6)
1.3
(0.0-3.6)
PEAK RUNOFF,
mm hr-1
4.7*
3.1
(0.0-5.1)
7.8
(0.0-20.3)
TOTAL
RUNOFF, mm
0.14*
0.09
(0.00-0.29)
0.23
(0.00-0.63)
RUNOFF COEF.
DIFFERENCENEF1MAT1
++ Fifteen most intense rain-storms (April – November, 2000-2002) for
which data from both sites were available
* Statistically significant difference based on one-tailed, paired t-test (p<
0.01)
Results: River Basins
Rainfall-runoff relationships and unit hydrographs--Hurricane
Fran: Despite similar storm and six-hour rainfall, storm runoff in Georges
Creek was low compared to Savage River and two other forested
watersheds. The six-hour unitgraph derived for Georges Creek has a
truncated peak, compared to Savage River and the other forested
watersheds. Data for the forested watersheds show flood attenuation in
watersheds smaller than a few hundred ha, but no attenuation above this
scale (Fig. 5)
0.0
0.5
1.0
1.5
2.0
2.5
3.0
0 6 12 18 24 30 36 42 48
Time (hrs)
Discharge(mm/hr)
Upper Big Run (162 ha)
Black Lick Run (558 ha)
Savage River (12710 ha)
NEF1 (3 ha)
effective rainfall pulse (1.0 cm)
0.0
0.5
1.0
1.5
2.0
0 6 12 18 24 30 36 42 48
Time (hrs)
Discharge(mm/hr)
Savage River
Georges Creek
effective rainfall pulse (1.0 cm)
0
5
10
15
20
25
30
35
40
Upper Big Run Black Lick Run Savage River Georges Creek
Six-hour Rainfall (cm) Total Storm Rainfall (cm)
Direct Runoff (cm) Storm Yield (%)
Figure 5. Rainfall-runoff relation-
ships and six-hour unitgraphs
derived for Georges Creek and
Savage River using data from
Hurricane Fran. Unitgraphs for
three other forested watersheds
are shown for comparison.
• Ancillary analyses: Several ancillary analyses--including a water
balance for the entire NB Potomac River basin (Fig. 6)--suggest that the
Georges Creek flood hydrograph used in this study was in fact truncated
during a six-hour period when the creek overflowed its banks during the
100-year flood event. Adjusting the discharge during this six-hour period
in order to provide enough water downstream requires a near-doubling in
peak discharge (Fig. 7). Using the adjusted direct runoff hydrograph
increases the Georges Creek storm runoff by more than 1 cm and makes
the results more in line with the results obtained for the other watersheds
(Fig. 8).
0
20000
40000
60000
80000
09/01/96
09/02/96
09/03/96
09/04/96
09/05/96
09/06/96
09/07/96
09/08/96
09/09/96
09/10/96
09/11/96
09/12/96
cfs
Measured
Computed from upstream measurements
Computed from upstream measurements*
Figure 6. Measured and computed
cumulative discharge in the NB
Potomac River basin during the
period 9/1 - 9/12/96. Magenta line
uses the estimated Georges Creek
discharge shown in Fig. 7.
0
2000
4000
6000
8000
10000
12000
14000
0 12 24 36 48
Hours after 1000 on 9/06/1996
Hourlydischarge(cfs)
Savage River (total DR = 5.84 cm)
Georges Creek (total DR = 4.21 cm)
Georges Creek* (total DR = 5.38 cm)
Figure 7. Measured (red) and
adjusted (magenta) direct runoff
hydrograph for Georges Creek
during Hurricane Fran.
0
5
10
15
20
25
30
35
40
Upper Big Run Black Lick Run Savage River Georges Creek
Six-hour Rainfall (cm) Total Storm Rainfall (cm)
Direct Runoff (cm) Storm Yield (%)
Figure 8. Measured and adjusted values for total storm
runoff and yield for the four watersheds during Hurricane
Fran. The magenta boxes show the increases due to
adjustment.
Mechanisms of stormflow generation: The primary mechanism of
stormflow generation at MAT1 is infiltration-excess overland flow; this
mechanism may be supplemented with runoff from small wet surface
depressions that formed by local subsidence following reclamation. At
NEF1, infiltration capacities are too high to produce infiltration-excess
overland flow, but the steeply sloped watershed generates stormflow via
a rapid shallow subsurface mechanism.
3. Conclusions
Surface mining and conventional reclamation of previously forested lands
on the Appalachian Plateau appear to dramatically affect the runoff
response of small “zero-order” watersheds to precipitation, potentially
contributing to the magnitude of downstream flooding of steep, V-shaped
valleys that are characteristic of this region. Peak runoff rates can
apparently increase by as much as a factor of ten owing to
reductions in soil infiltration capacity associated with mining and
reclamation activities. We speculate that (1) compaction and loss of
surface soil and (2) reductions in soil litter and organic matter
content are the primary mechanisms by which soil infiltration is
reduced.
From our river basin study, we were able to conclude that:
• Adjusted NEXRAD-estimated rainfall data are critical in any effort to
understand rainfall-runoff relationships at the landscape scale.
• Attenuation of flood waves in unregulated, steep mountain river
basins occurs mostly in small catchments (< 500 ha), but is negligible
above this scale.
• Key data inconsistencies limited our ability to directly demonstrate
an effect of land use/land cover changes on stormflow responses at the
river basin scale.
• Resolution of these inconsistencies requires a more peaked, less
attenuated unitgraph for Georges Creek, consistent with an
interpretation that urbanization and/or surface mining/reclamation
practices have probably exacerbated flooding in this river basin.
Acknowledgements
The authors thank landowners Paul Willison and the late Simon Moore for
granting permission to conduct these hydrological studies on their private
lands in the Georges Creek basin. Jim Kahl of Maryland MDE was
instrumental in helping us gain access and obtain permits to work in these
watersheds. We gratefully acknowledge Andrew W. Mellon Foundation for
generously supporting this research project through two grants to UMCES
Appalachian Laboratory. Maryland DNR provided research support that
allowed us to instrument and gage Black Lick Run and Big Run
watersheds continuously in Savage River State Forest since 1995. We
thank Brian Hoblit (NEXRAIN Corp.) for providing gage-adjusted NEXRAD
data for the study and assisted in validation of estimated radar-rainfall
totals. We also thank Chuck Strain (USGS) for making hourly discharge
data for the river basins readily available to us.
References
Smith, J.A., M.L. Baeck, M. Steiner, and A.J. Miller. 1996. Catastrophic
rainfall from an upslope thunderstorm in the Central Appalachians: the
Rapidan Storm of June 27, 1995. Water Resour. Res. 32(10):3099-3113.
Sturdevant-Rees, P., J.A. Smith, J. Morrison, and M.L. Baeck. 2001.
Tropical storms and the flood hydrology of the central Appalachians.
Water Resour. Res. 37(8):2143-2168.
Figure 9. Derived six-hour unitgraph for Georges Creek
(Savage River unitgraph shown for comparison).
• Derived Georges Creek unitgraph: Using the adjusted direct runoff
hydrograph shown in Figure 7, a six-hour unitgraph was derived for
Georges Creek (Fig. 9). The derived Georges Creek hydrograph is
substantially more peaked, with a peak discharge value that is nearly
50% greater than the value for Savage River. The less-attenuated
unitgraph is consistent with our working hypothesis that land use/land
cover changes due to surface mining and reclamation may be
exacerbating flooding in this basin.