Visual Verifications through Liveness Analysis using Mobile Devices
RCA_13
1. |ai| is the measured acceleration for sensori, |H| is the
linear acceleration of the head’s center of mass due to
impact, αH and θH, are the spherical angles of the
impact’s location on the helmet:
Department of Electrical and Computer Engineering
ECE 415/ECE 416
SENIOR DESIGN PROJECT 2013
College of Engineering - University of Massachusetts Amherst
Helmet
RCA: Real-Time Concussion Analyzer
Timothy Coyle, Justin Kober, Scott Rosa, Kenneth Van Tassell
Faculty Advisor: Prof. Christopher Hollot
Abstract
We introduce RCA (Real-Time Concussion Analyzer), a real-
time system that will allow a football coach to remotely
monitor the impacts a player experiences during a game.
This system will provide the likelihood that a player has
experienced a concussion, allowing coaches to make more
informed decisions pertaining to player safety. RCA
incorporates an array of accelerometers inside each
player’s helmet. The sensor data from each helmet is
wirelessly transmitted to an Android device, where an
application will query a player database on a server, and
determine the likelihood of concussion.
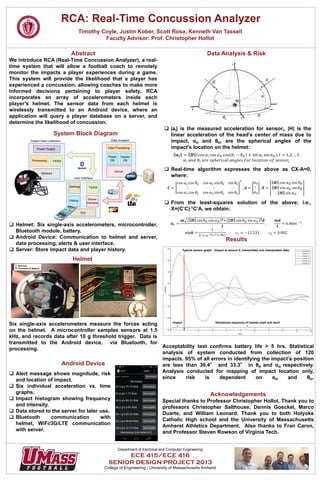
System Block Diagram
Helmet: Six single-axis accelerometers, microcontroller,
Bluetooth module, battery.
Android Device: Communication to helmet and server,
data processing, alerts & user interface.
Server: Store impact data and player history.
Sensors
Processor & Battery
Acknowledgements
Special thanks to Professor Christopher Hollot. Thank you to
professors Christopher Salthouse, Dennis Goeckel, Marco
Duarte, and William Leonard. Thank you to both Holyoke
Catholic High school and the University of Massachusetts
Amherst Athletics Department. Also thanks to Fran Caron,
and Professor Steven Rowson of Virginia Tech.
Data Analysis & Risk
Real-time algorithm expresses the above as CX-A=0,
where:
From the least-squares solution of the above; i.e.,
X=(C’C)-1C’A, we obtain:
Results
Typical sensor graph. Impact at sensor 0, transmitted and interpolated data.
Impact
Acceptability test confirms battery life > 5 hrs. Statistical
analysis of system conducted from collection of 120
impacts. 95% of all errors in identifying the impact’s position
are less than 30.4° and 33.3° in θH and αH respectively.
Analysis conducted for mapping of impact location only,
since risk is dependent on αH and θH.
Six single-axis accelerometers measure the forces acting
on the helmet. A microcontroller samples sensors at 1.5
kHz, and records data after 10 g threshold trigger. Data is
transmitted to the Android device, via Bluetooth, for
processing.
Alert message shows magnitude, risk
and location of impact.
Six individual acceleration vs. time
graphs.
Impact histogram showing frequency
and intensity.
Data stored to the server for later use.
Bluetooth communication with
helmet, WiFi/3G/LTE communication
with server.
Android Device
Vibrational response of helmet shell and skull
Data Processing
Server
Player
DB
Impact
DB
GUI
TX/RXSettings
History Server
Interface
Impact Data Collection Data Analysis
User Interface
Power Supply
Sensors
Processing TX/RX
2. RCA samples at 1.5 kHz, almost double the
Nyquist rate of the accelerometer’s bandwidth.
Accuracy verified with function generator.
Quantization error of 0.7 g.
Cost
System Specifications Microcontroller Testing
Risk
Impact Location
Mapping
Specification Goal Actual
Weight < 5% increase (102 g) 6.2% (120 g)
Range 25 m 30 m
Response Time < 2 s < 5 s
Battery Life > 5 hr. > 5 hr.
Cost < $5000 per team $5040
Power Consumption < 2 W 1.39 W
Acceleration Range +/- 70 g +/- 84 g
Sensitivity Detect only collisions Triggers at 10 g
Durable Packaging Stable & Waterproof Stable & Water Resistant
Part Development Production (1000)
6x ADXL193 (Accelerometers) Free Sample $6.21
ATMEGA32U4 (Processor) Free Sample $6.04
BlueSMiRF (Bluetooth) $64.95 $51.96
PCB $33 $5.50
Capacitors $4.40 $1.46
Resistors $0.20 $0.02
16 MHz Clock $0.91 $0.53
Battery $19.95 $15.96
Total $123.41 $87.68
Risk equation derived by Rowson et al. 2012.
RCA uses shifted version for a scaled prototype.
Sensor Θi (deg) αi (deg) Sensitivity (mV/g)
0 0 20 27.6
1 -90 15 27.5
2 180 20 27.6
3 90 15 27.6
4 75 50 27.8
5 -69 50 27.6
Sensor Placement
Impact locations for
measurements
Sensor 0
(θ=0,
α=20)
Sensor 1
(θ=-90,
α=15)
Sensor 2
(θ=180,
α=20)
Sensor 3
(θ=90,
α=15)
Sensor 4
(θ=75,
α=50)
Sensor 5
(θ=-69,
α=50)
Ave H (g) 37.16 44.04 59.30 30.92 41.99 43.95
H StDev 1.52 9.35 1.56 5.96 8.66 4.97
Ave θ (deg) 0.50 -103.84 179.84 107.49 104.48 -94.73
θ StDev 0.29 4.56 0.15 2.28 1.33 4.57
Ave α (deg) 8.40 41.31 30.47 39.74 57.66 53.41
α StDev 1.78 5.92 0.36 10.25 2.31 4.73
Ave θ Difference (deg) 0.5 13.8 0.2 17.5 29.5 25.7
Ave α Difference (deg) 11.6 26.3 10.8 24.7 7.7 3.4
160 impacts, with small standard deviation, show
consistency in experiments.
10 impacts along each sensor’s axis, normal to the
surface of the skull.
Errors in sensor placement, estimated at +/- 5, and
variance of impact location during testing.
Experiments proved vital to testing location
mapping algorithm.
Individual sensitivity found experimentally.
Sensor locations modeled around Virginia Tech
research.
Android application interprets
incoming Bluetooth data.
A detected impact prompts a
dialog to alert the user with risk
of injury and location of impact.
The Player Details activity
returns information for each
player and shows cumulative
risk.
Histogram activity displays risk
over time sorting them by risk
percentage.
Settings allow user to pick
between coach and trainer
views and the histogram’s time
frame to graph.
MySQL database controlled by PHP scripts.
Database stores raw accelerometer data, resultant
hit vectors and player information.
Data accessible, via internet, for all who need data.
Application
Server