Download to read offline

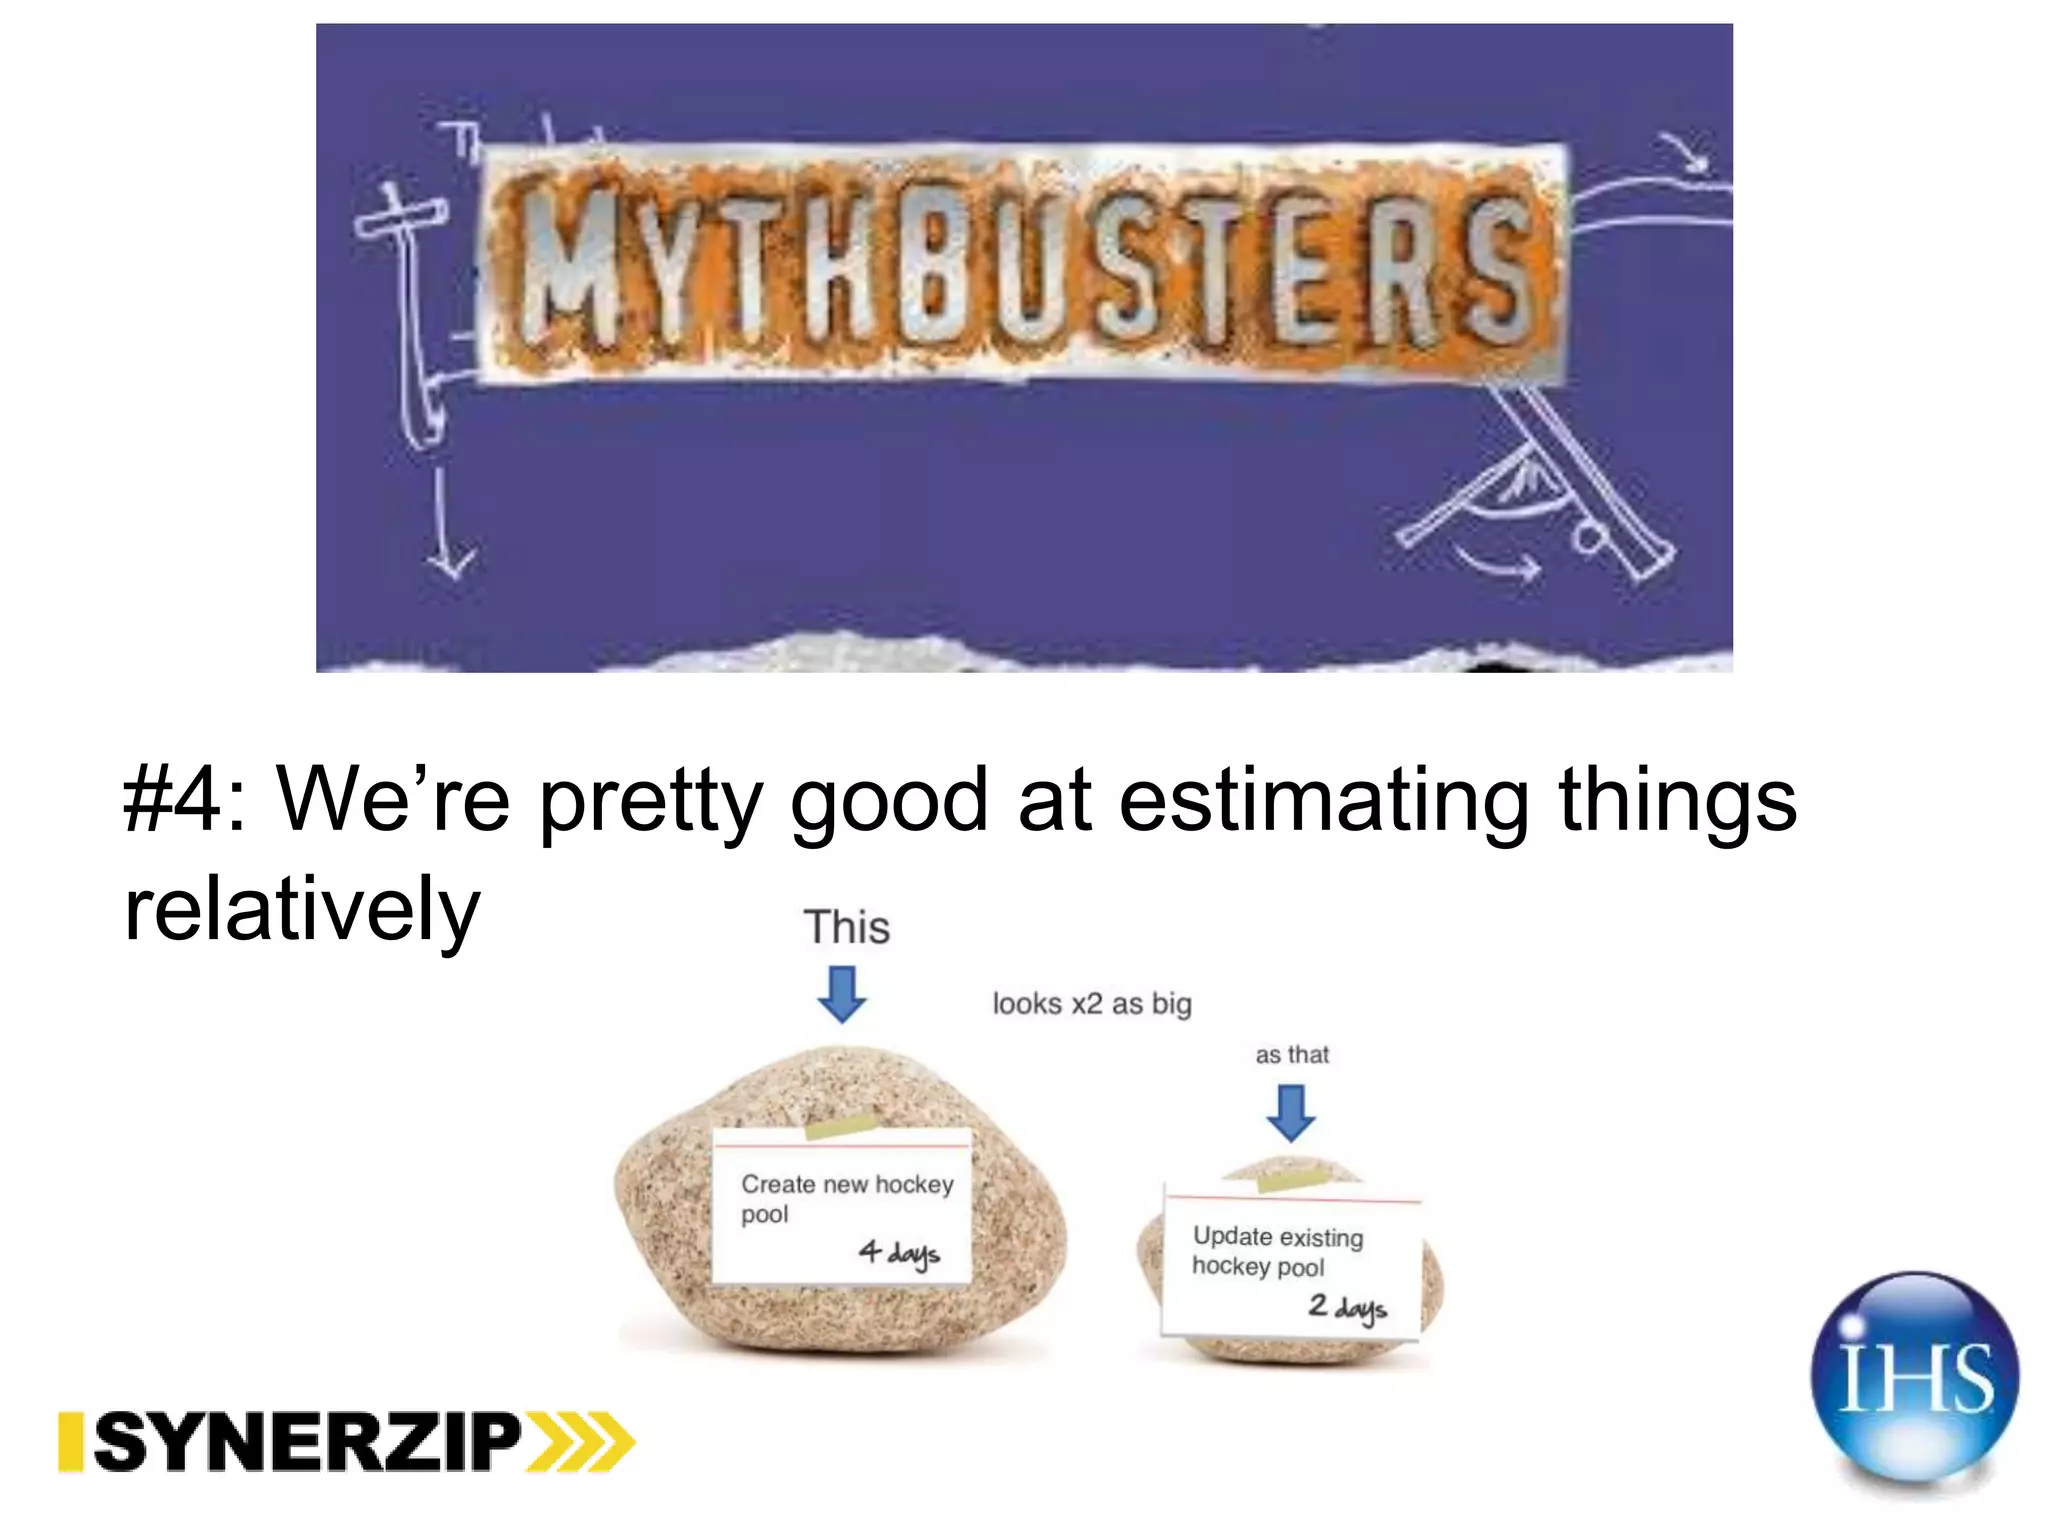


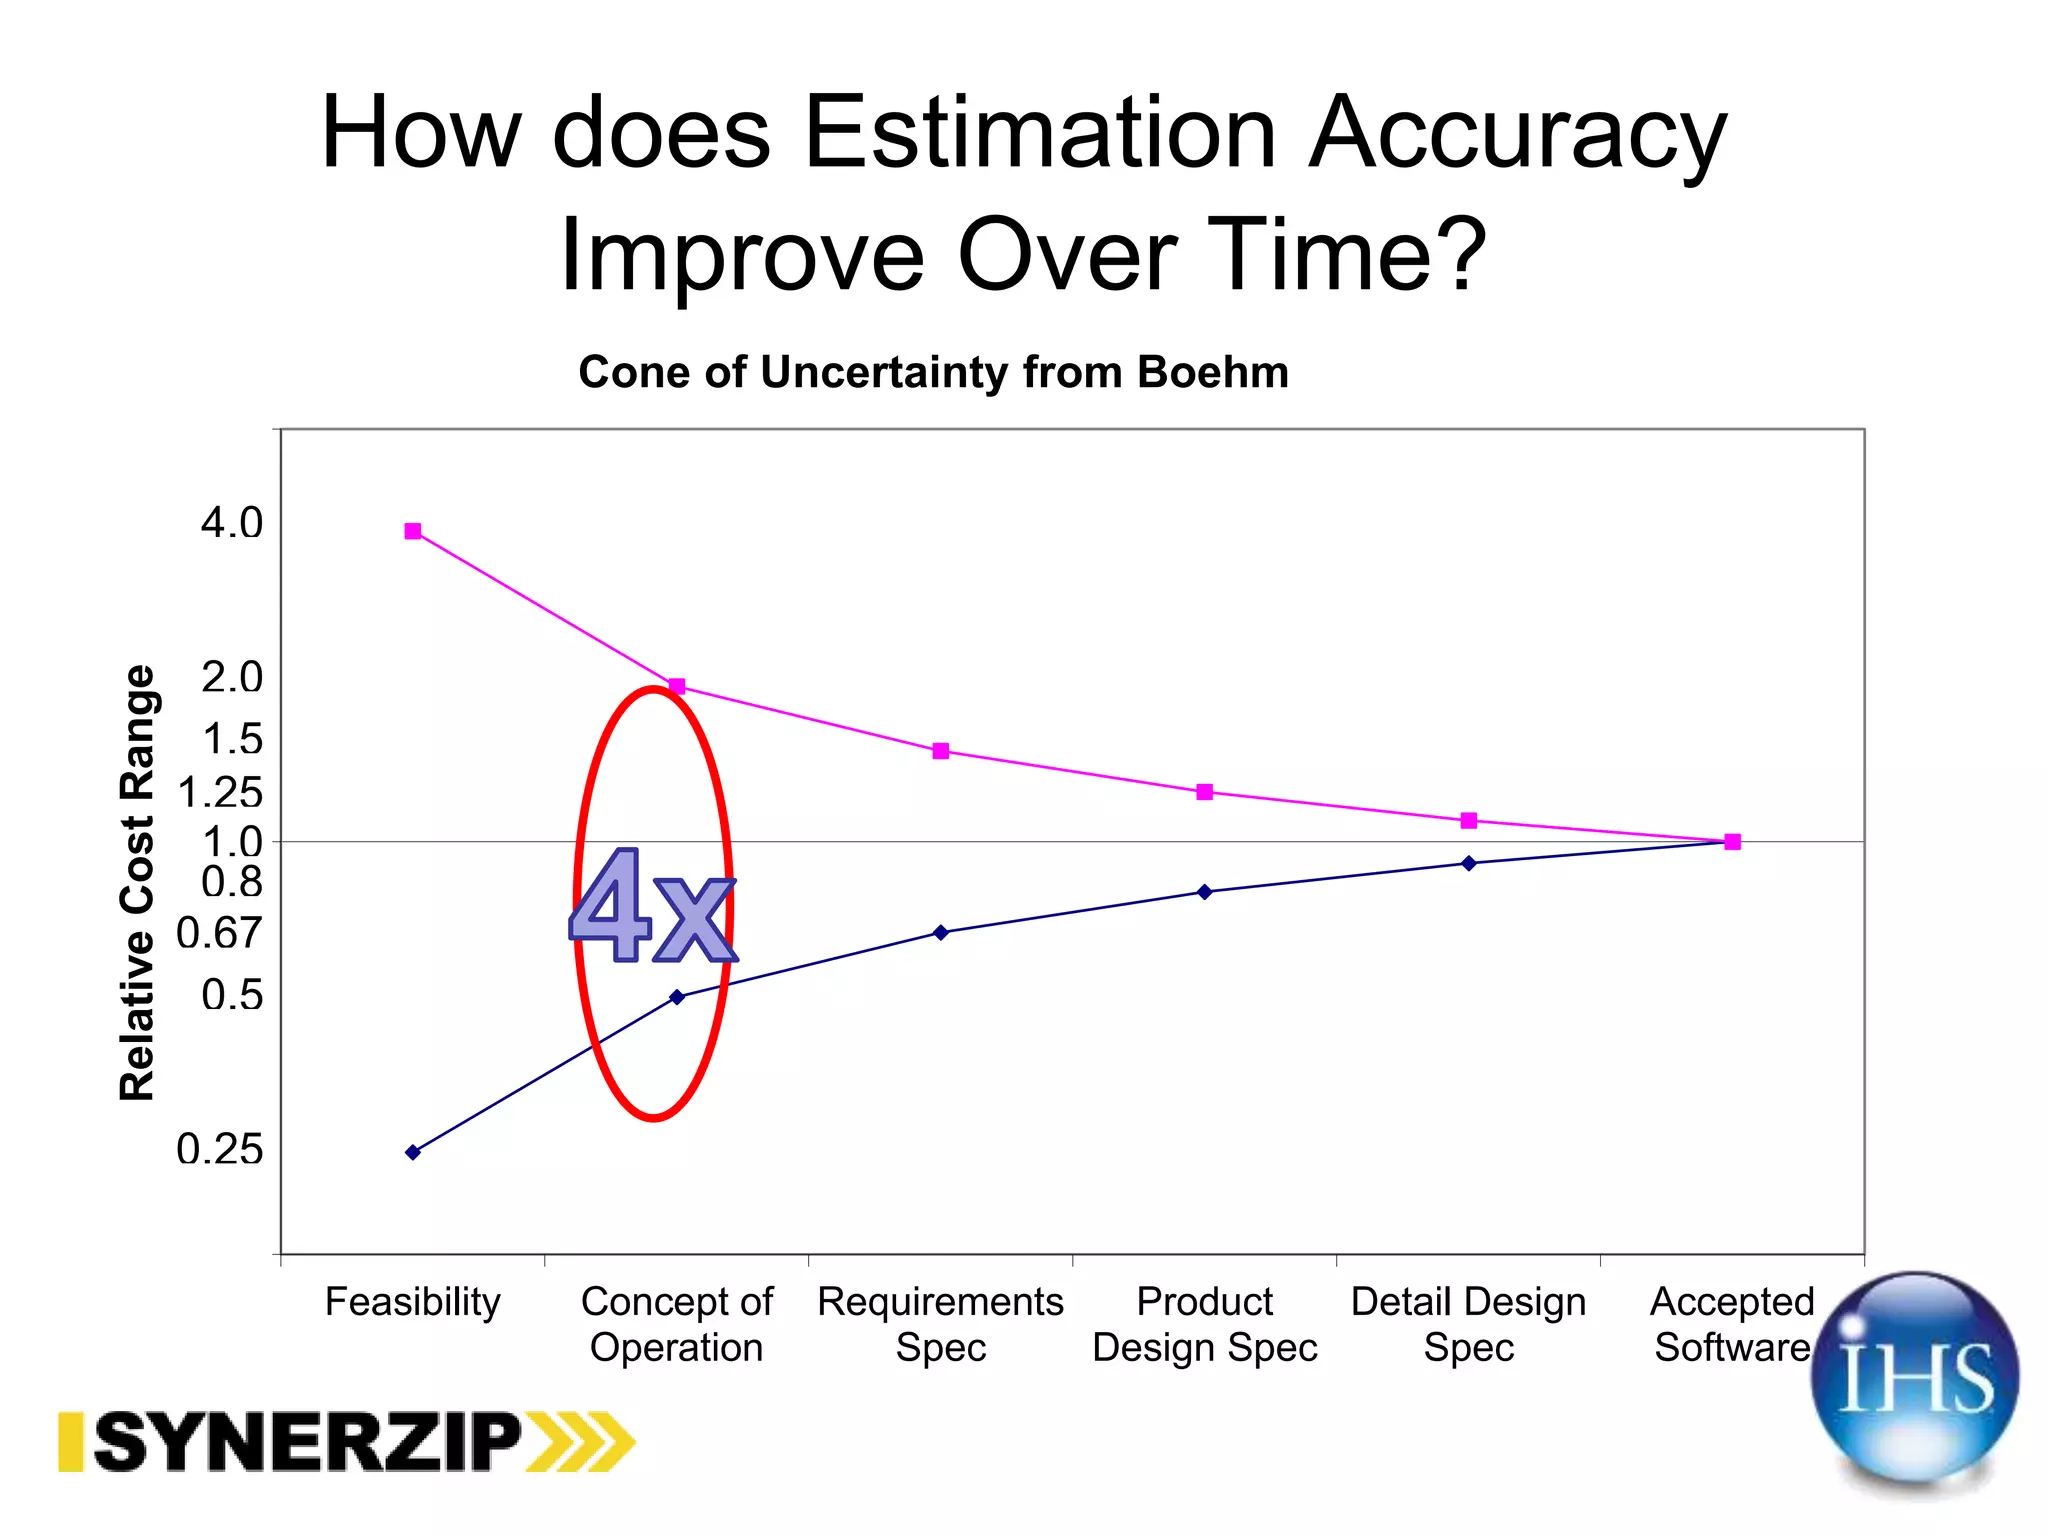
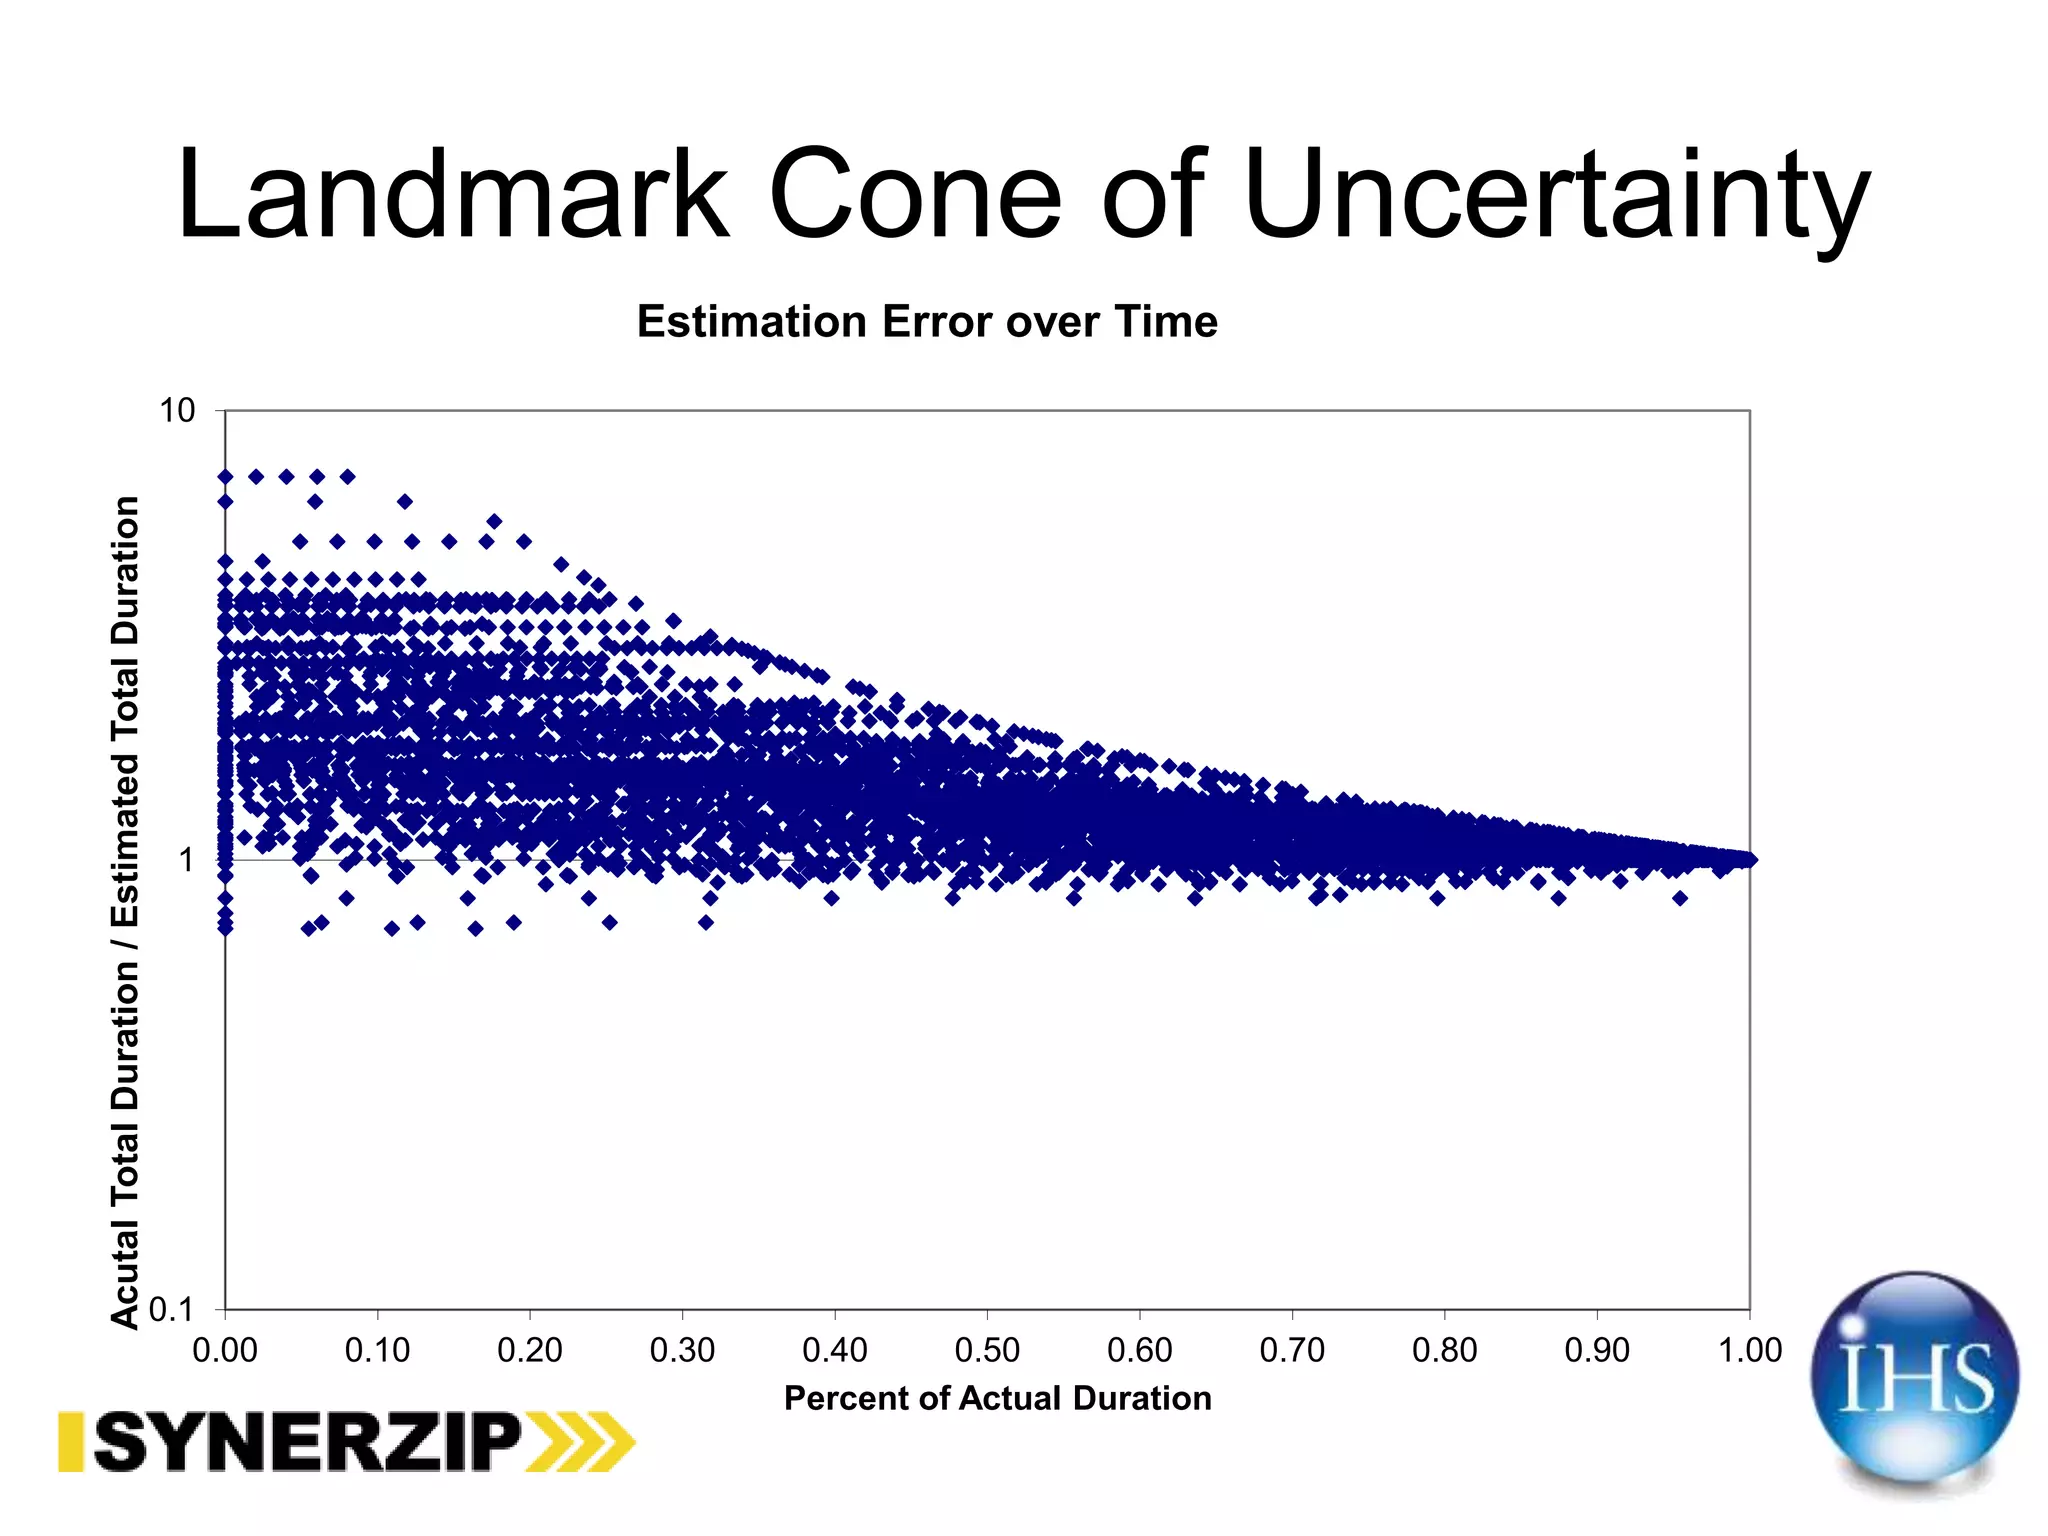


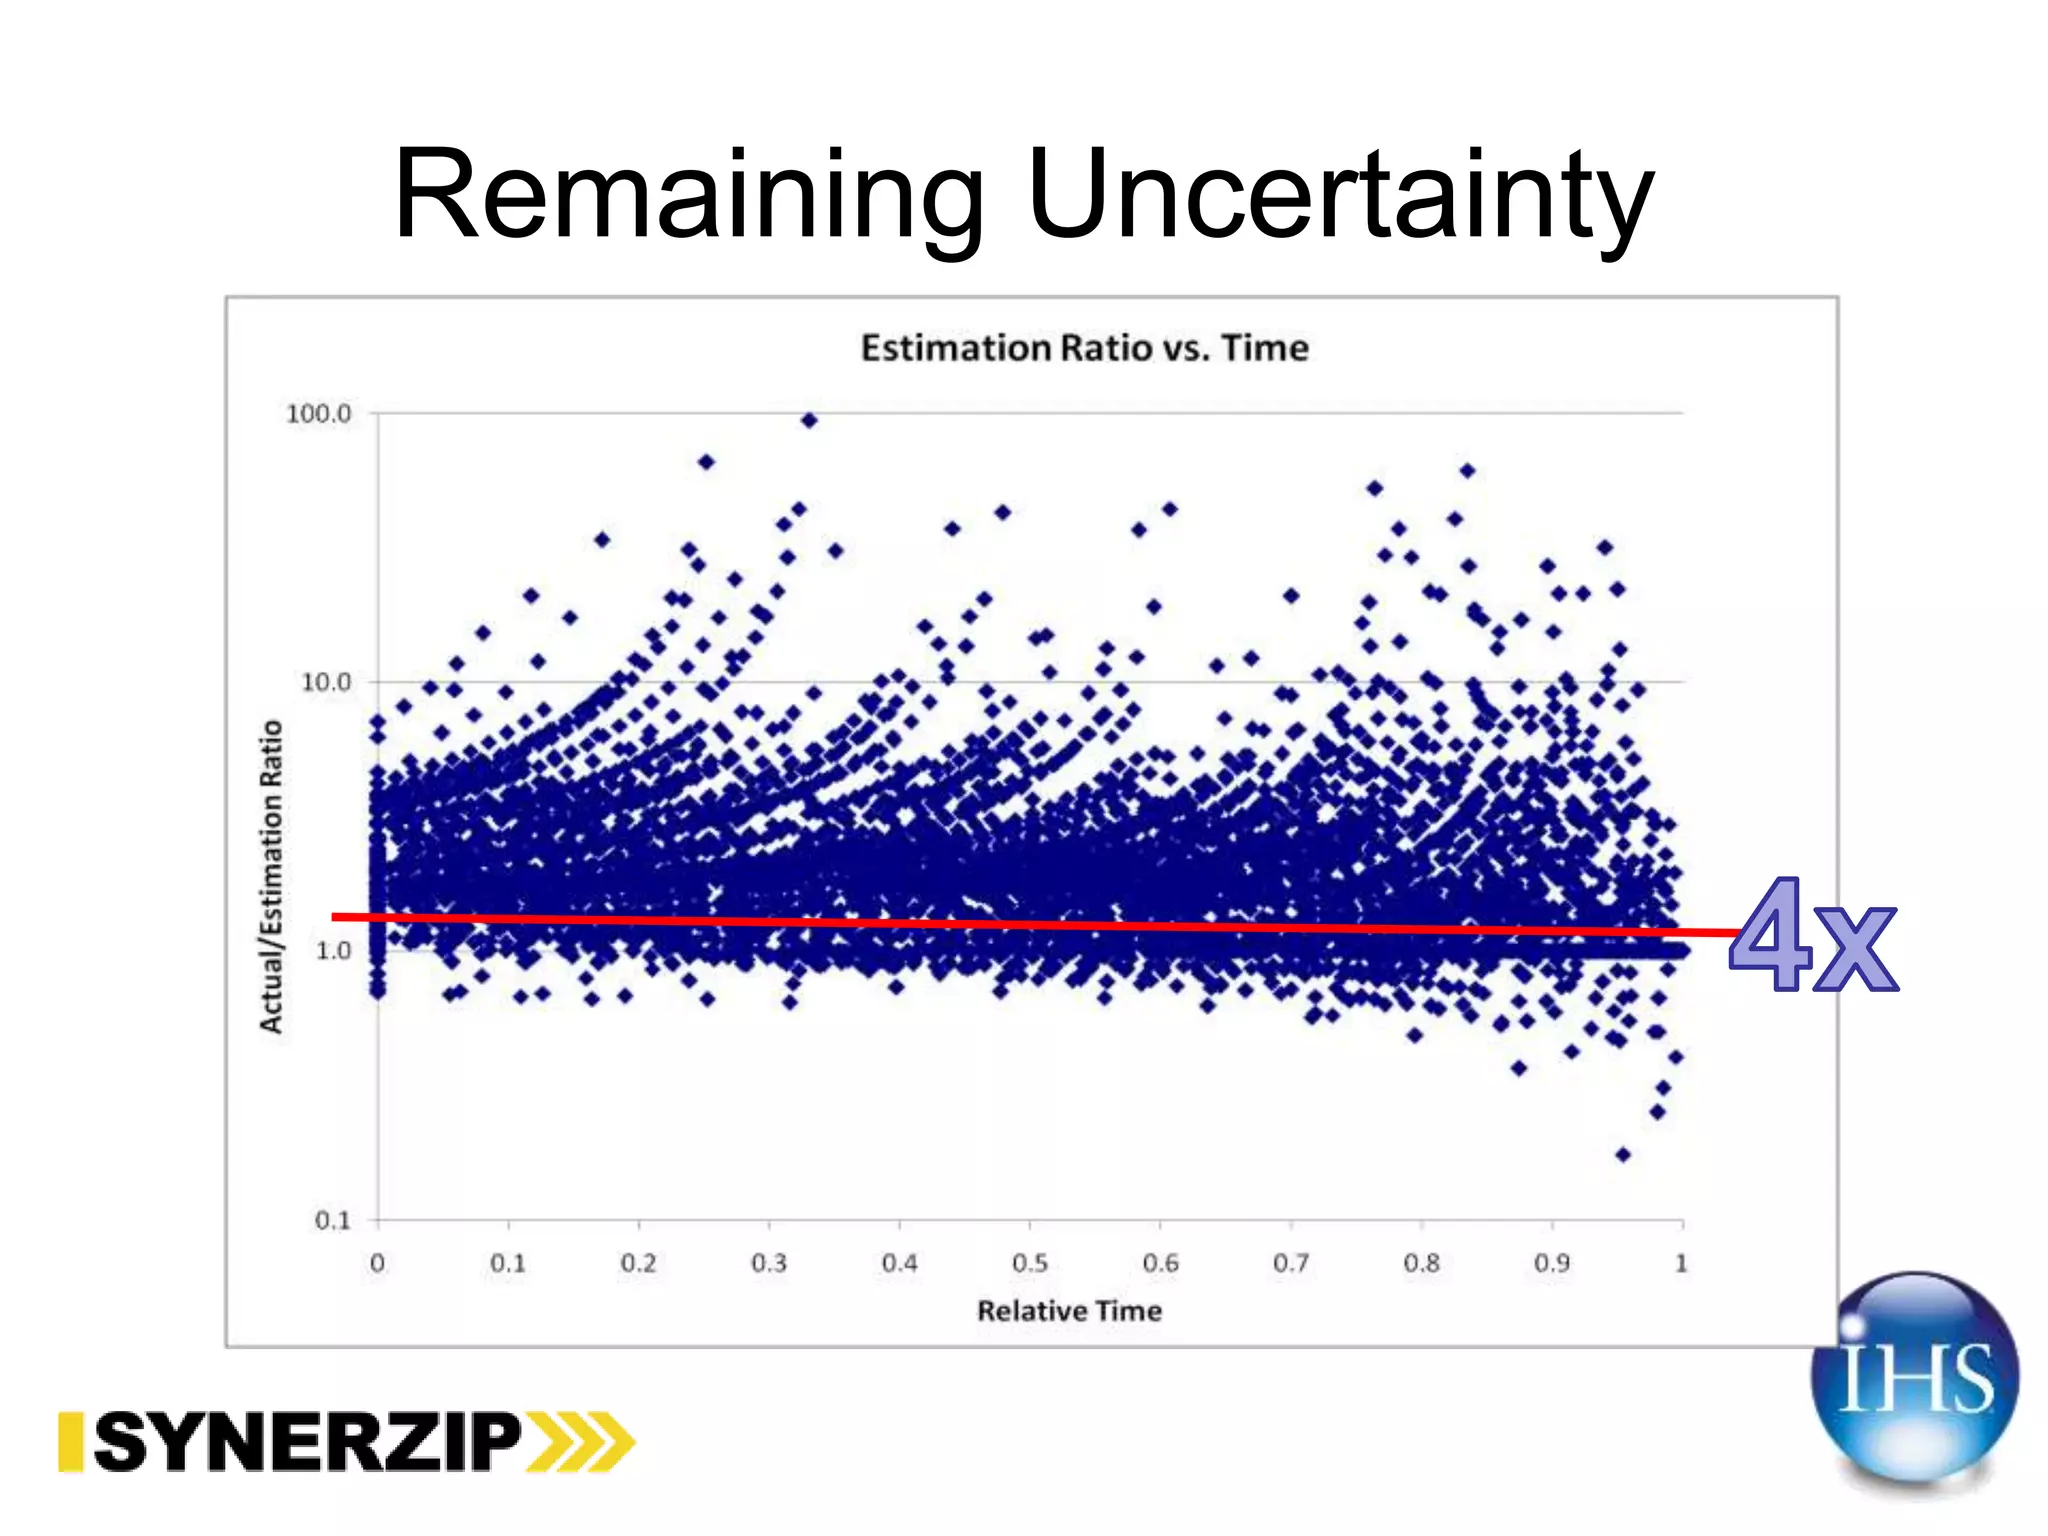

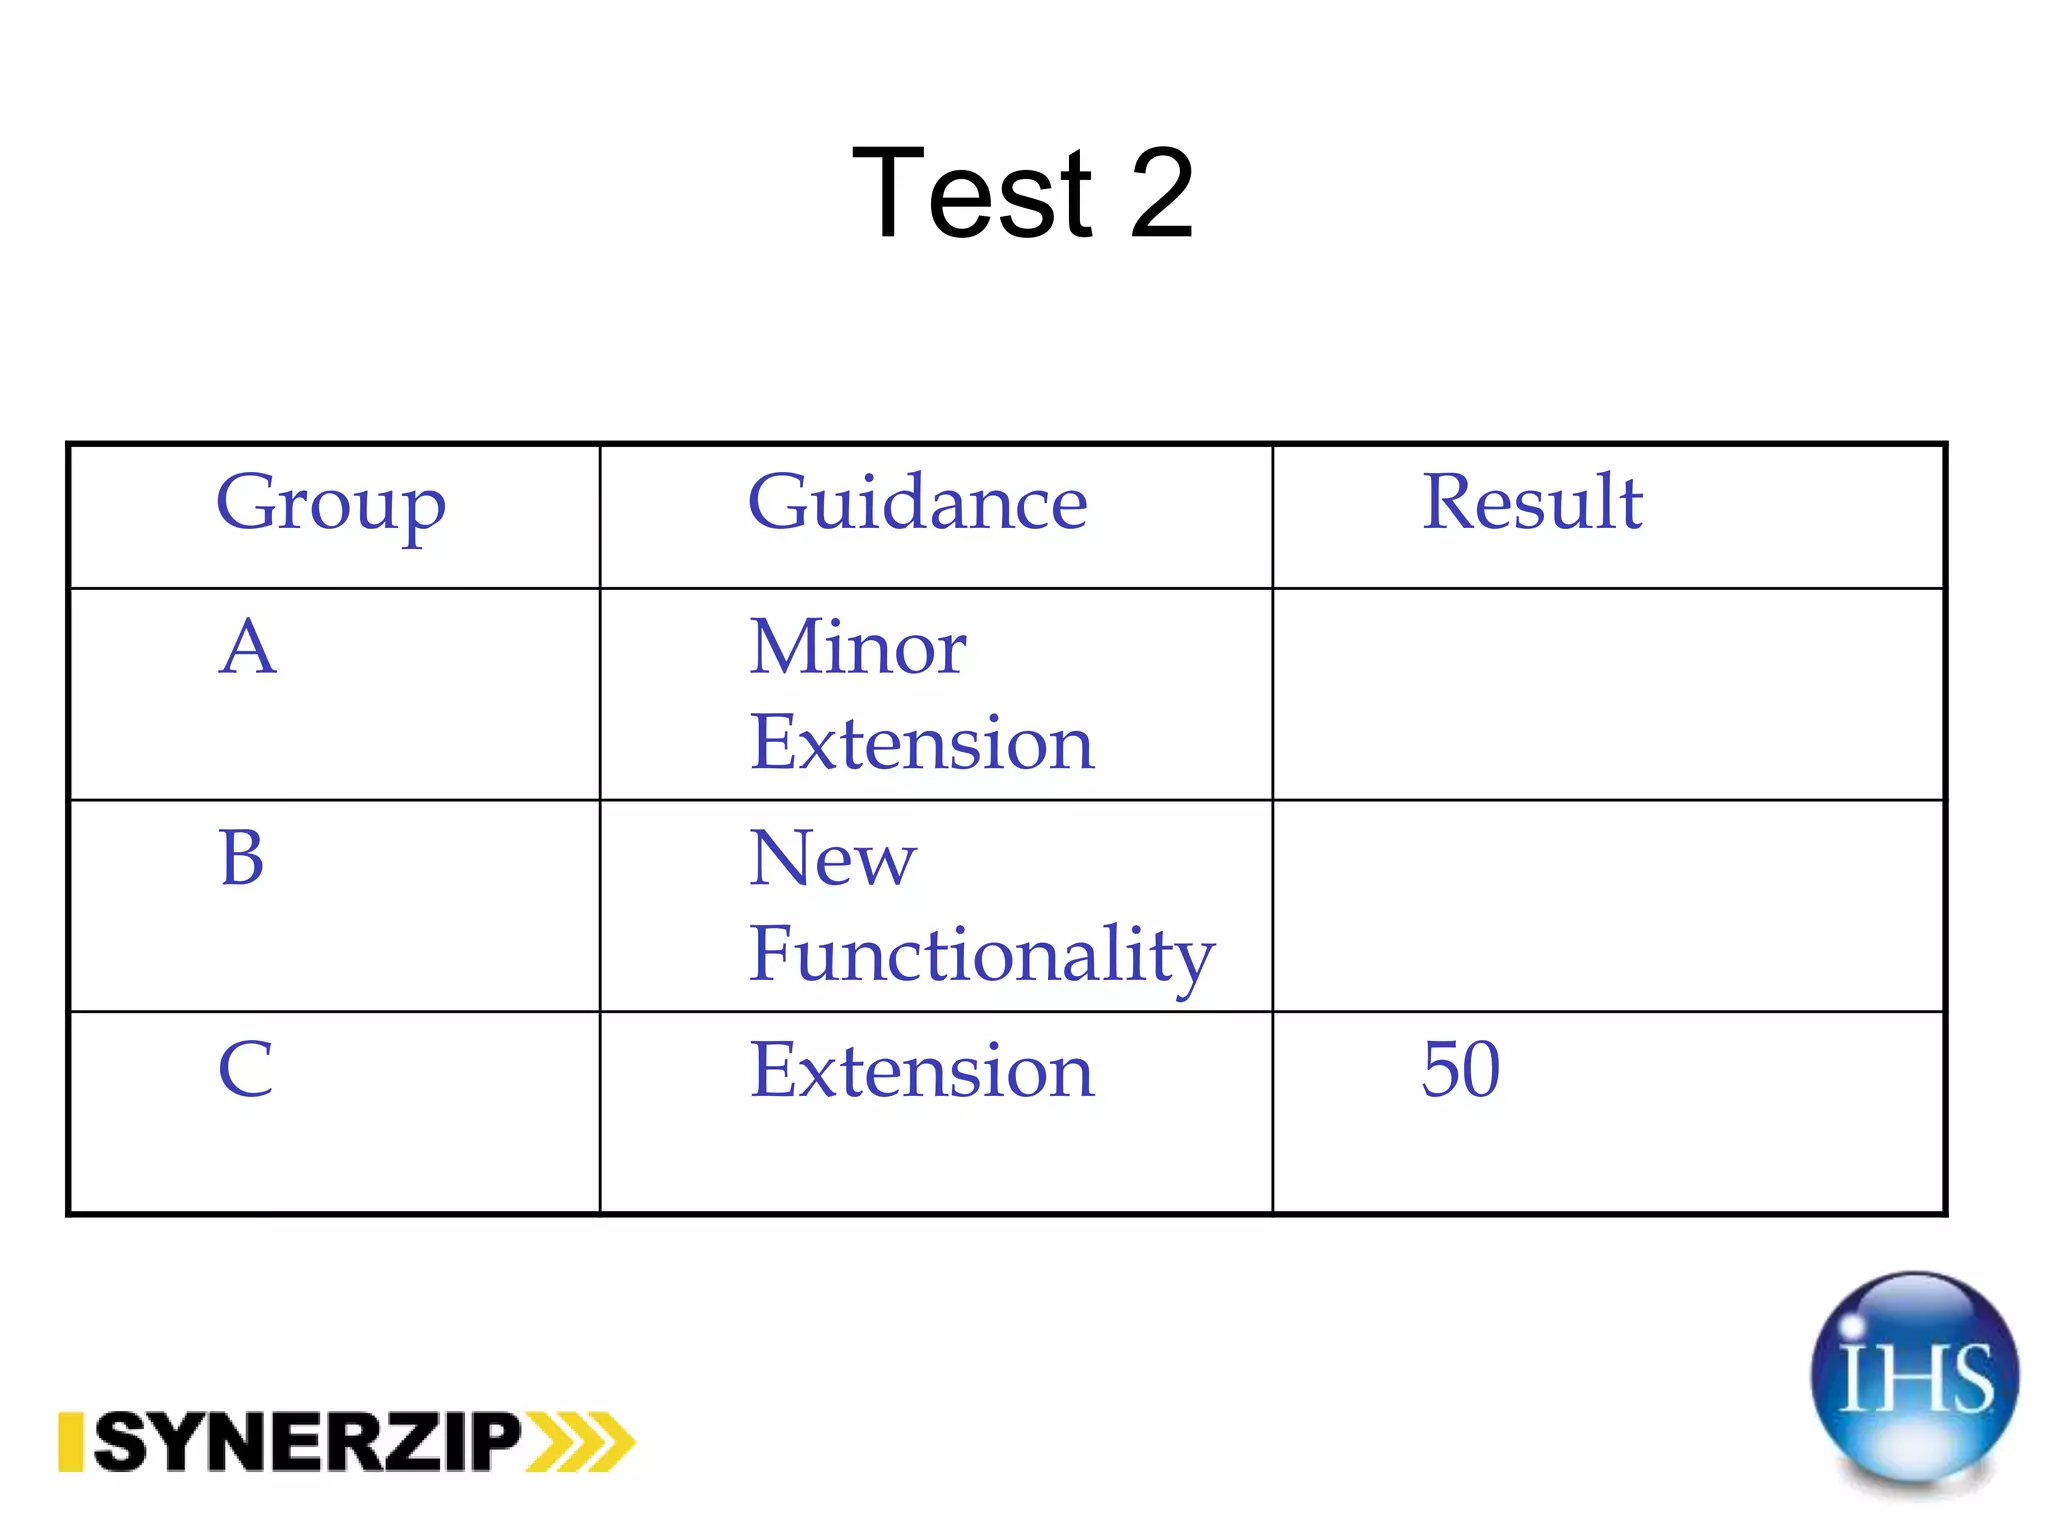

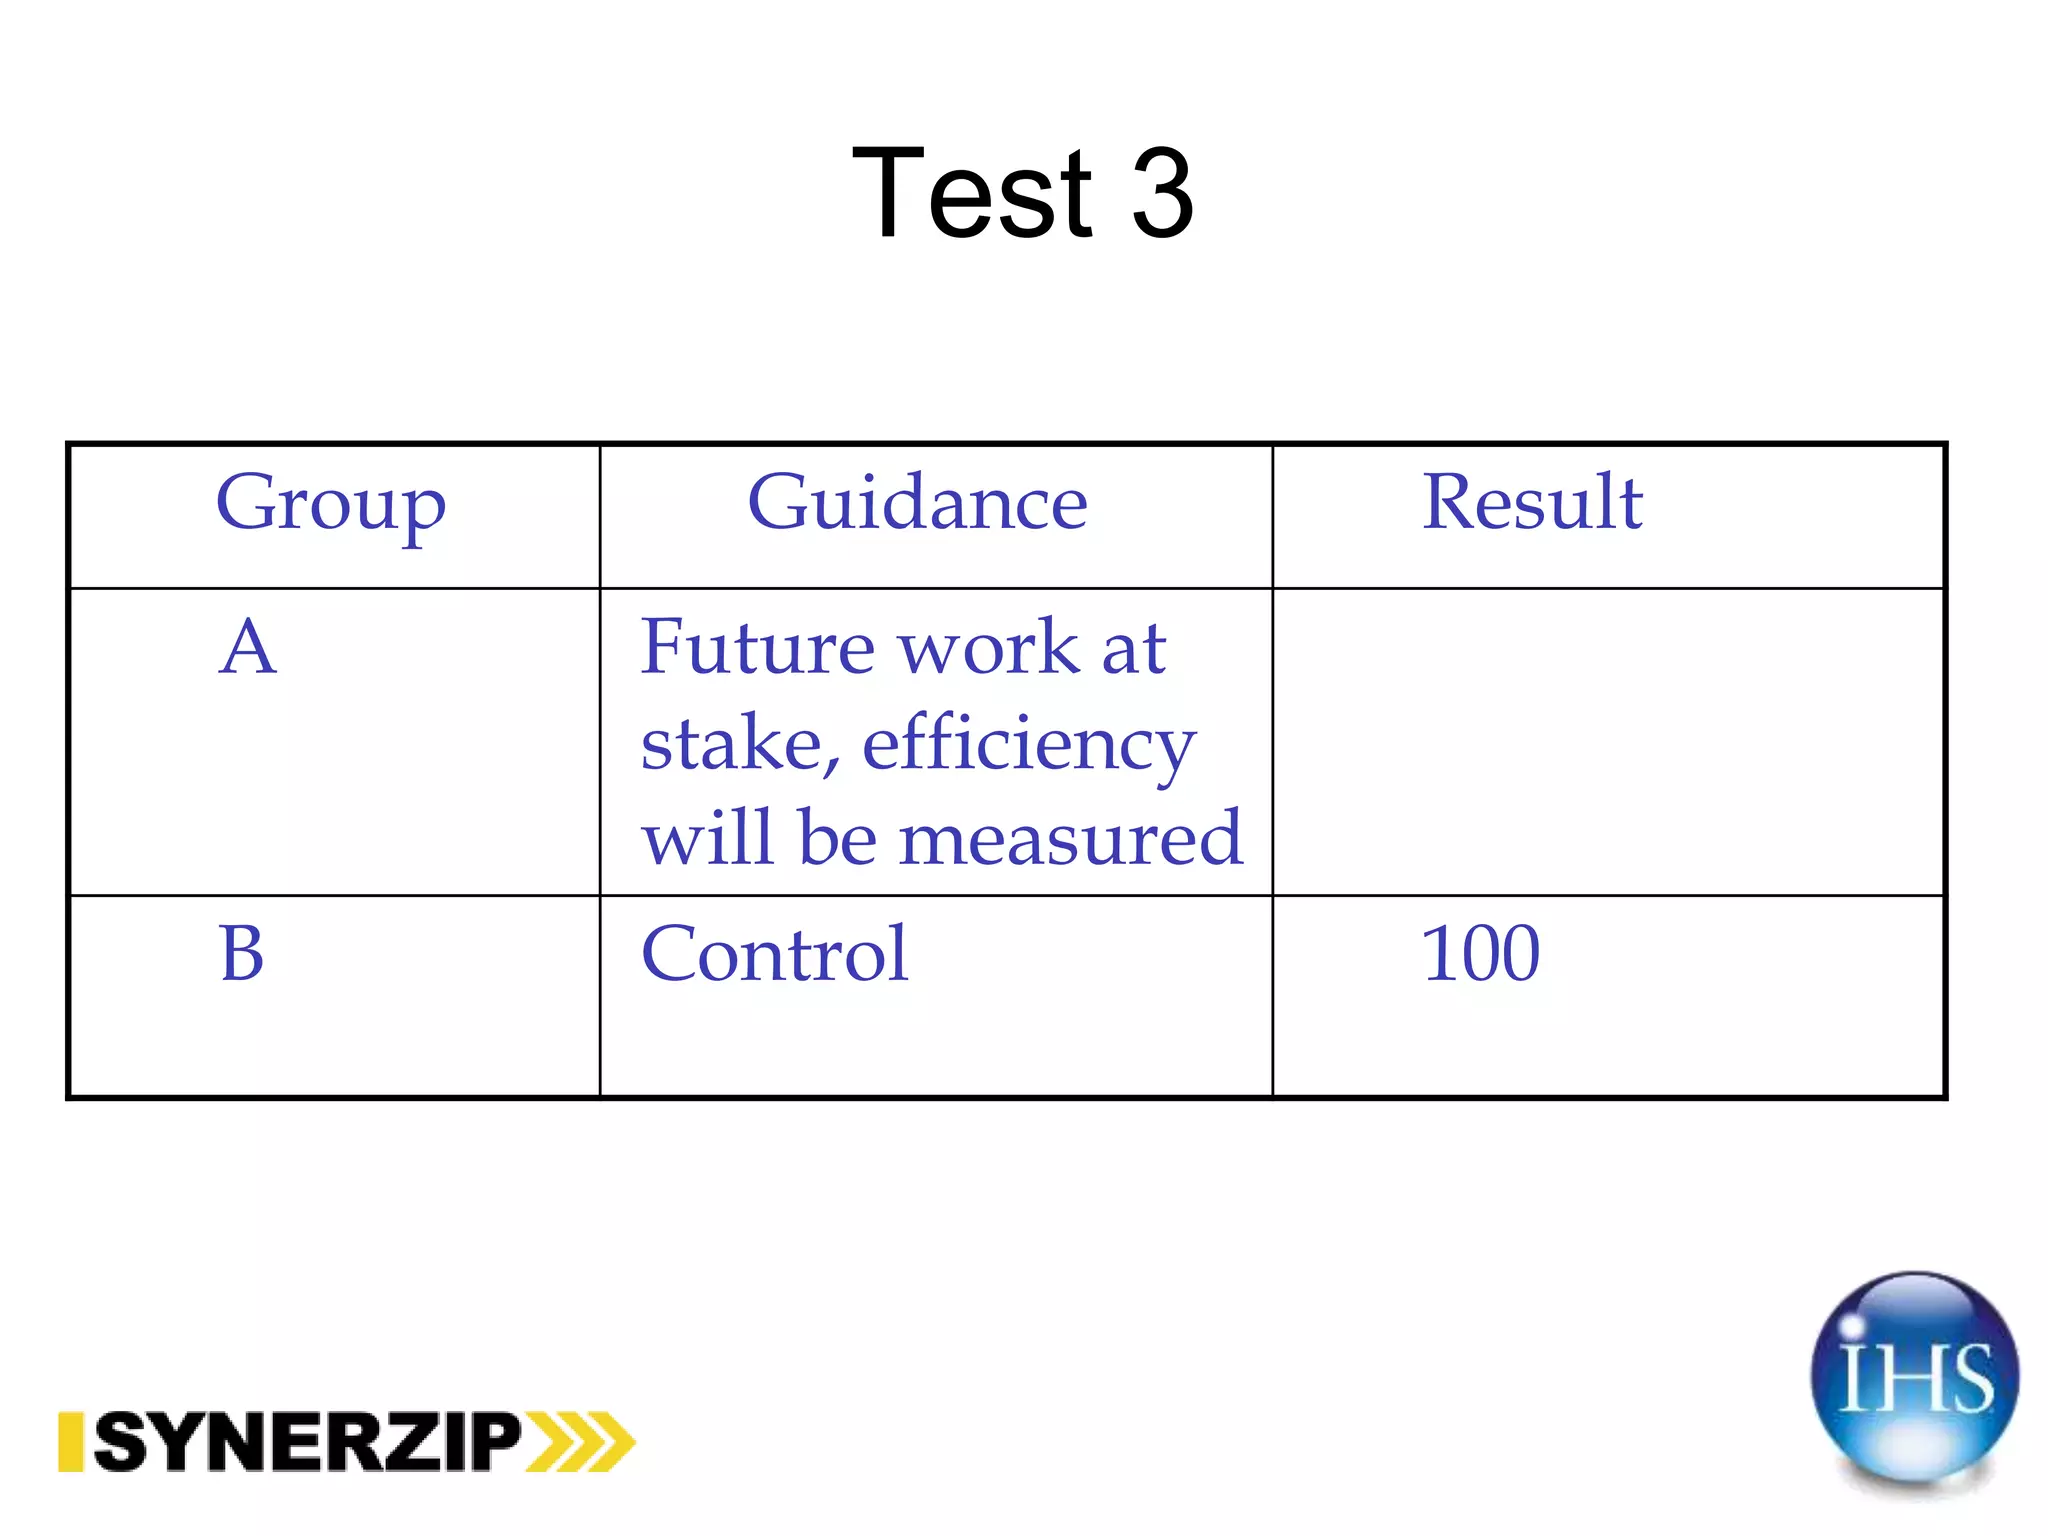
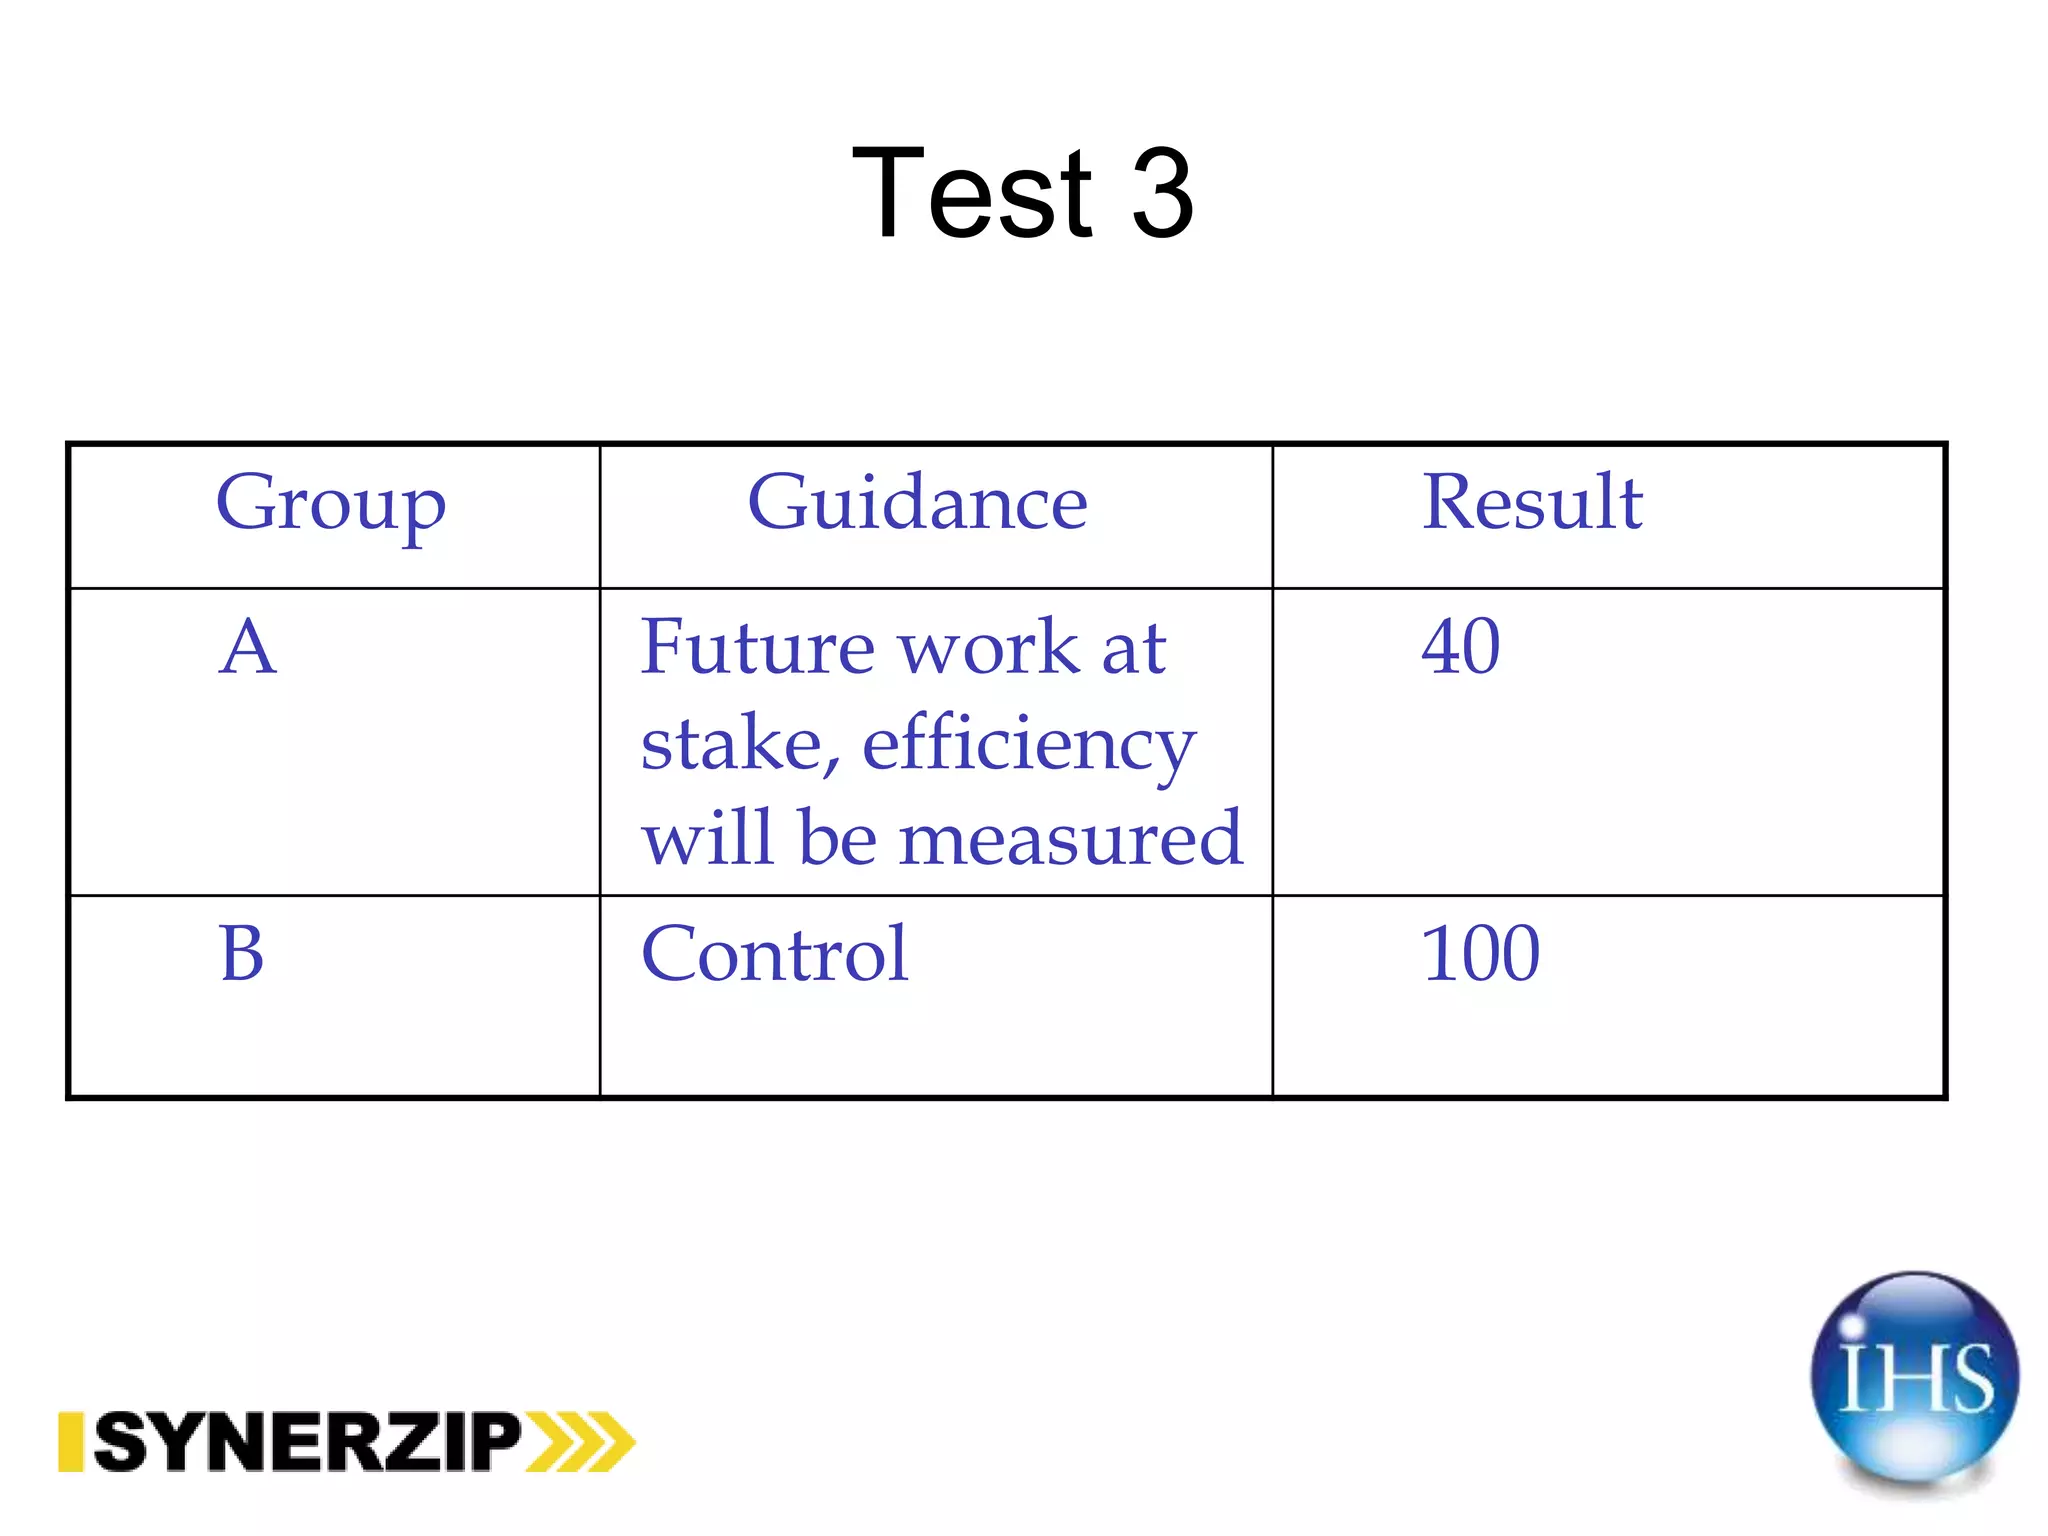


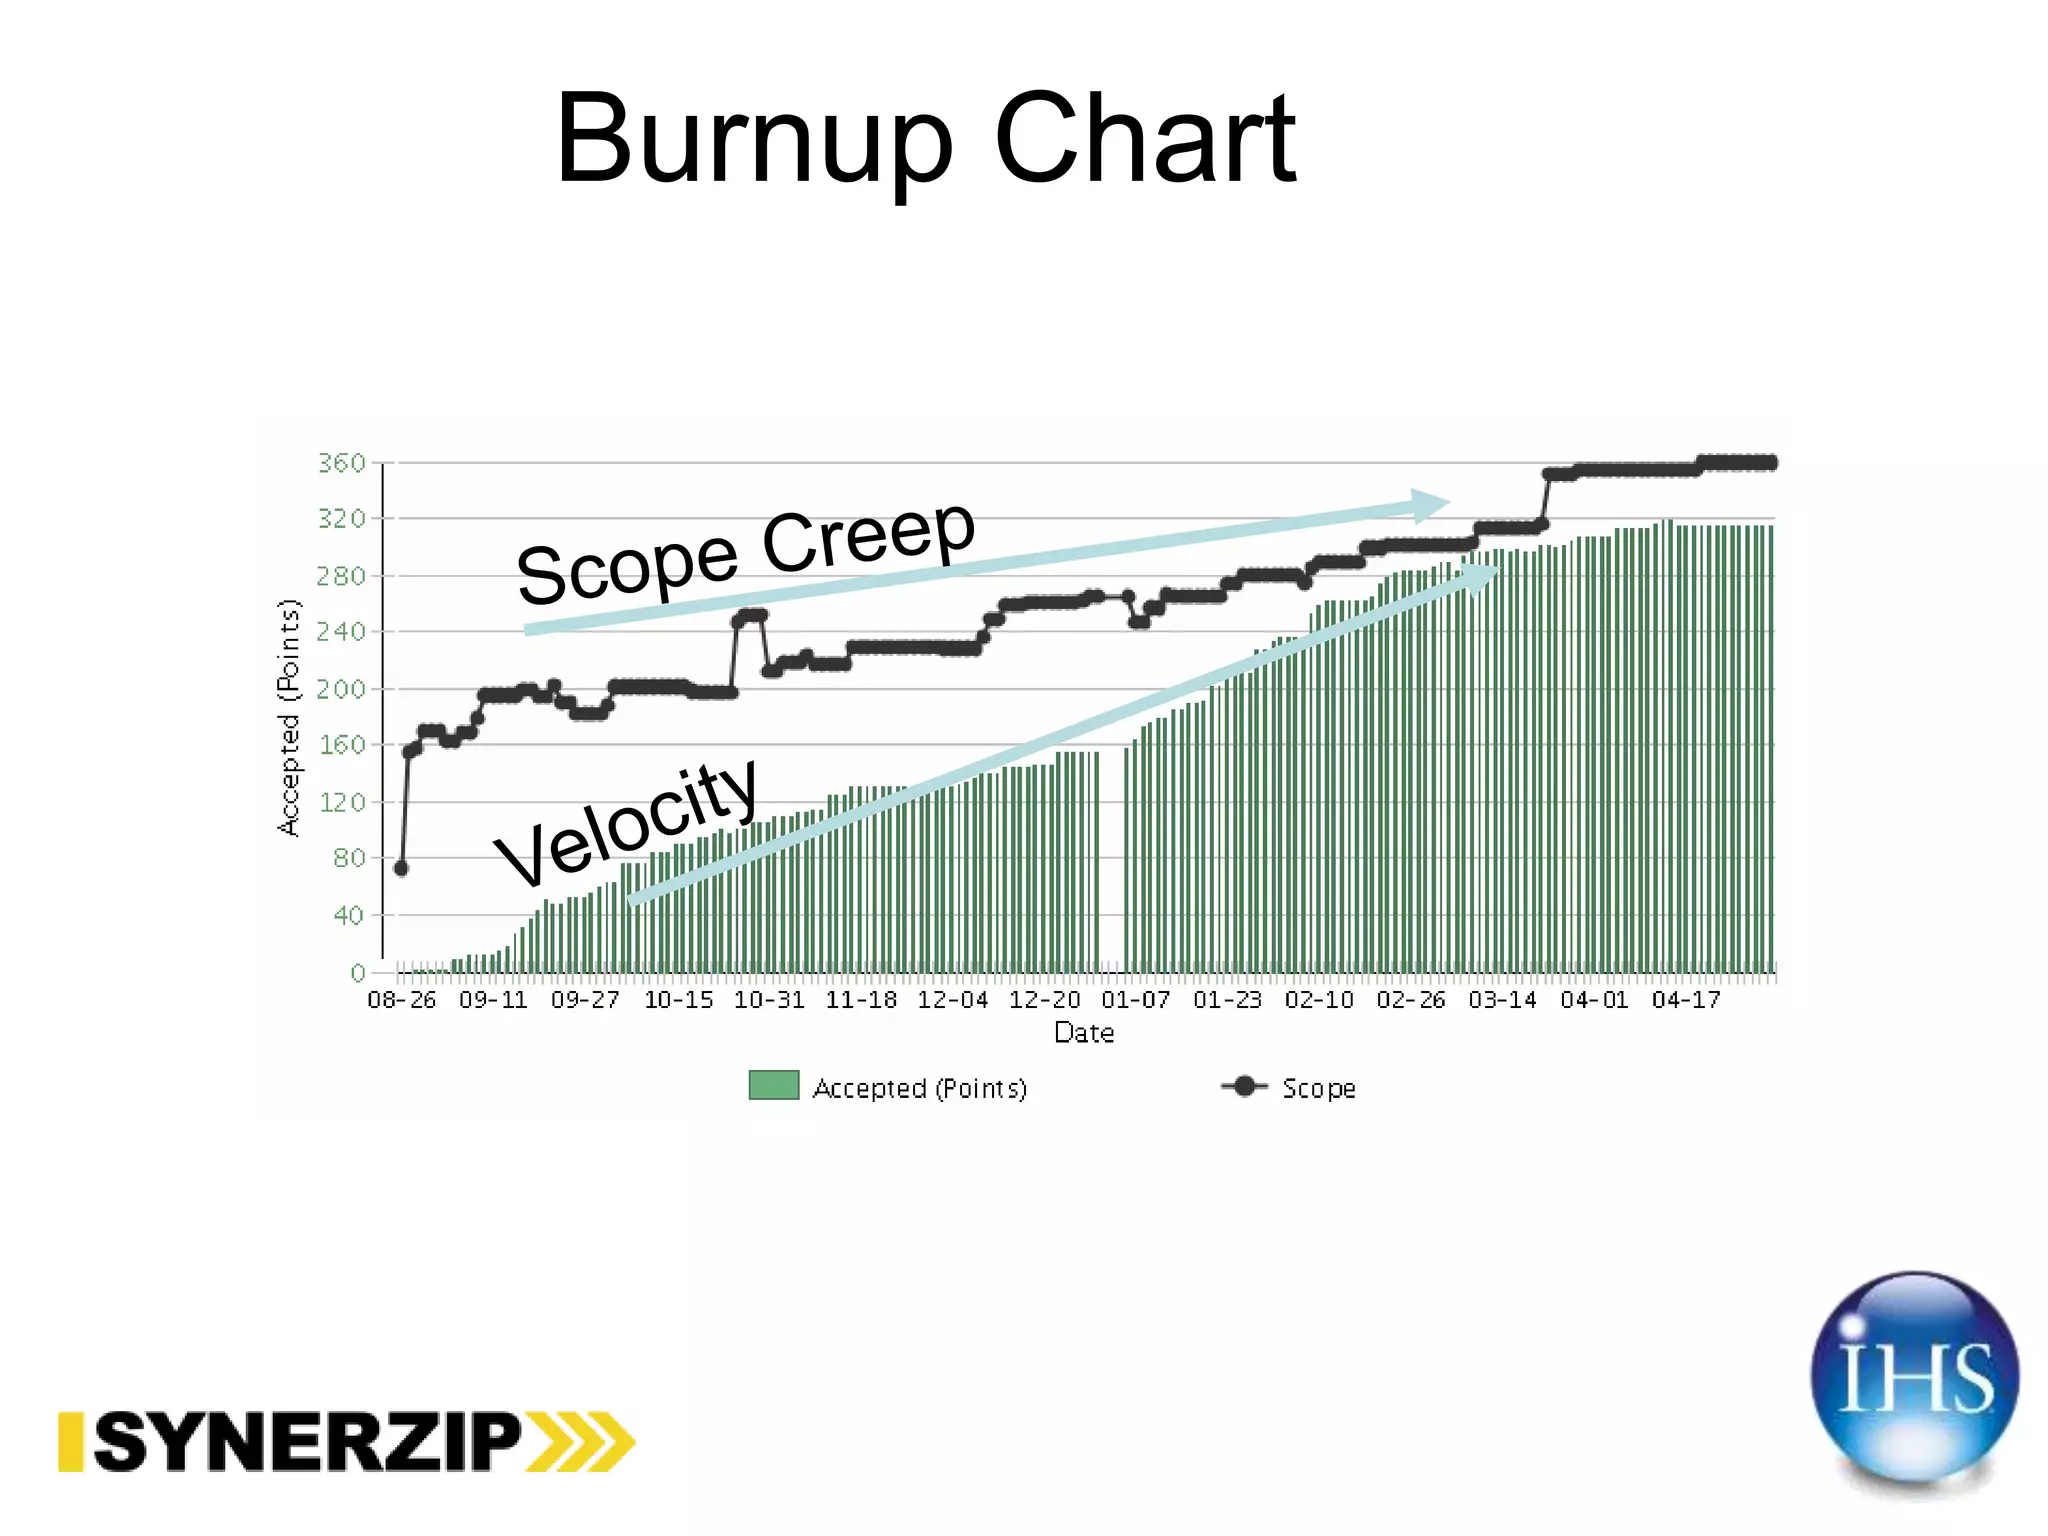
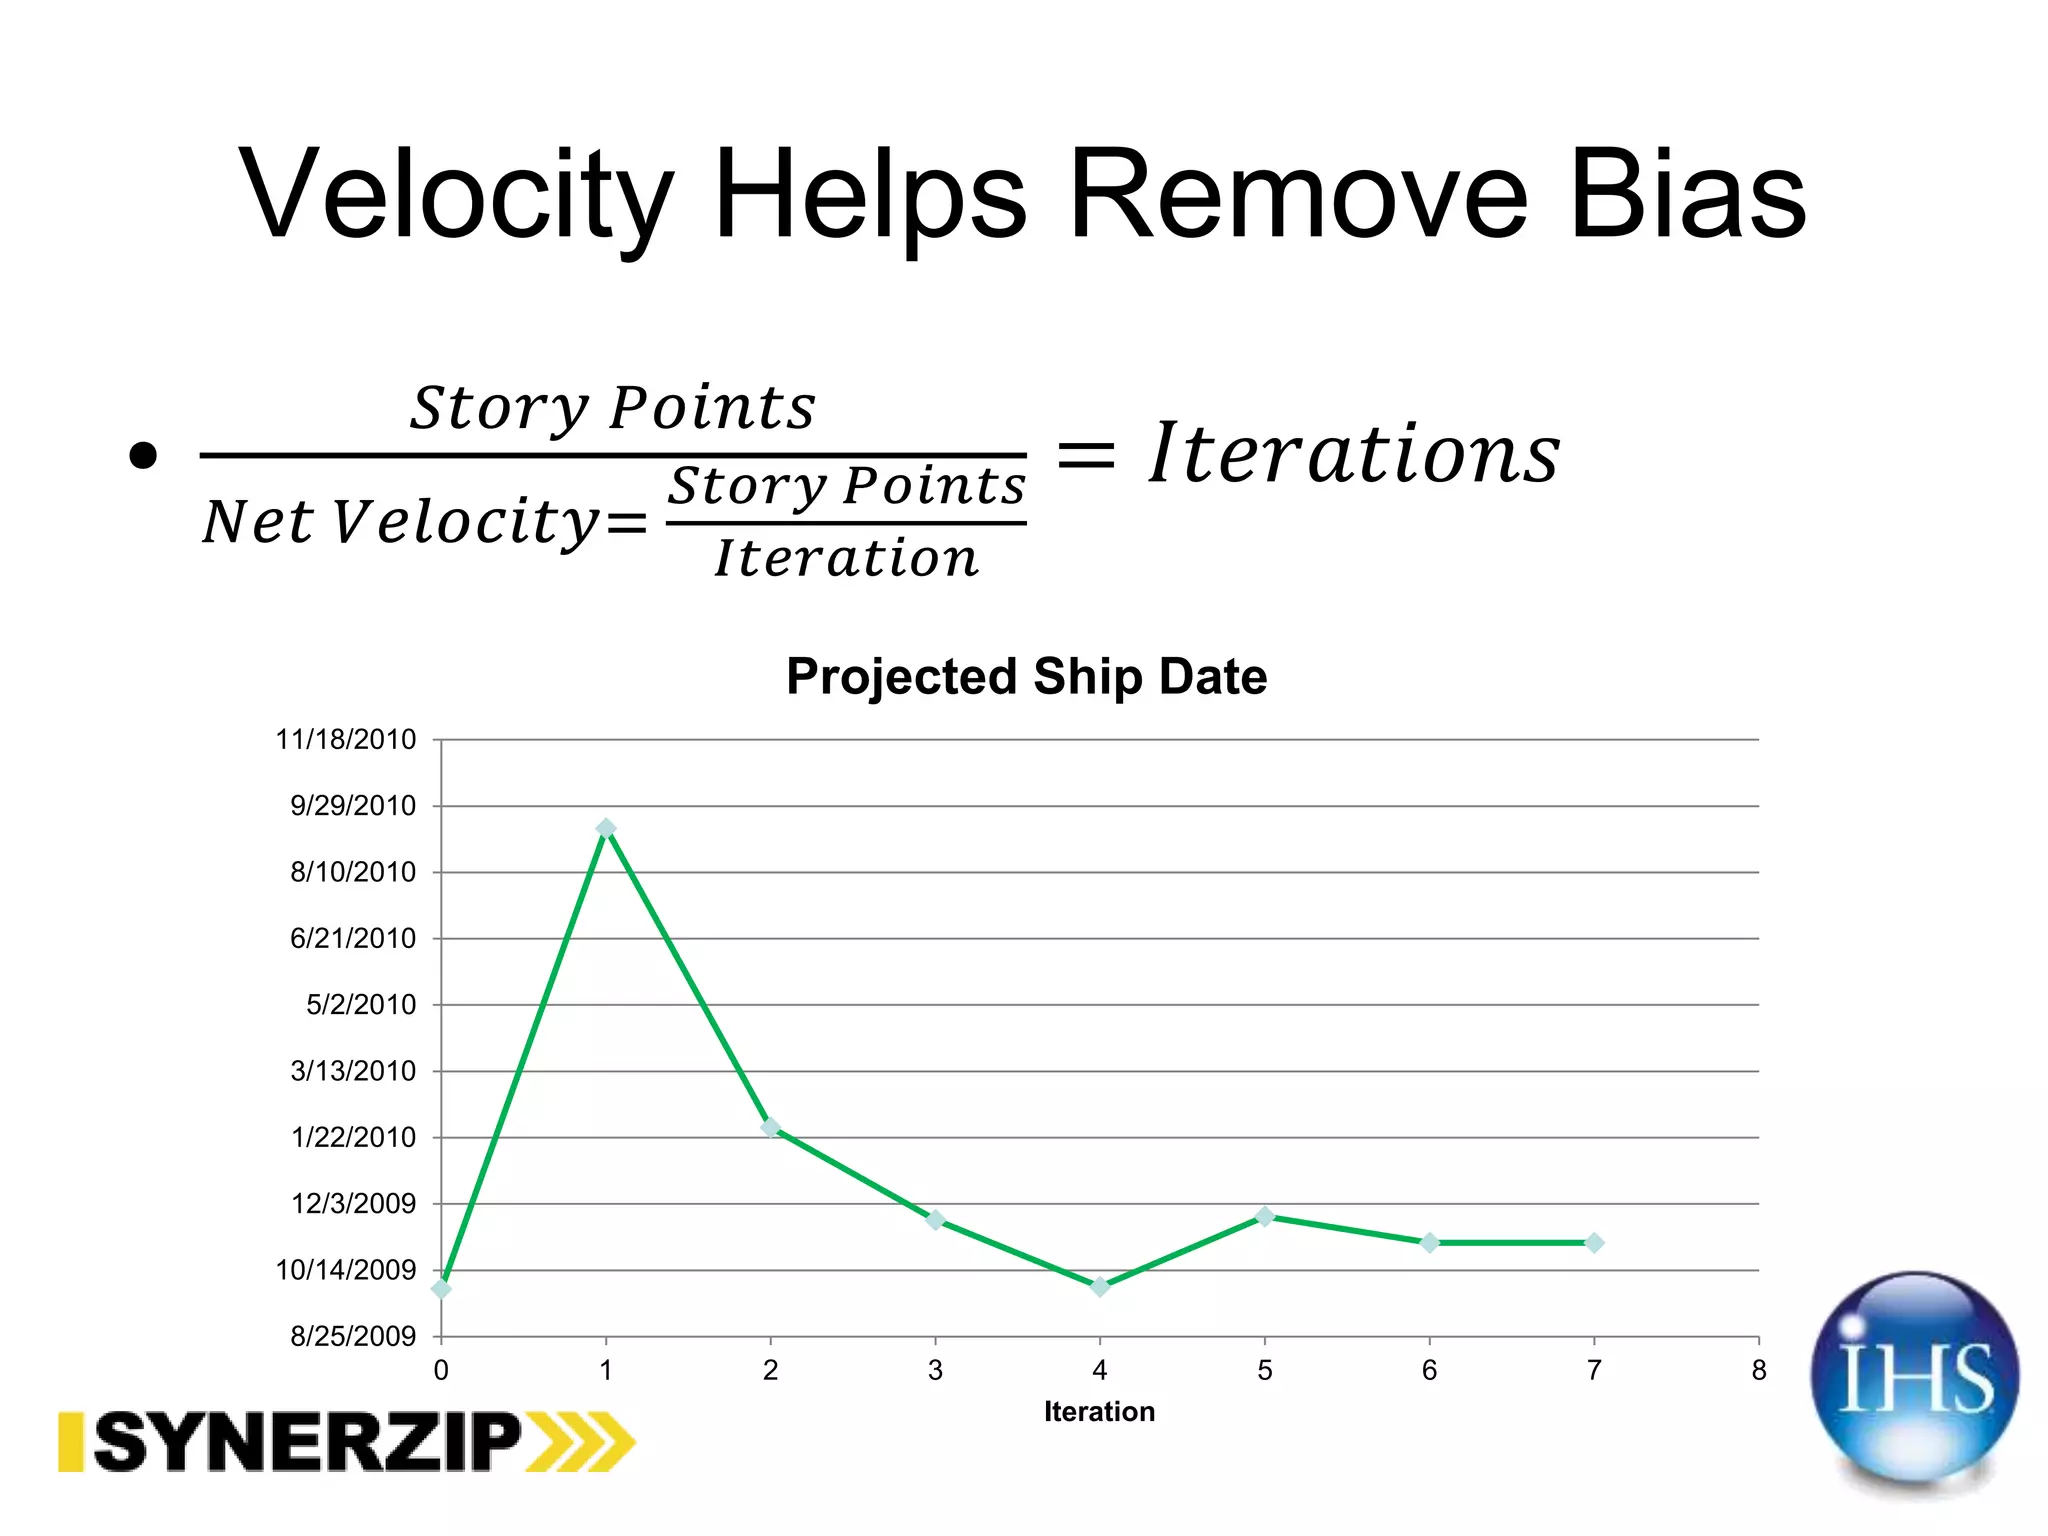
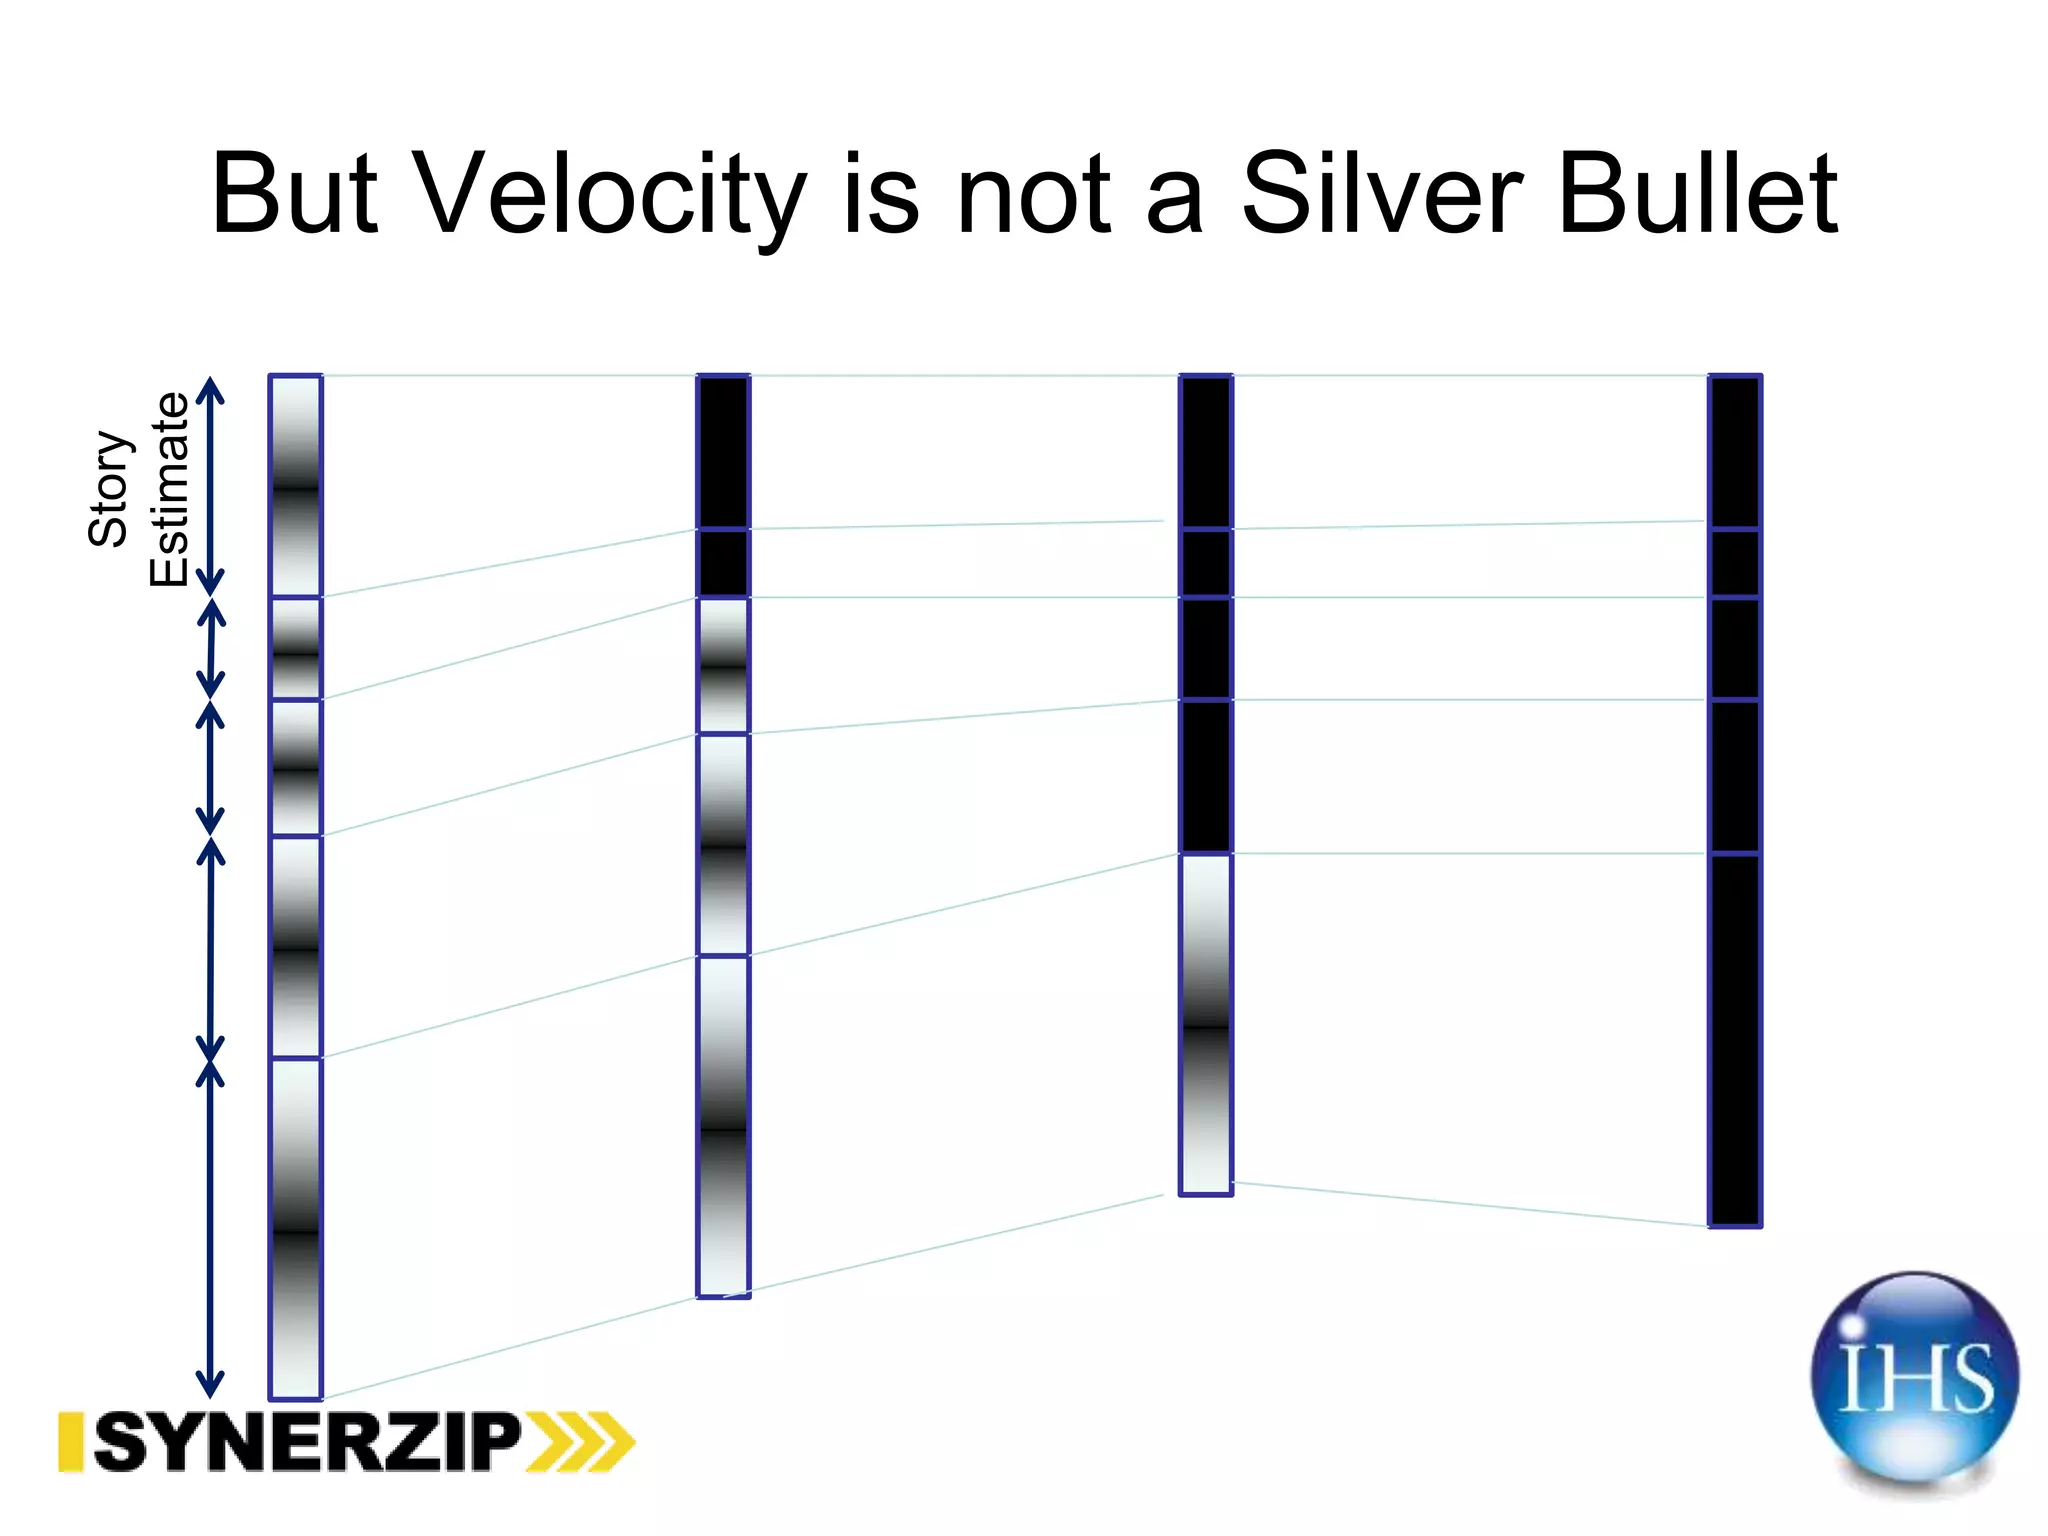
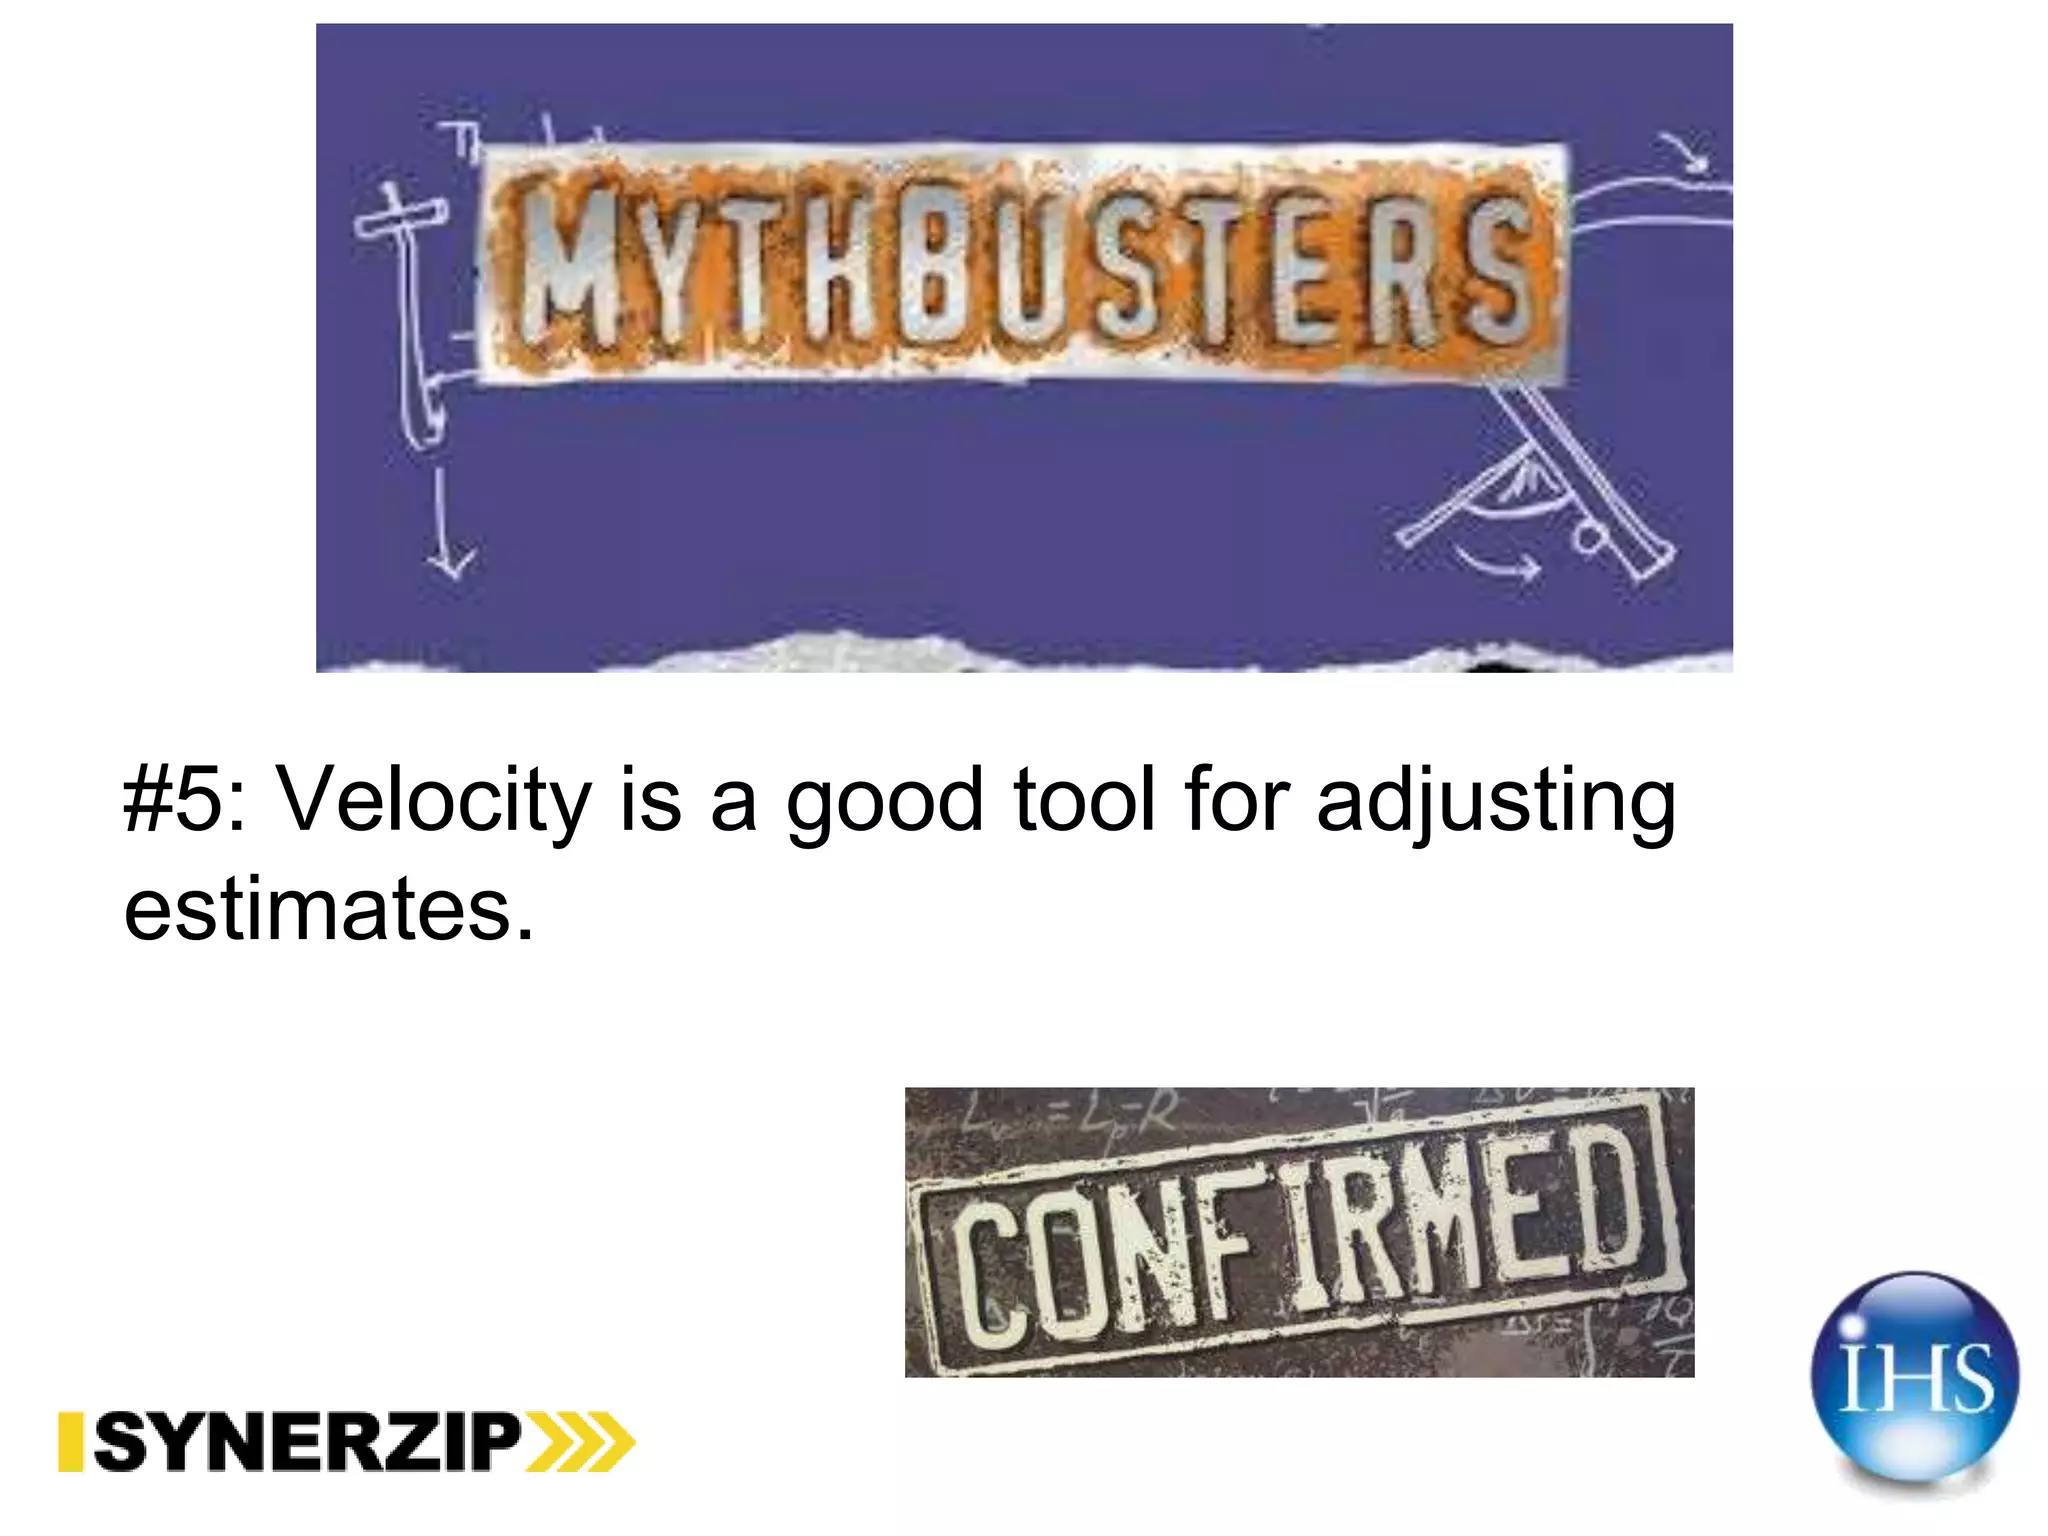

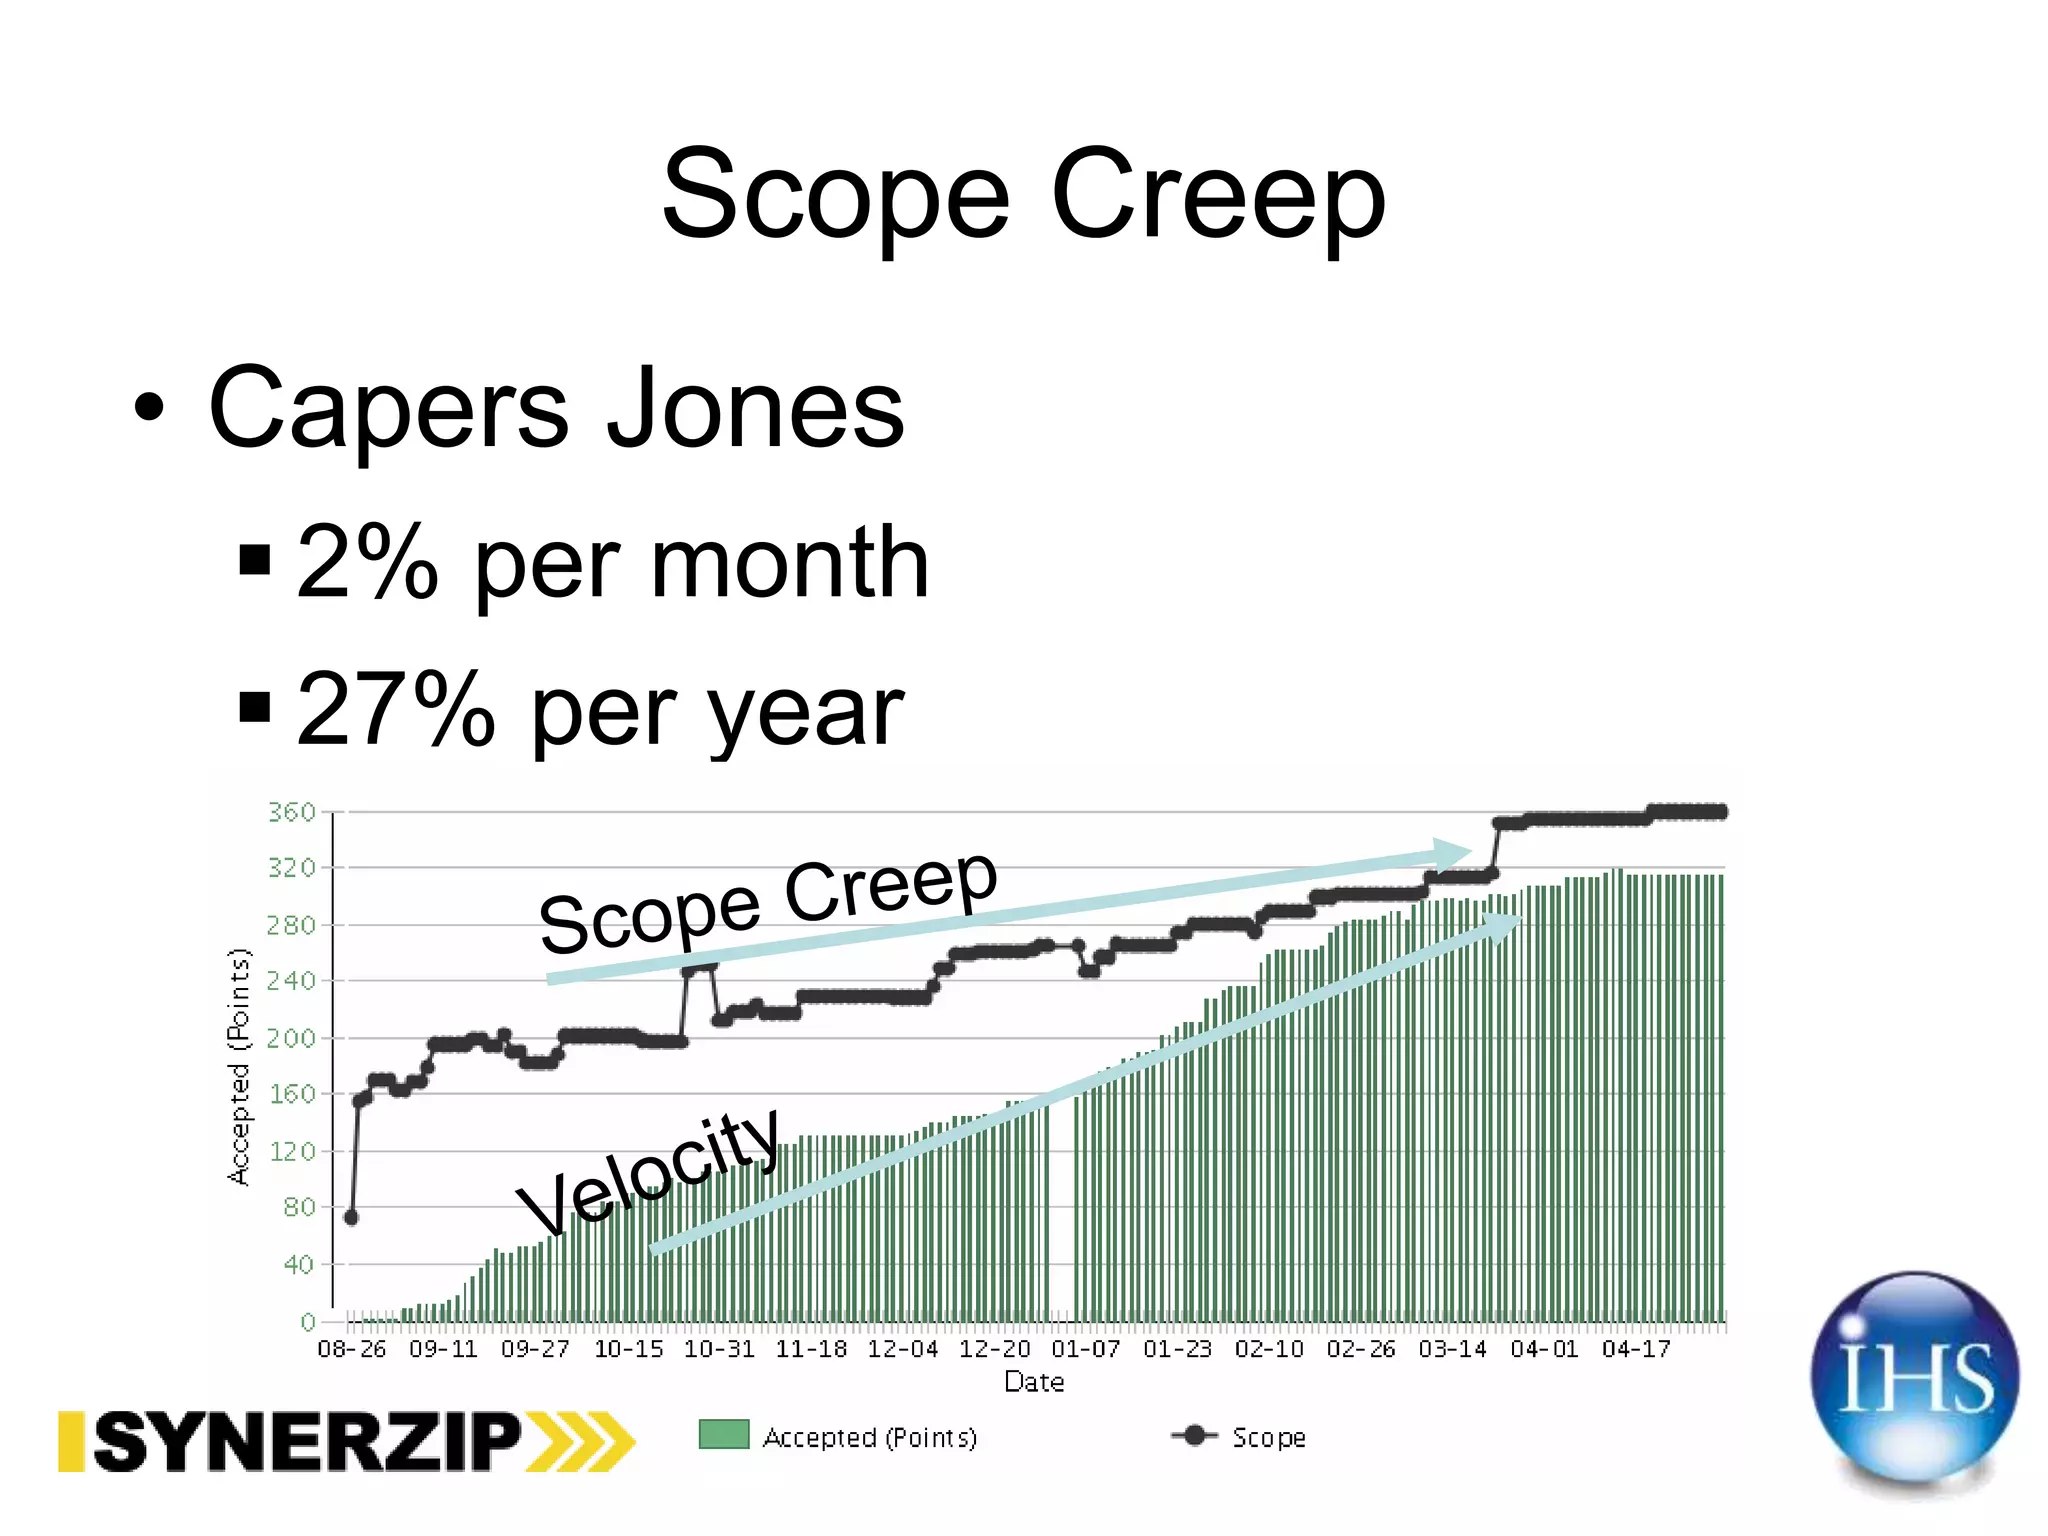
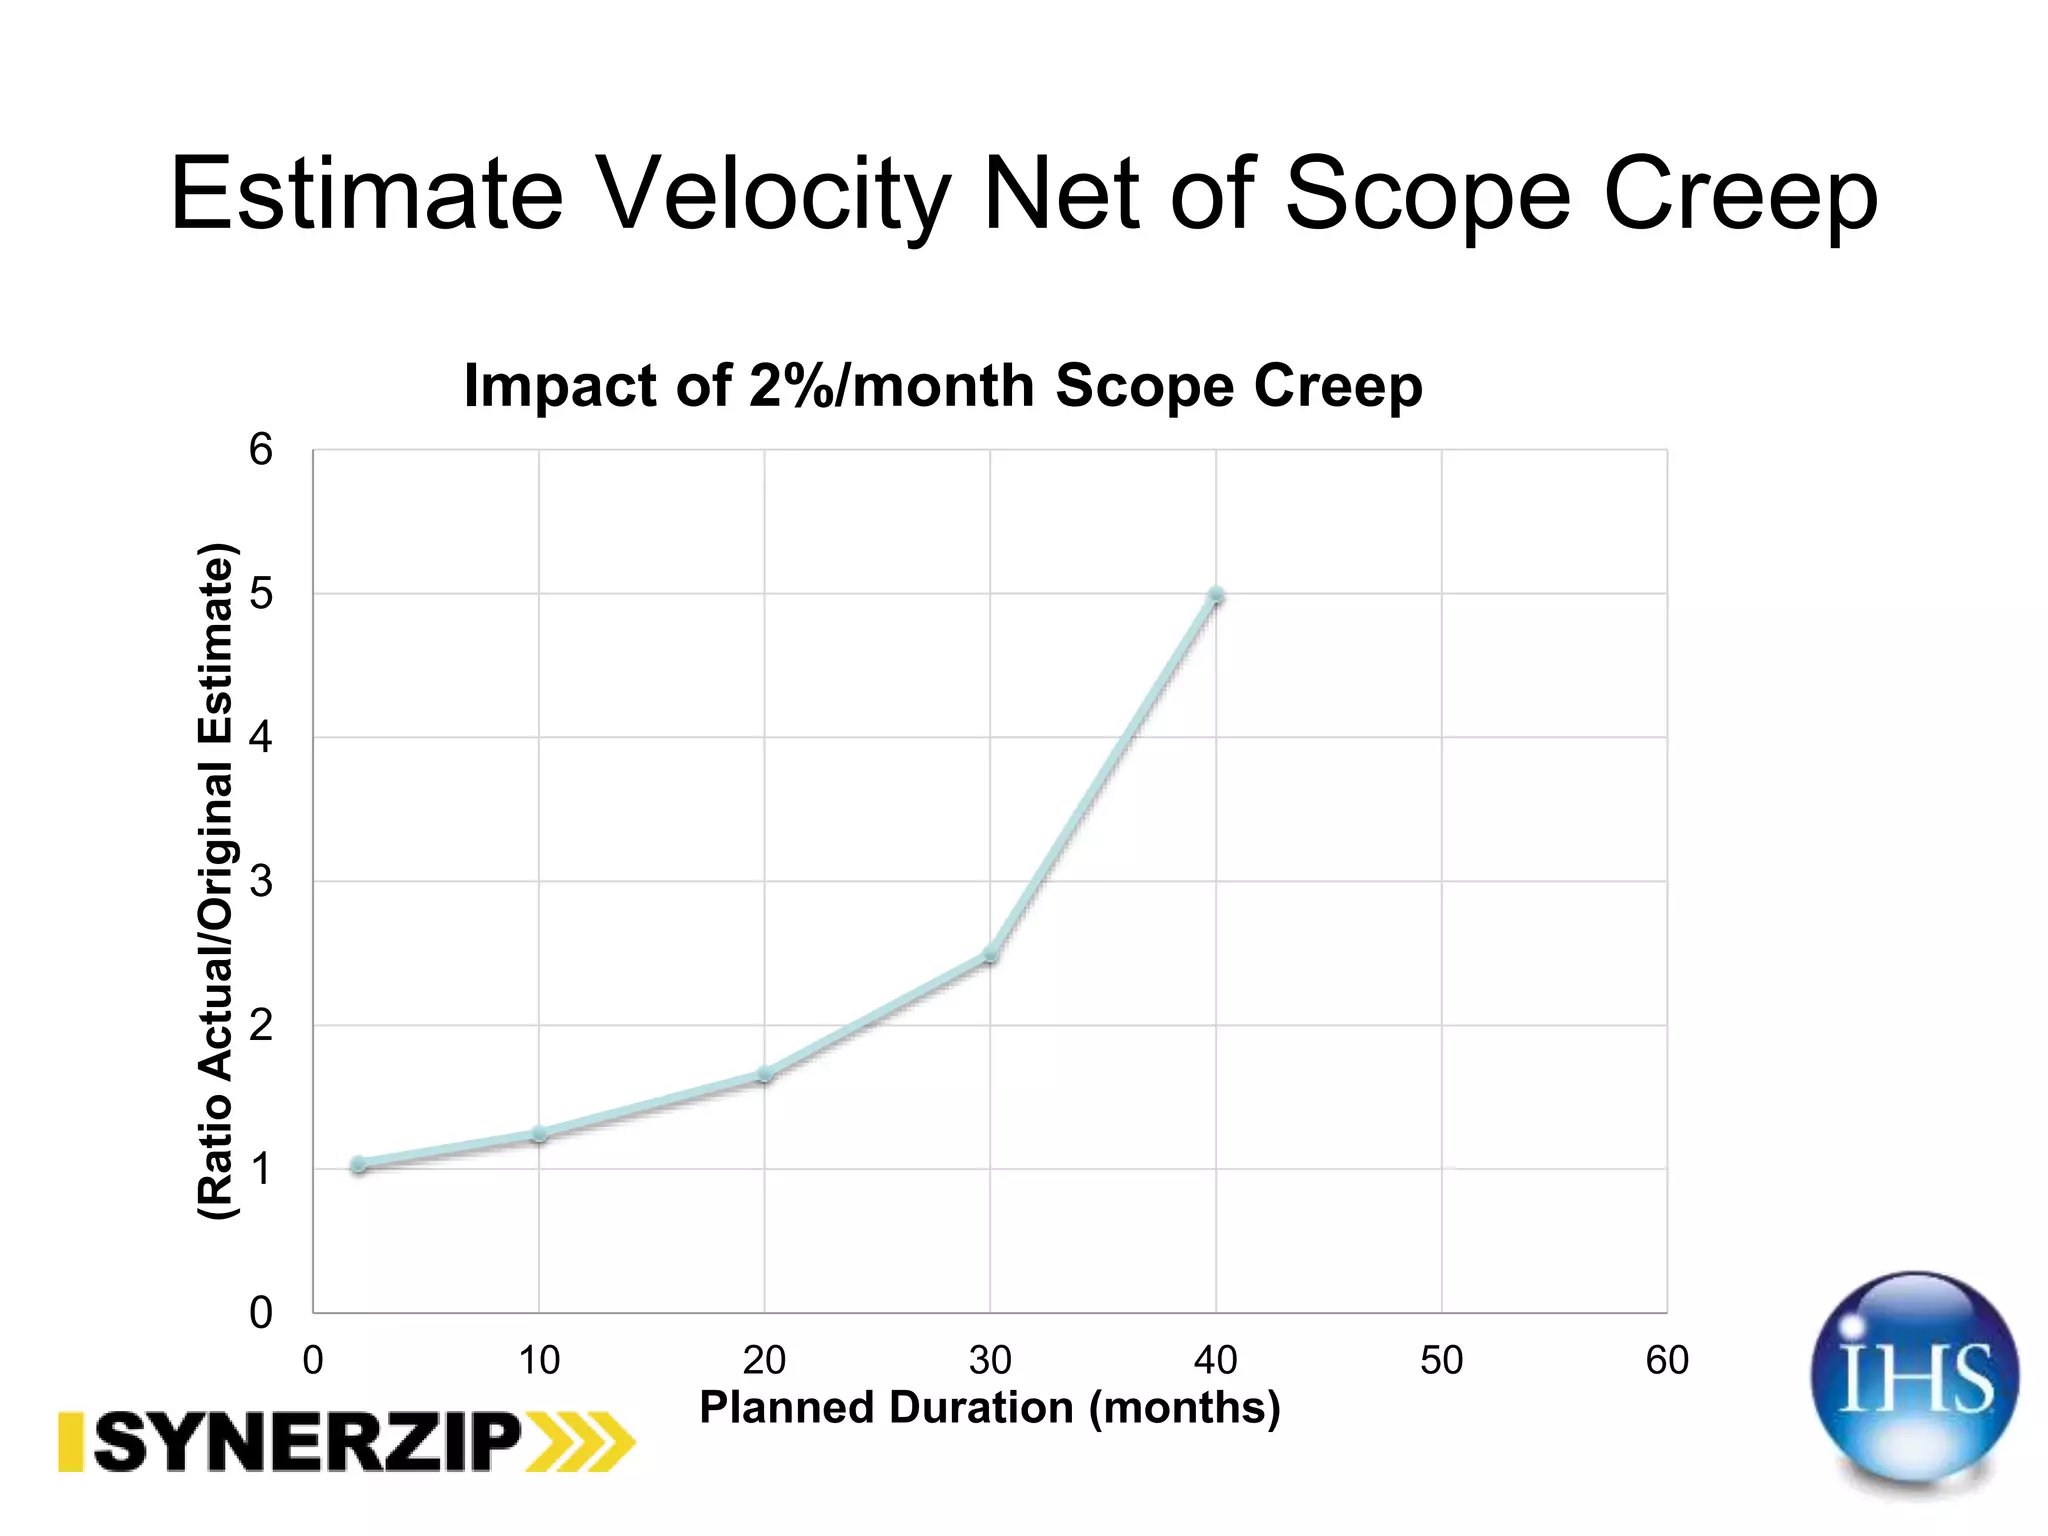
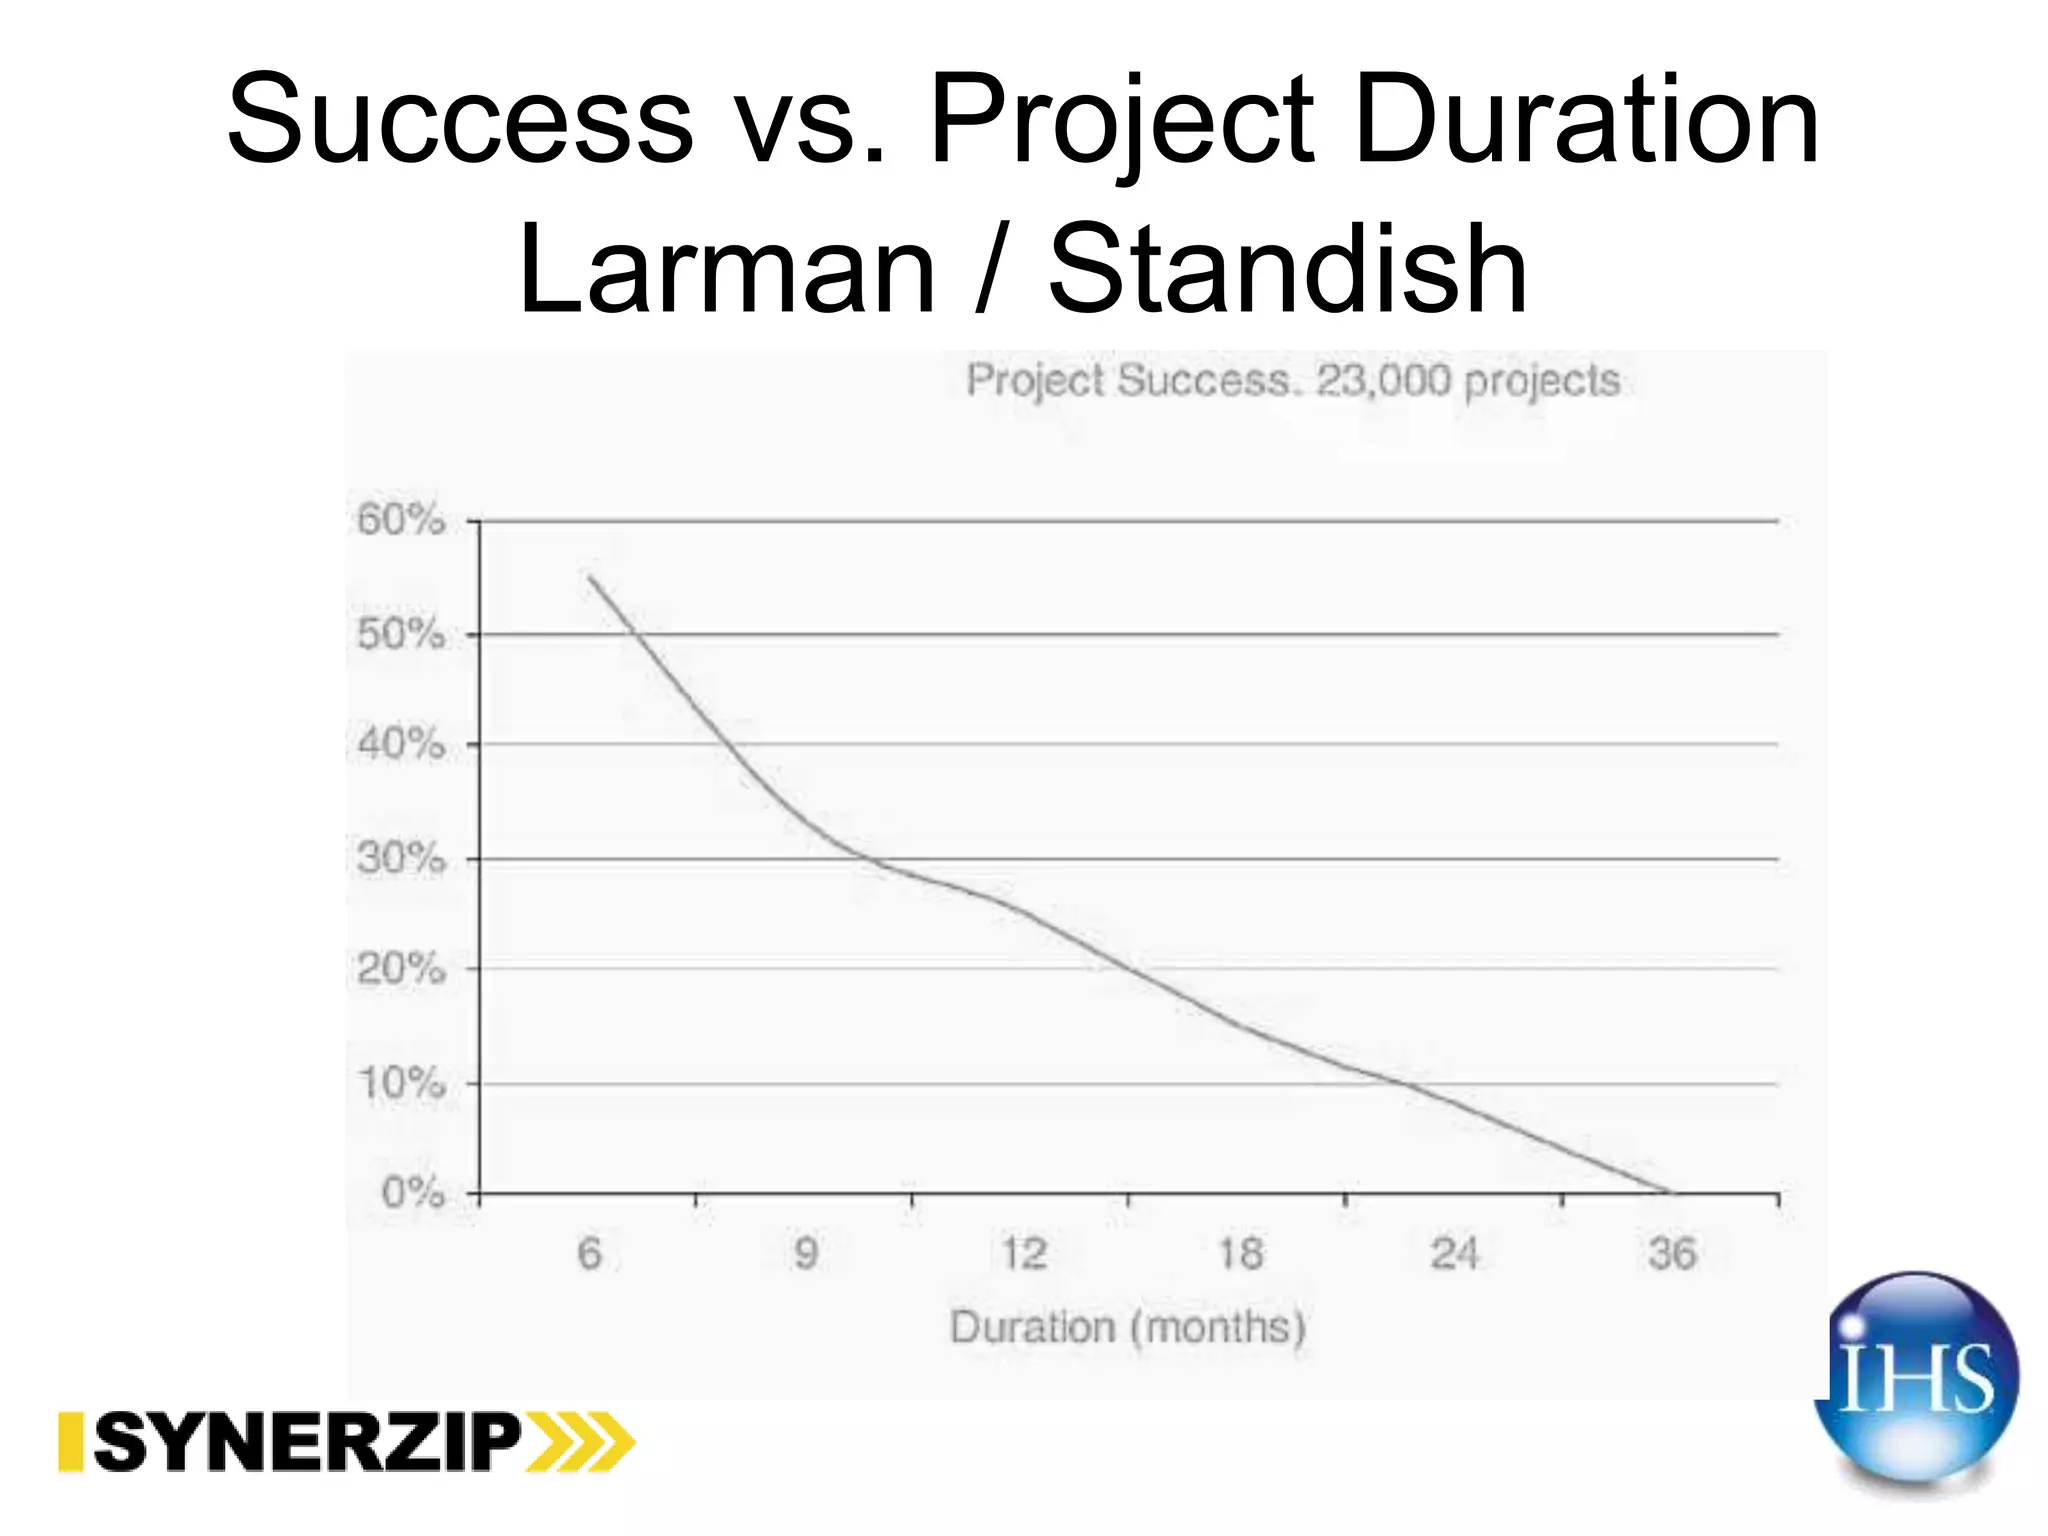
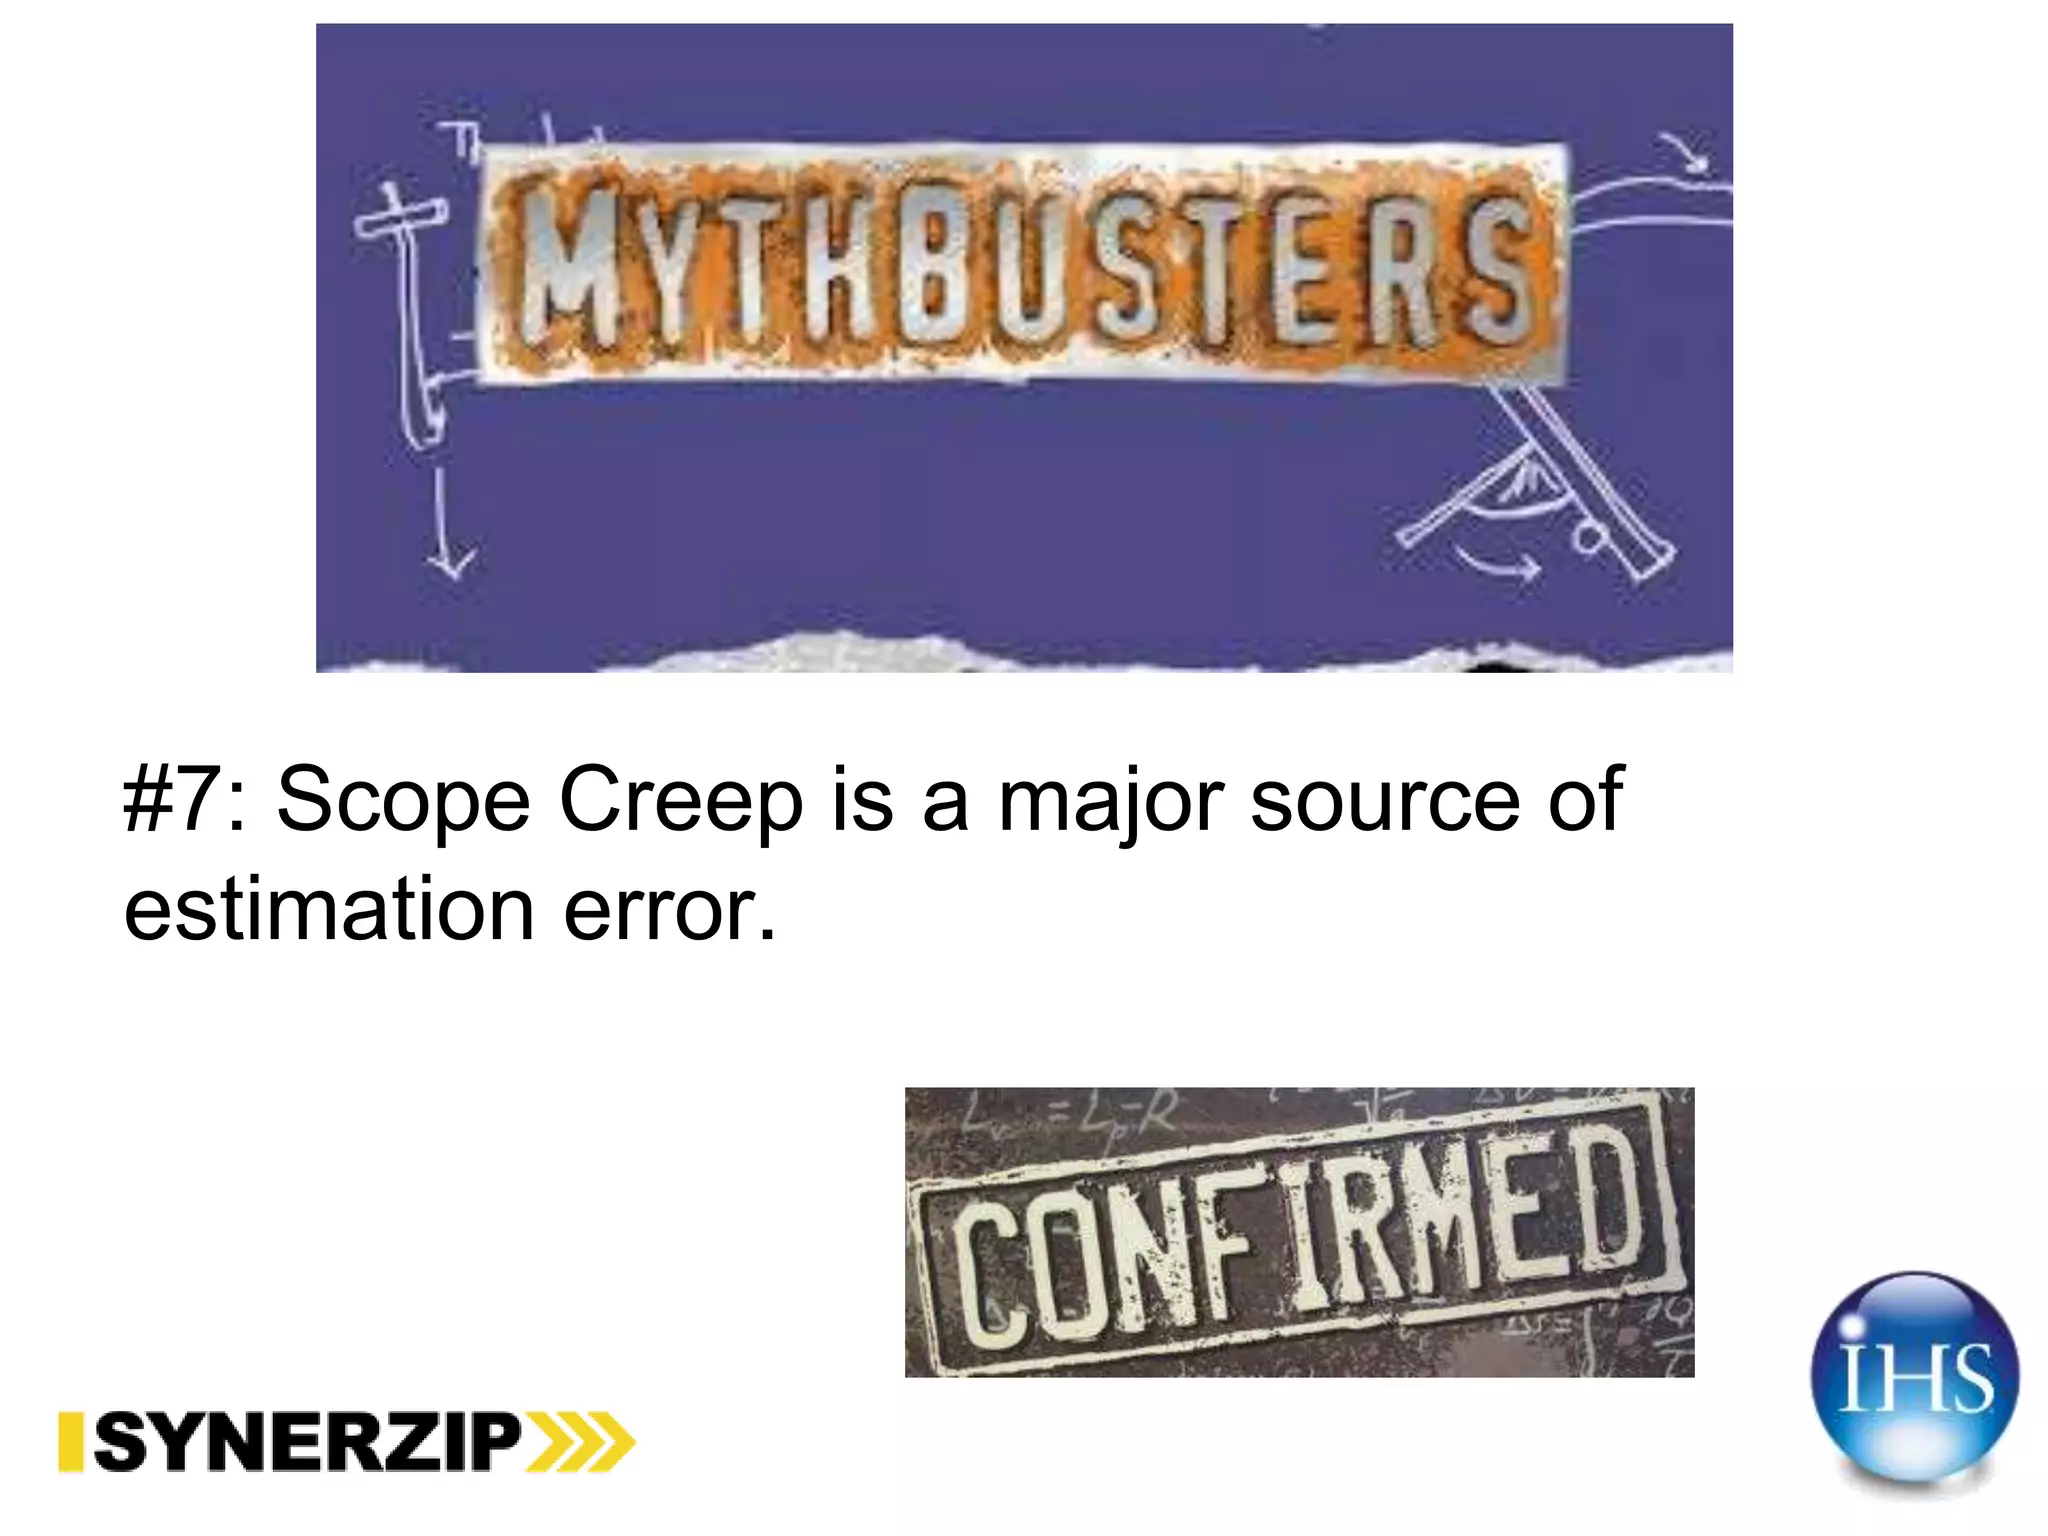


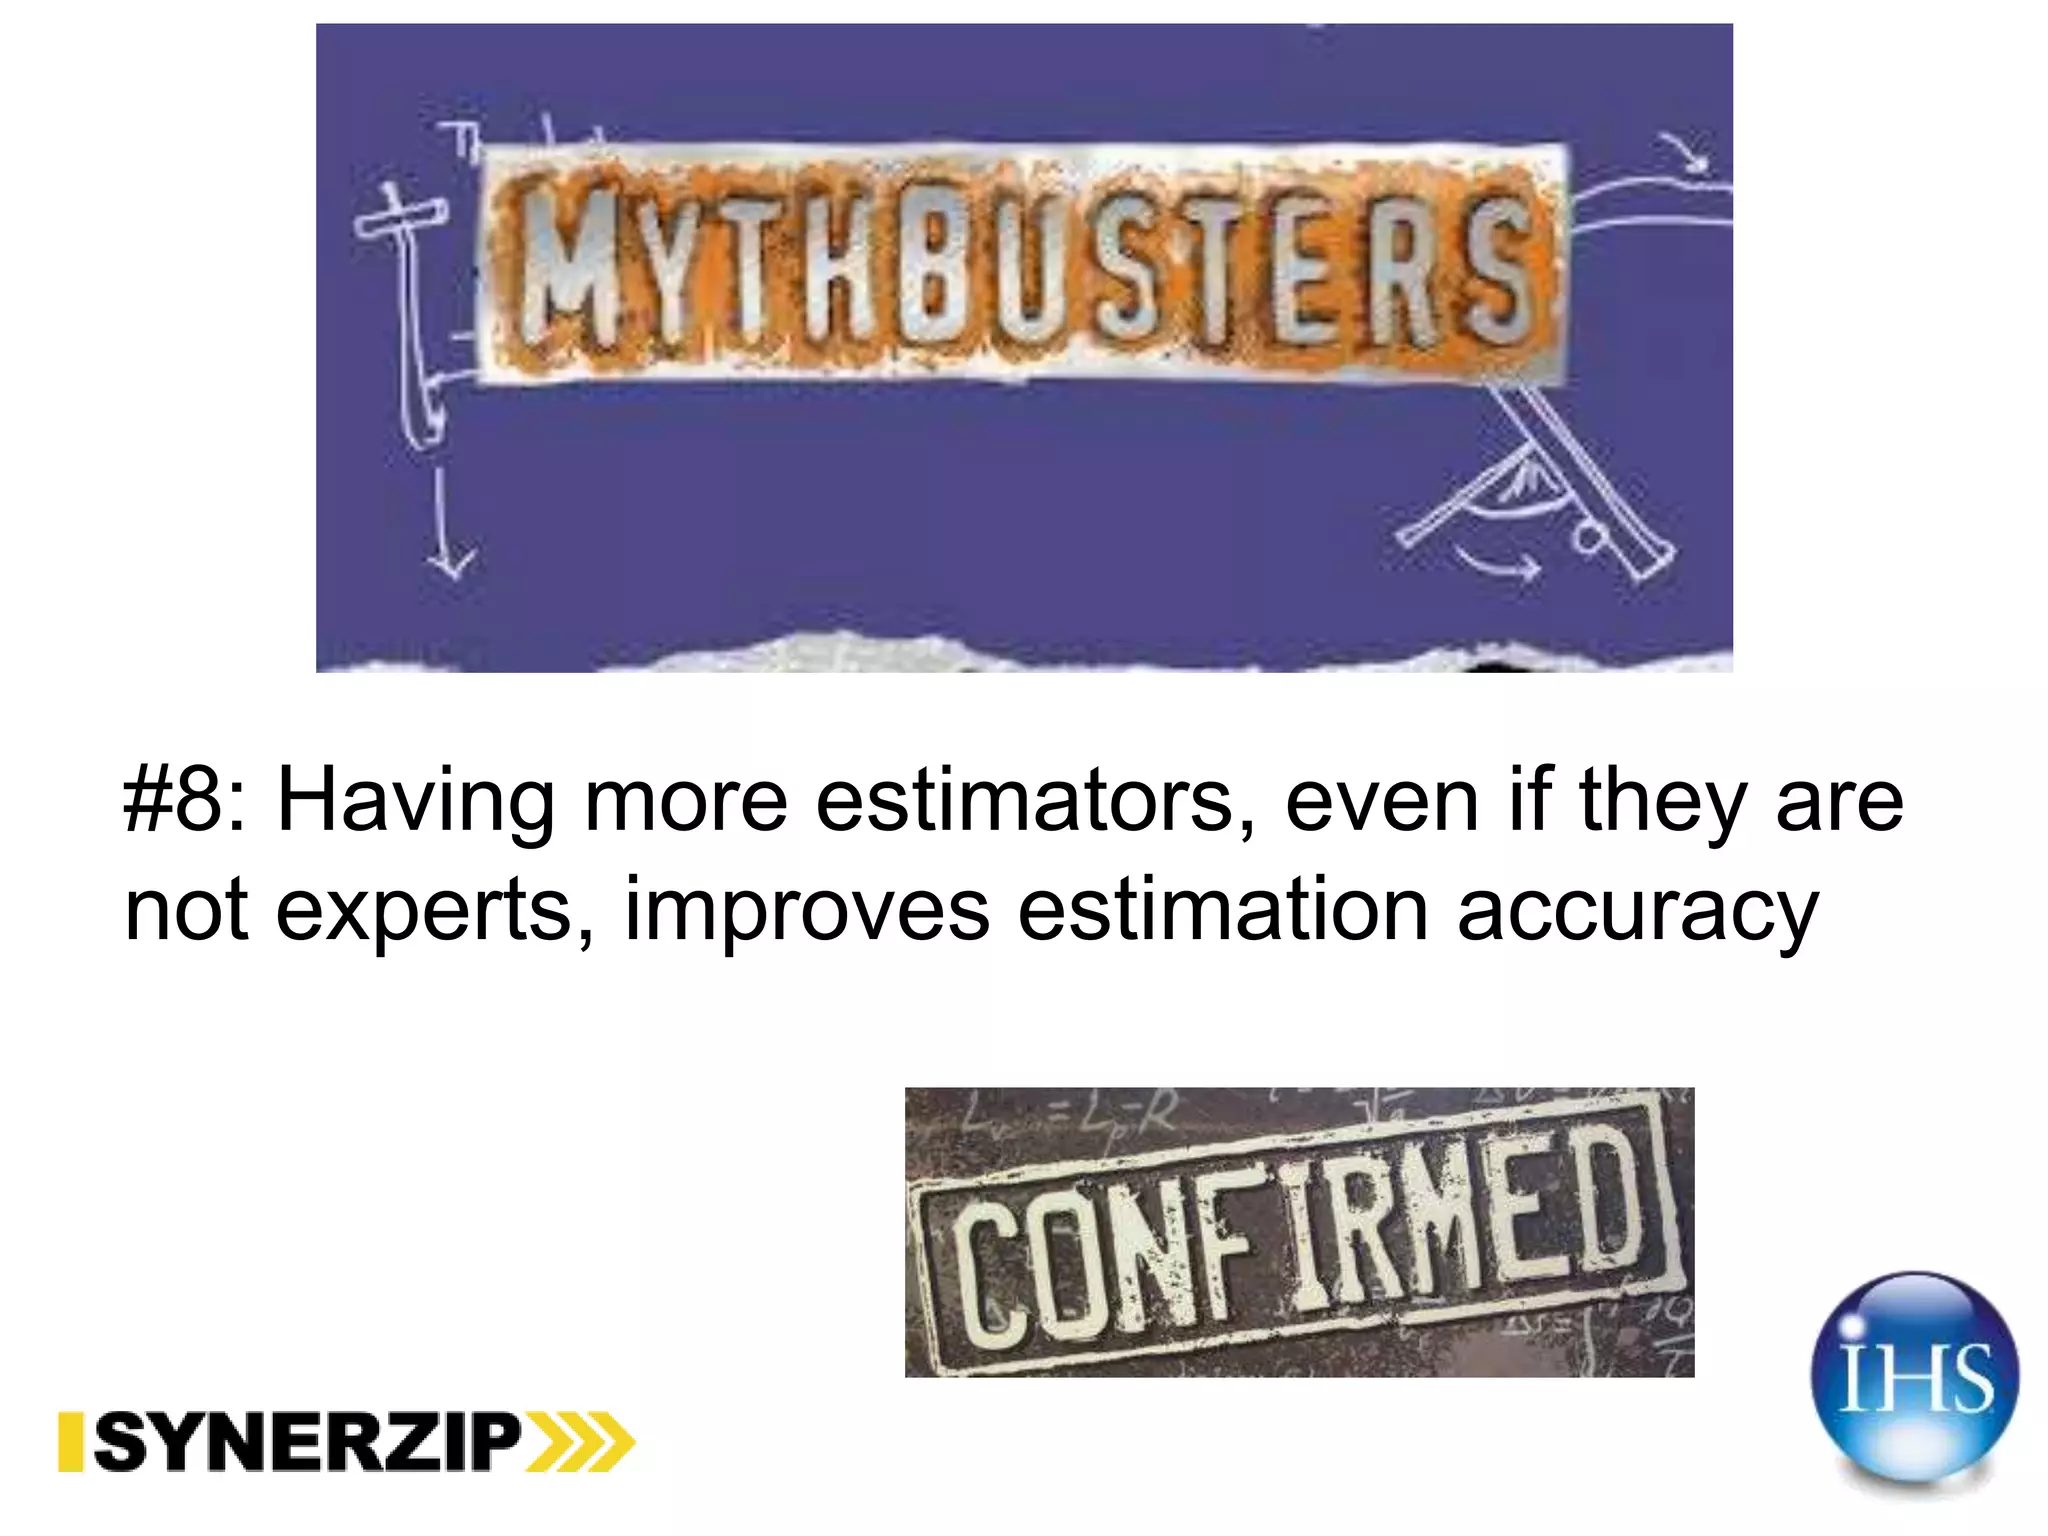

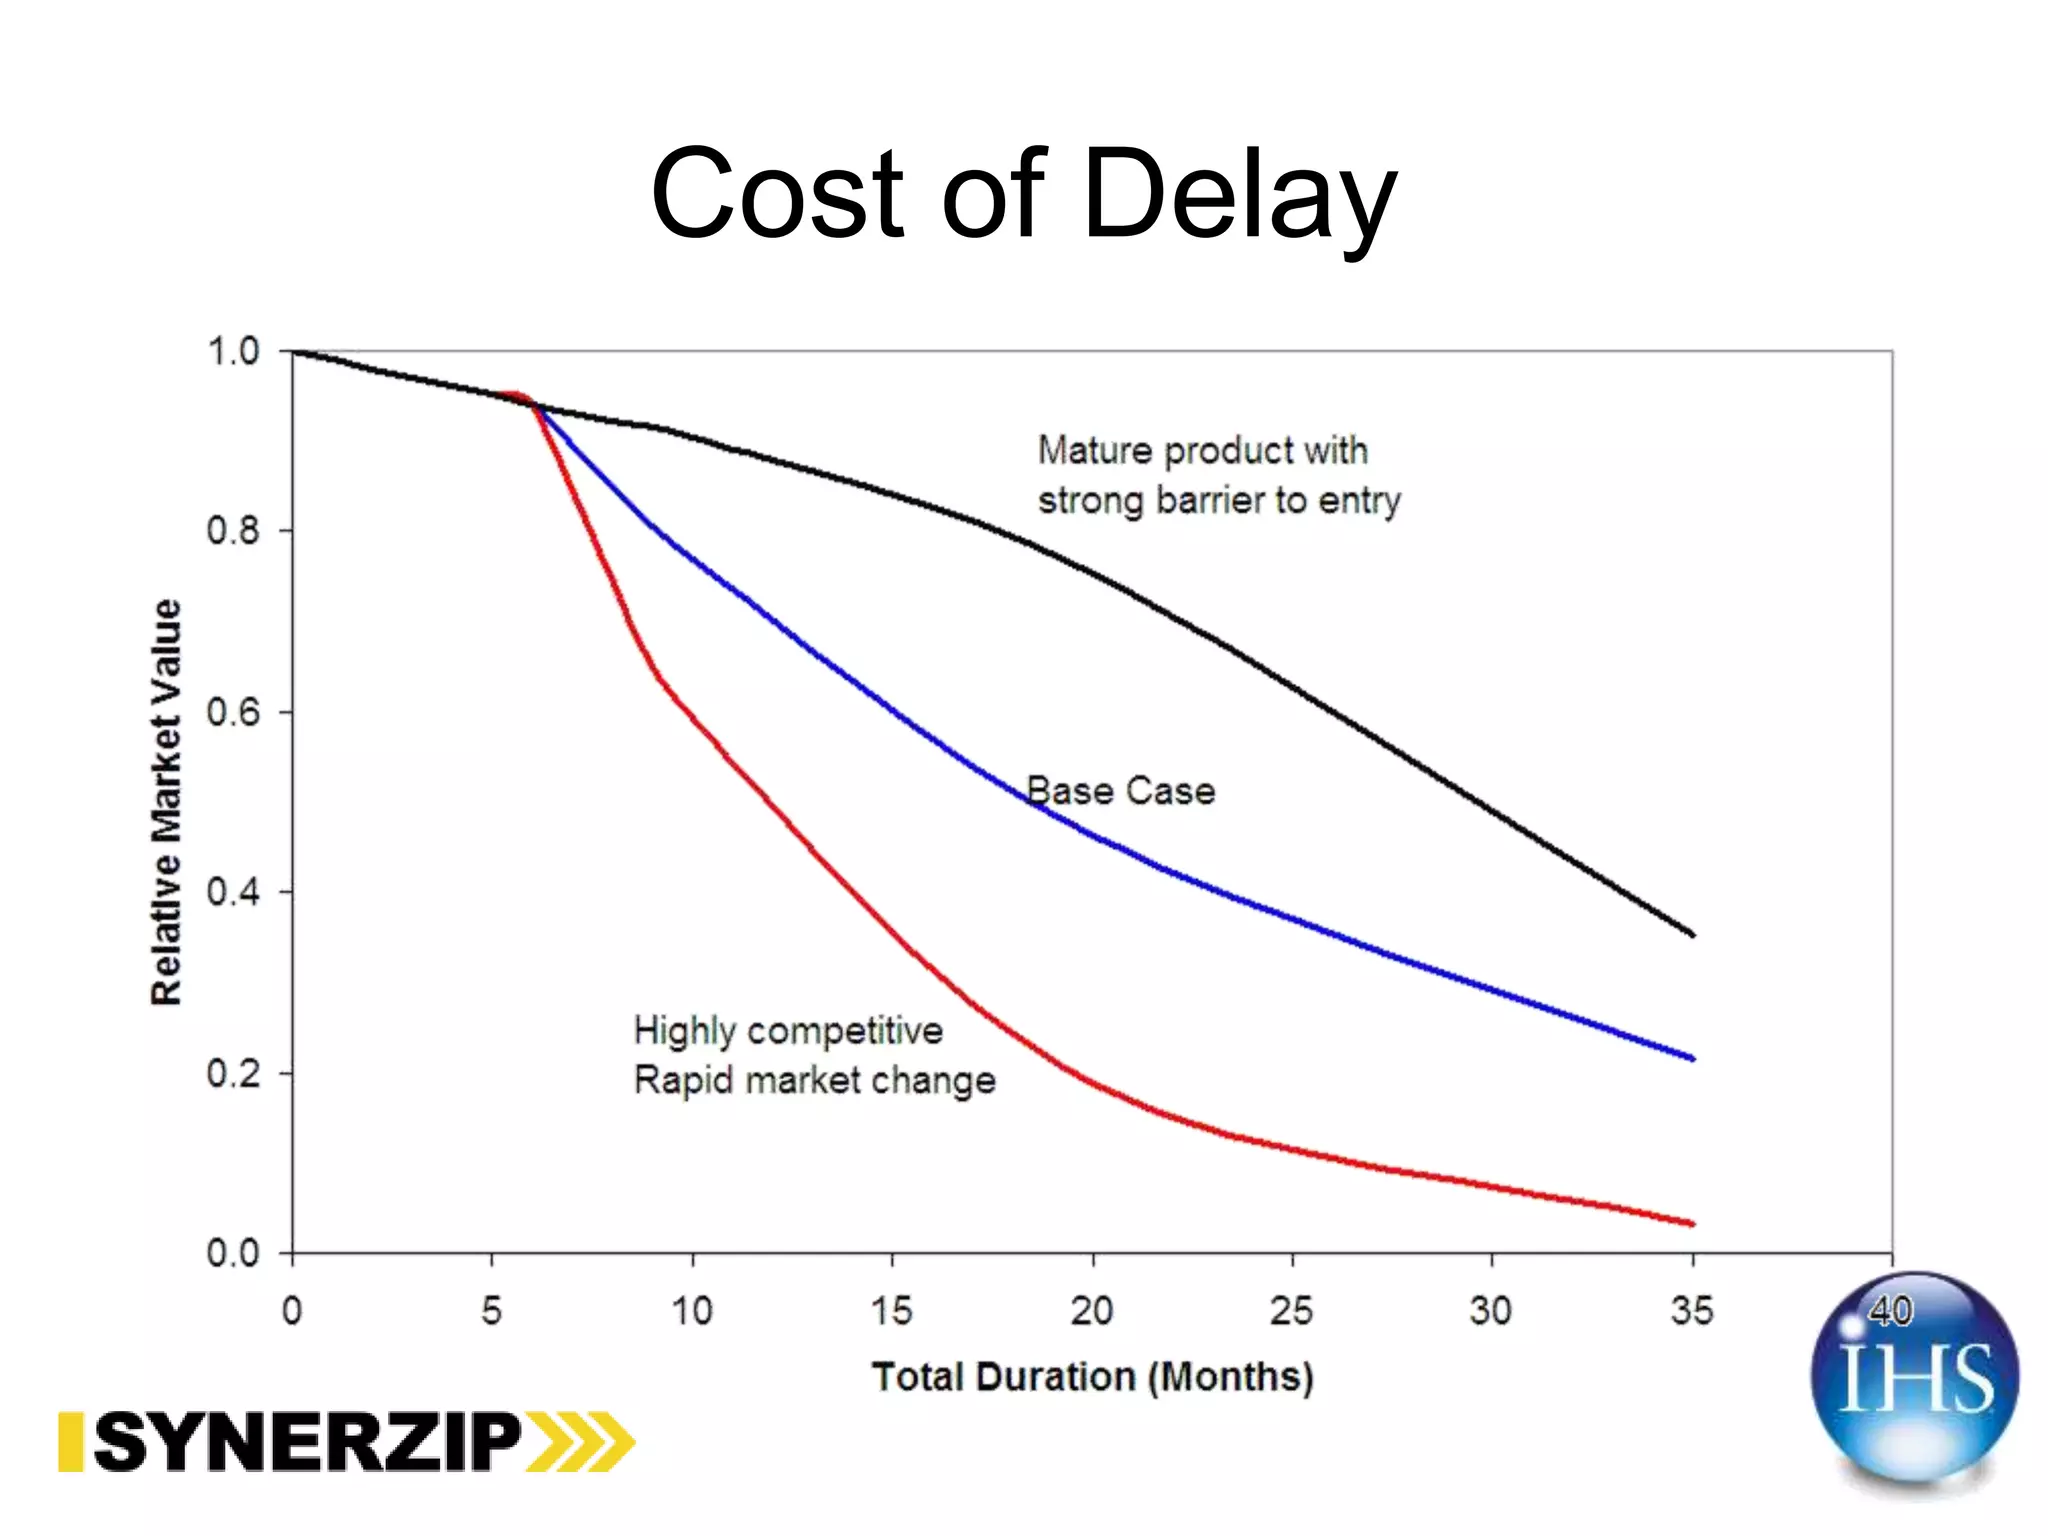


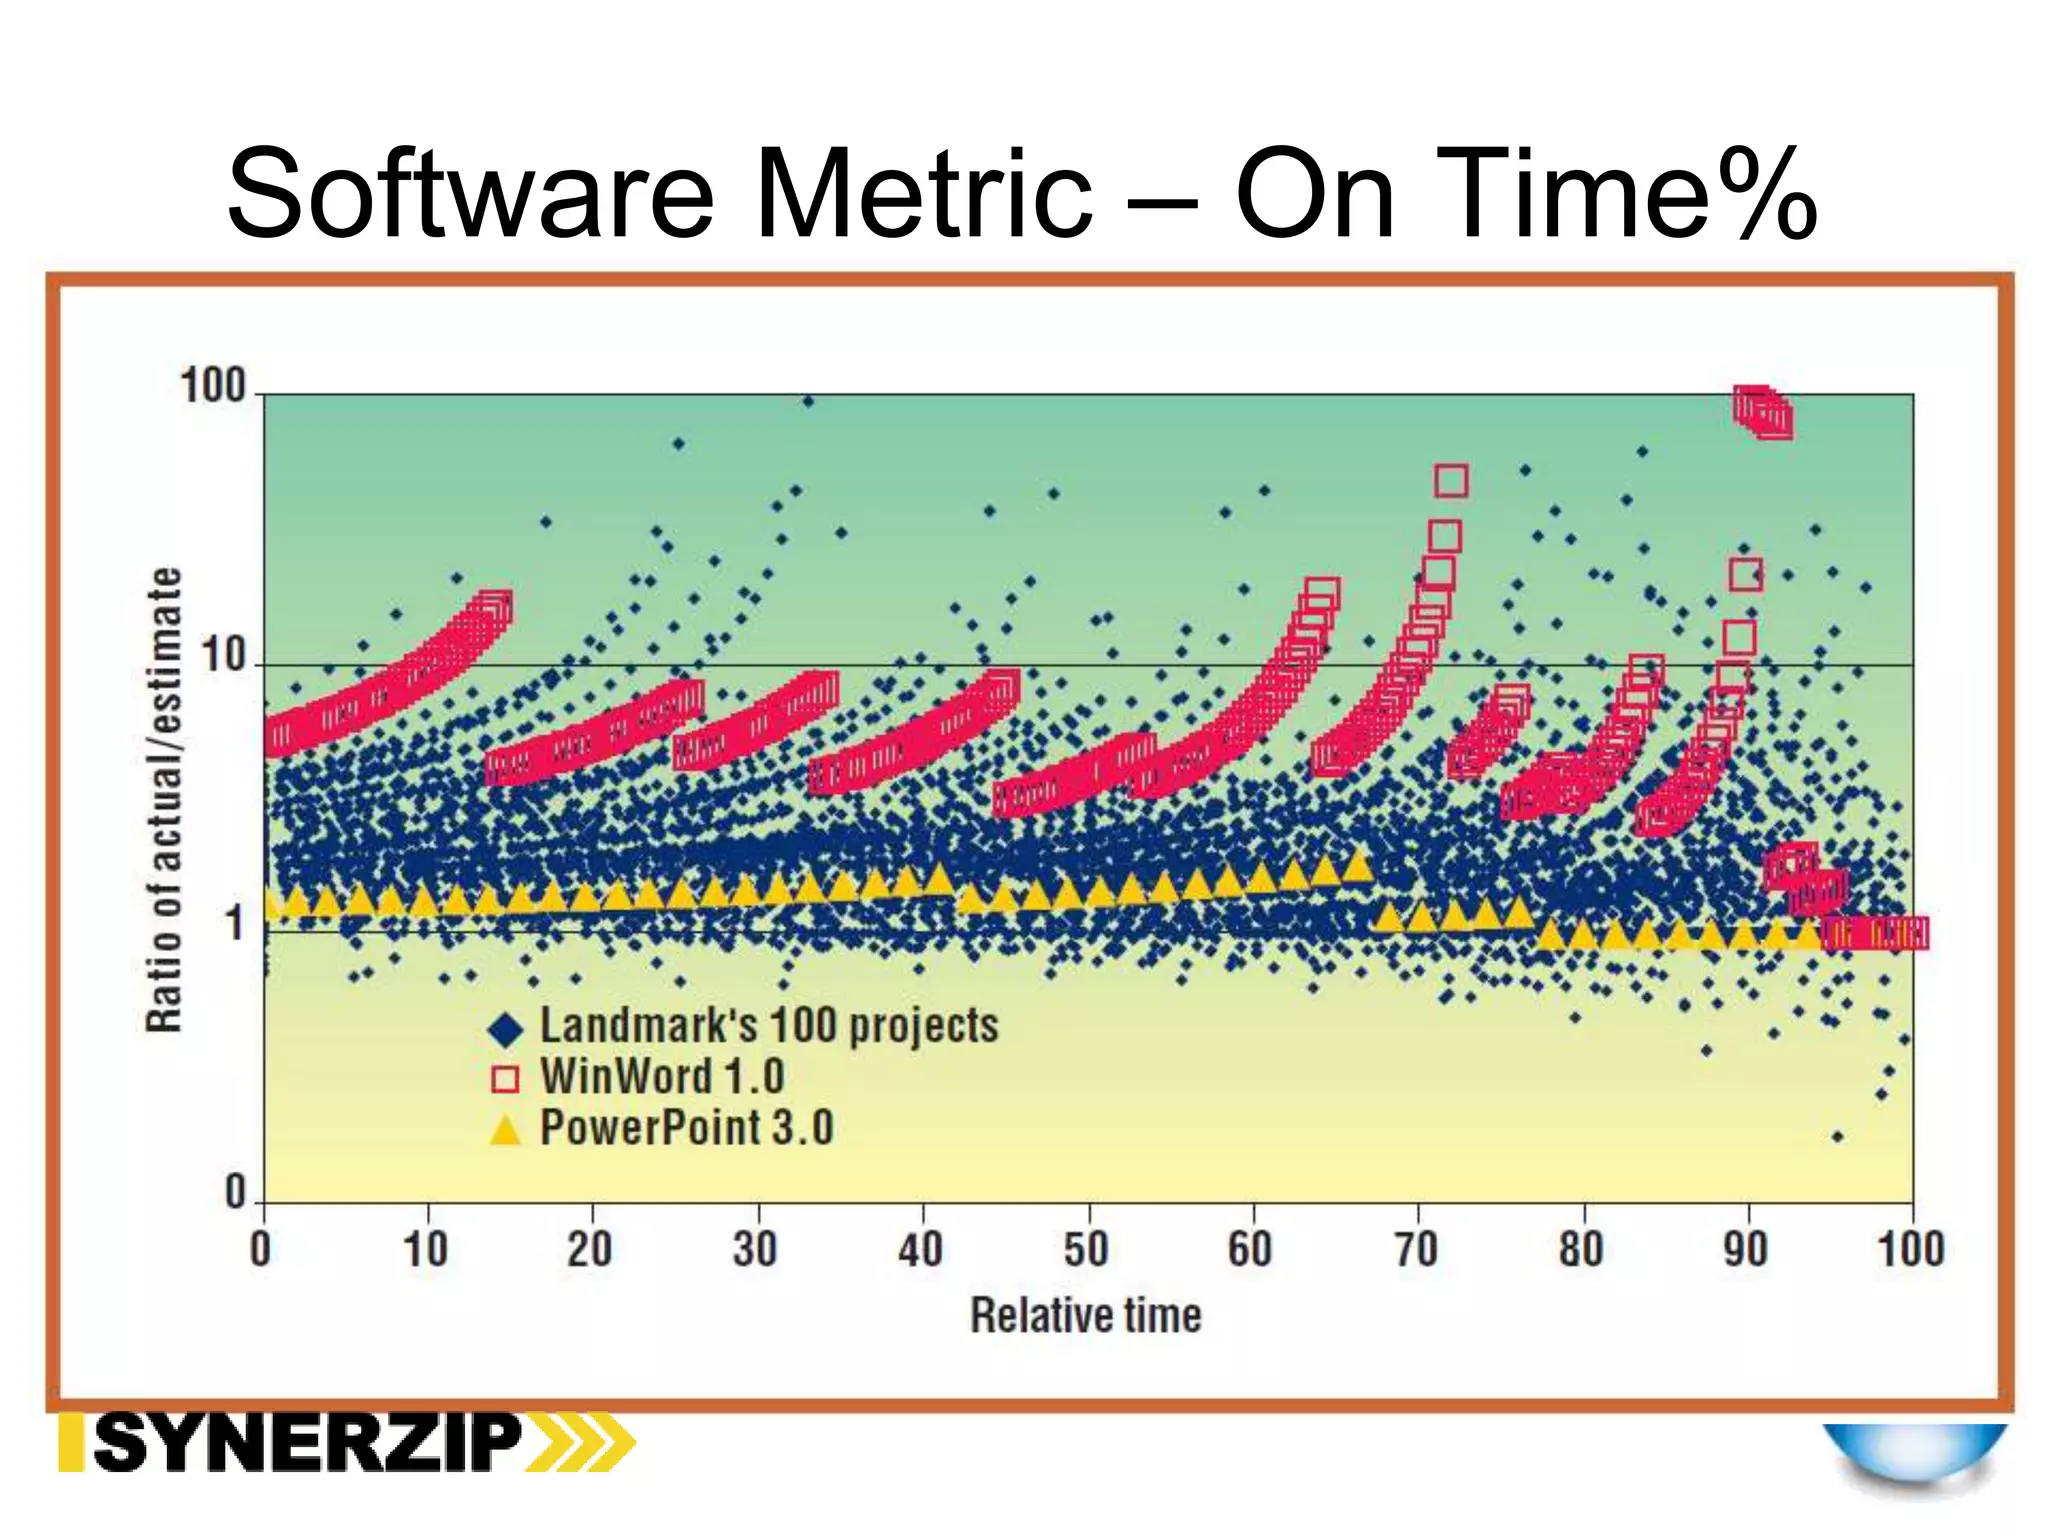
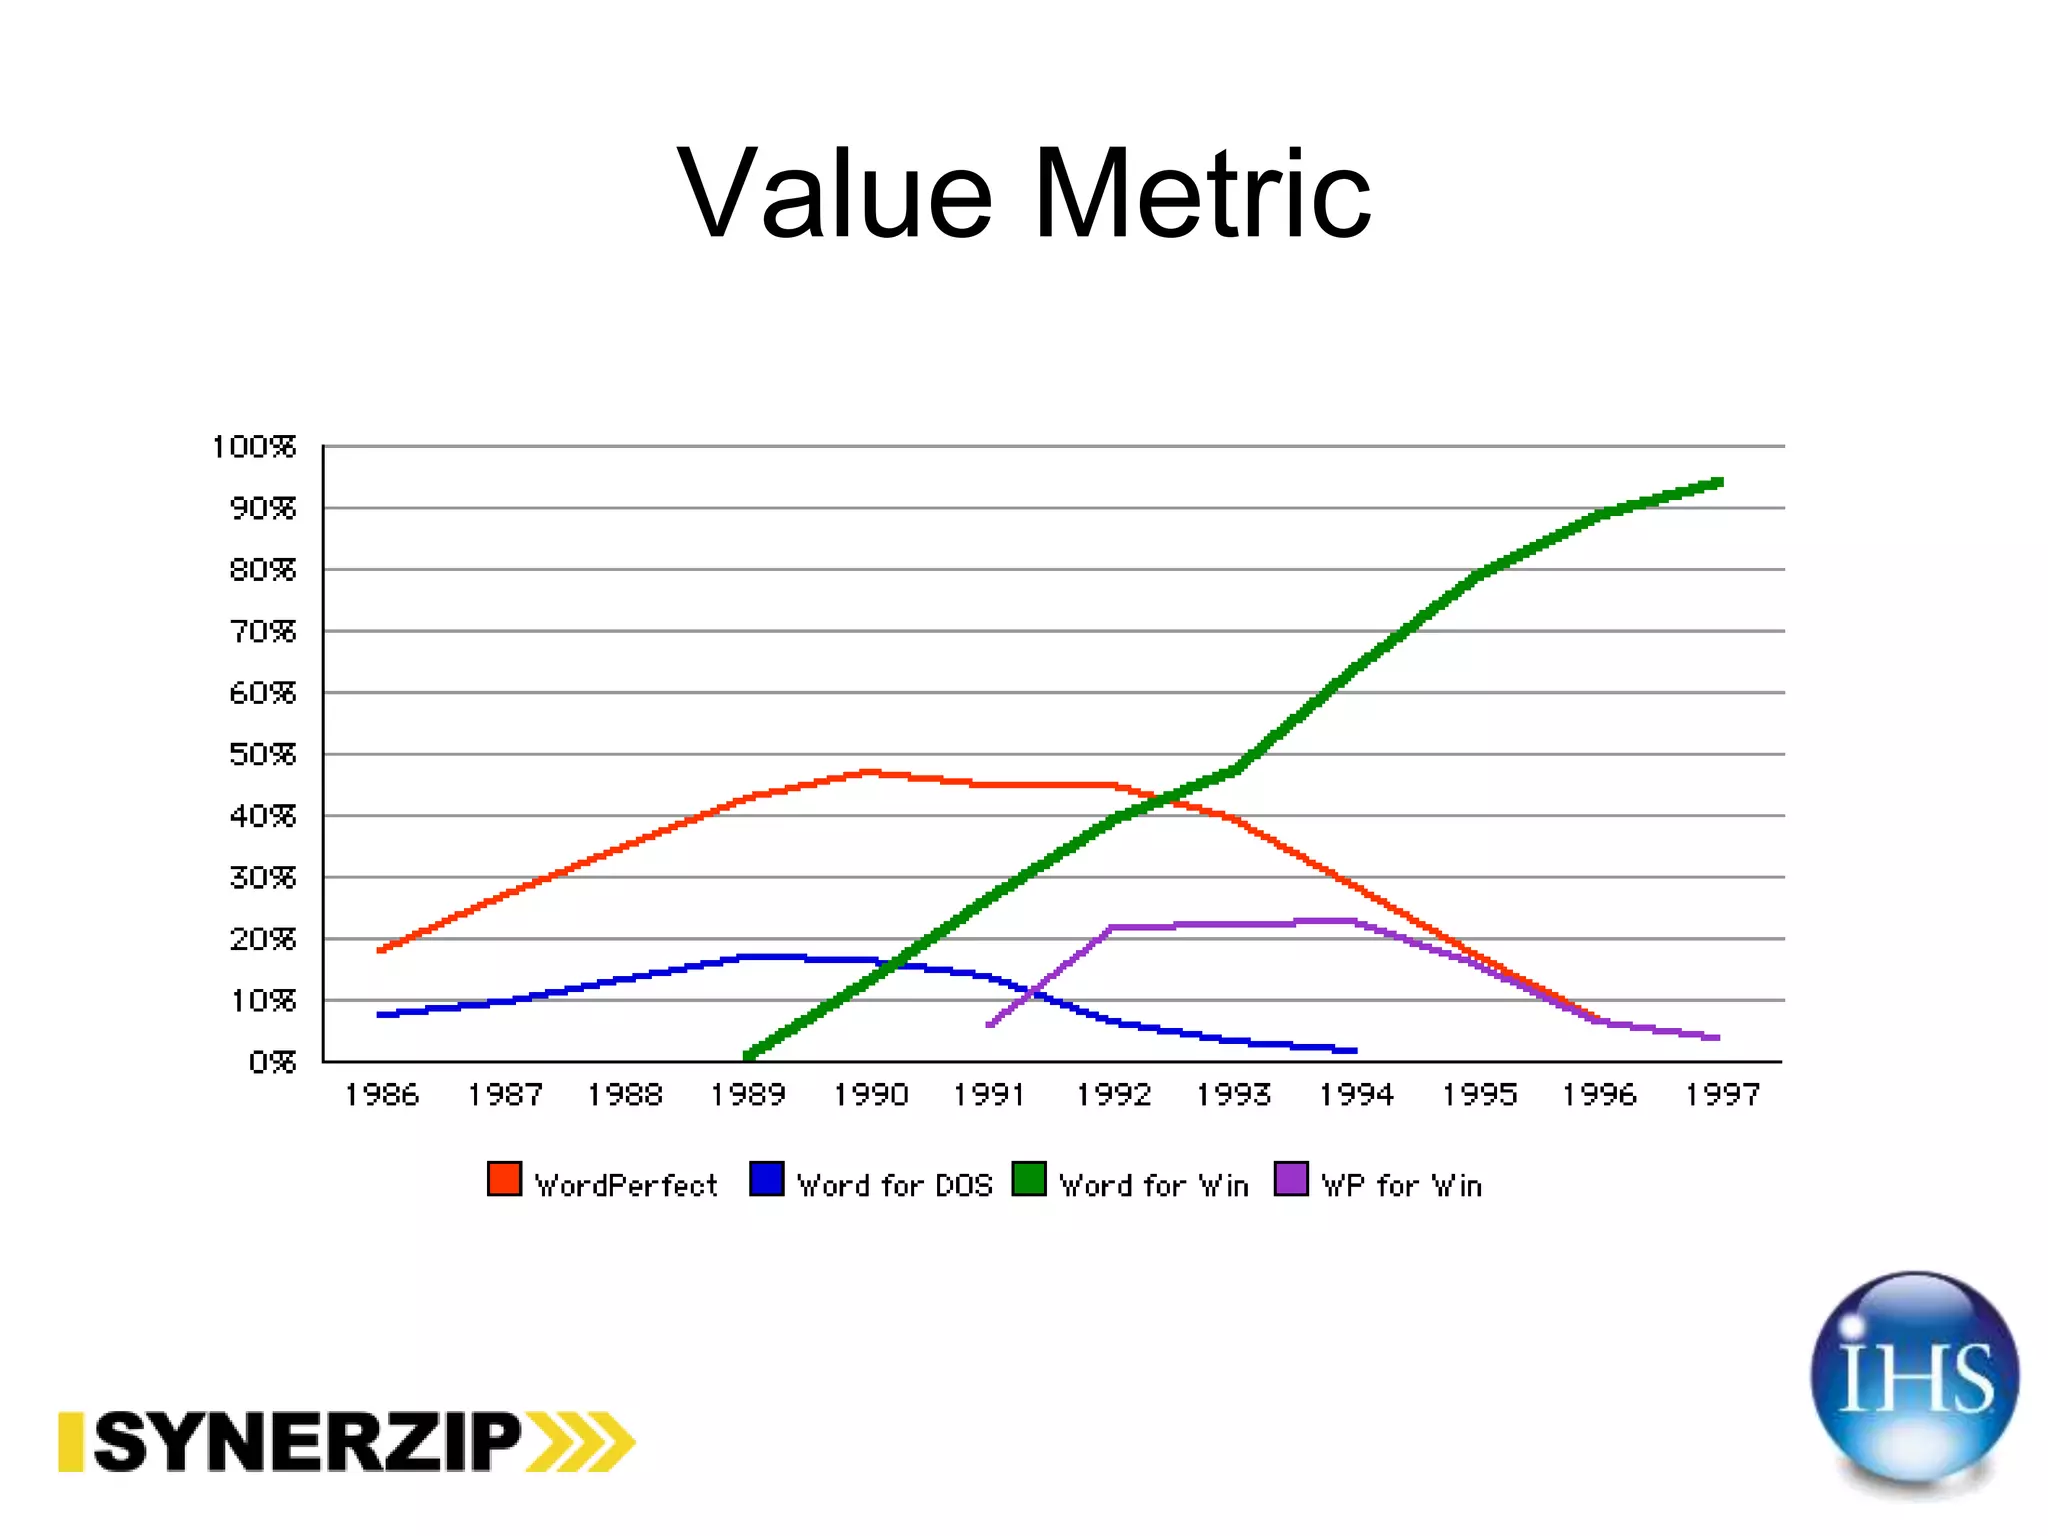
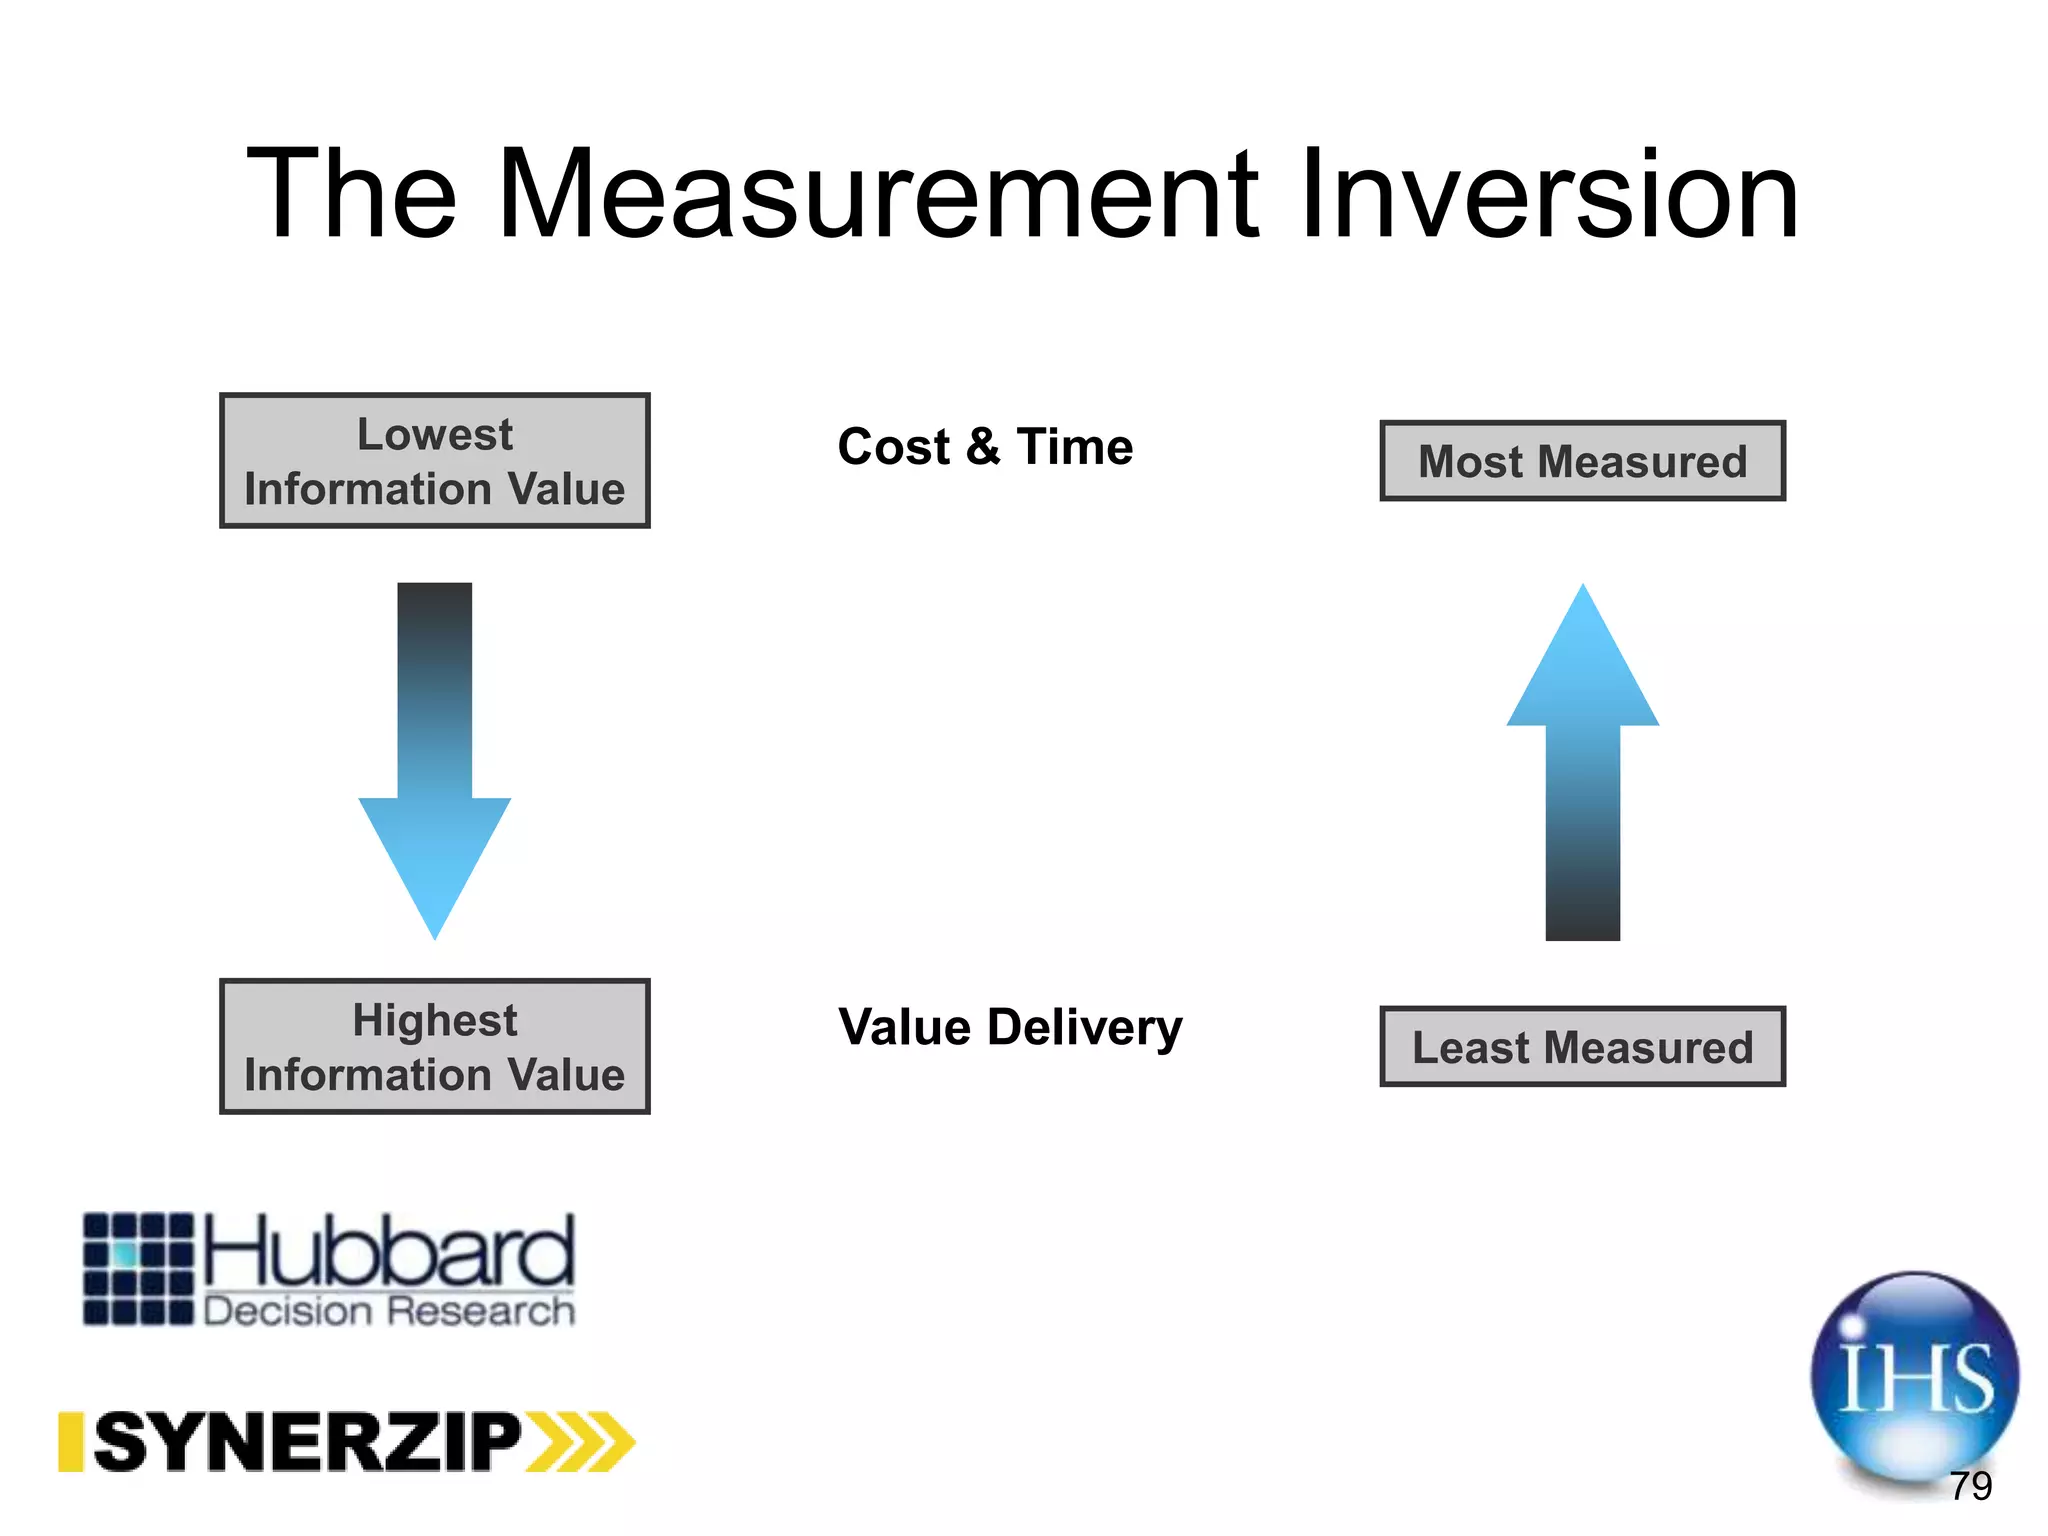

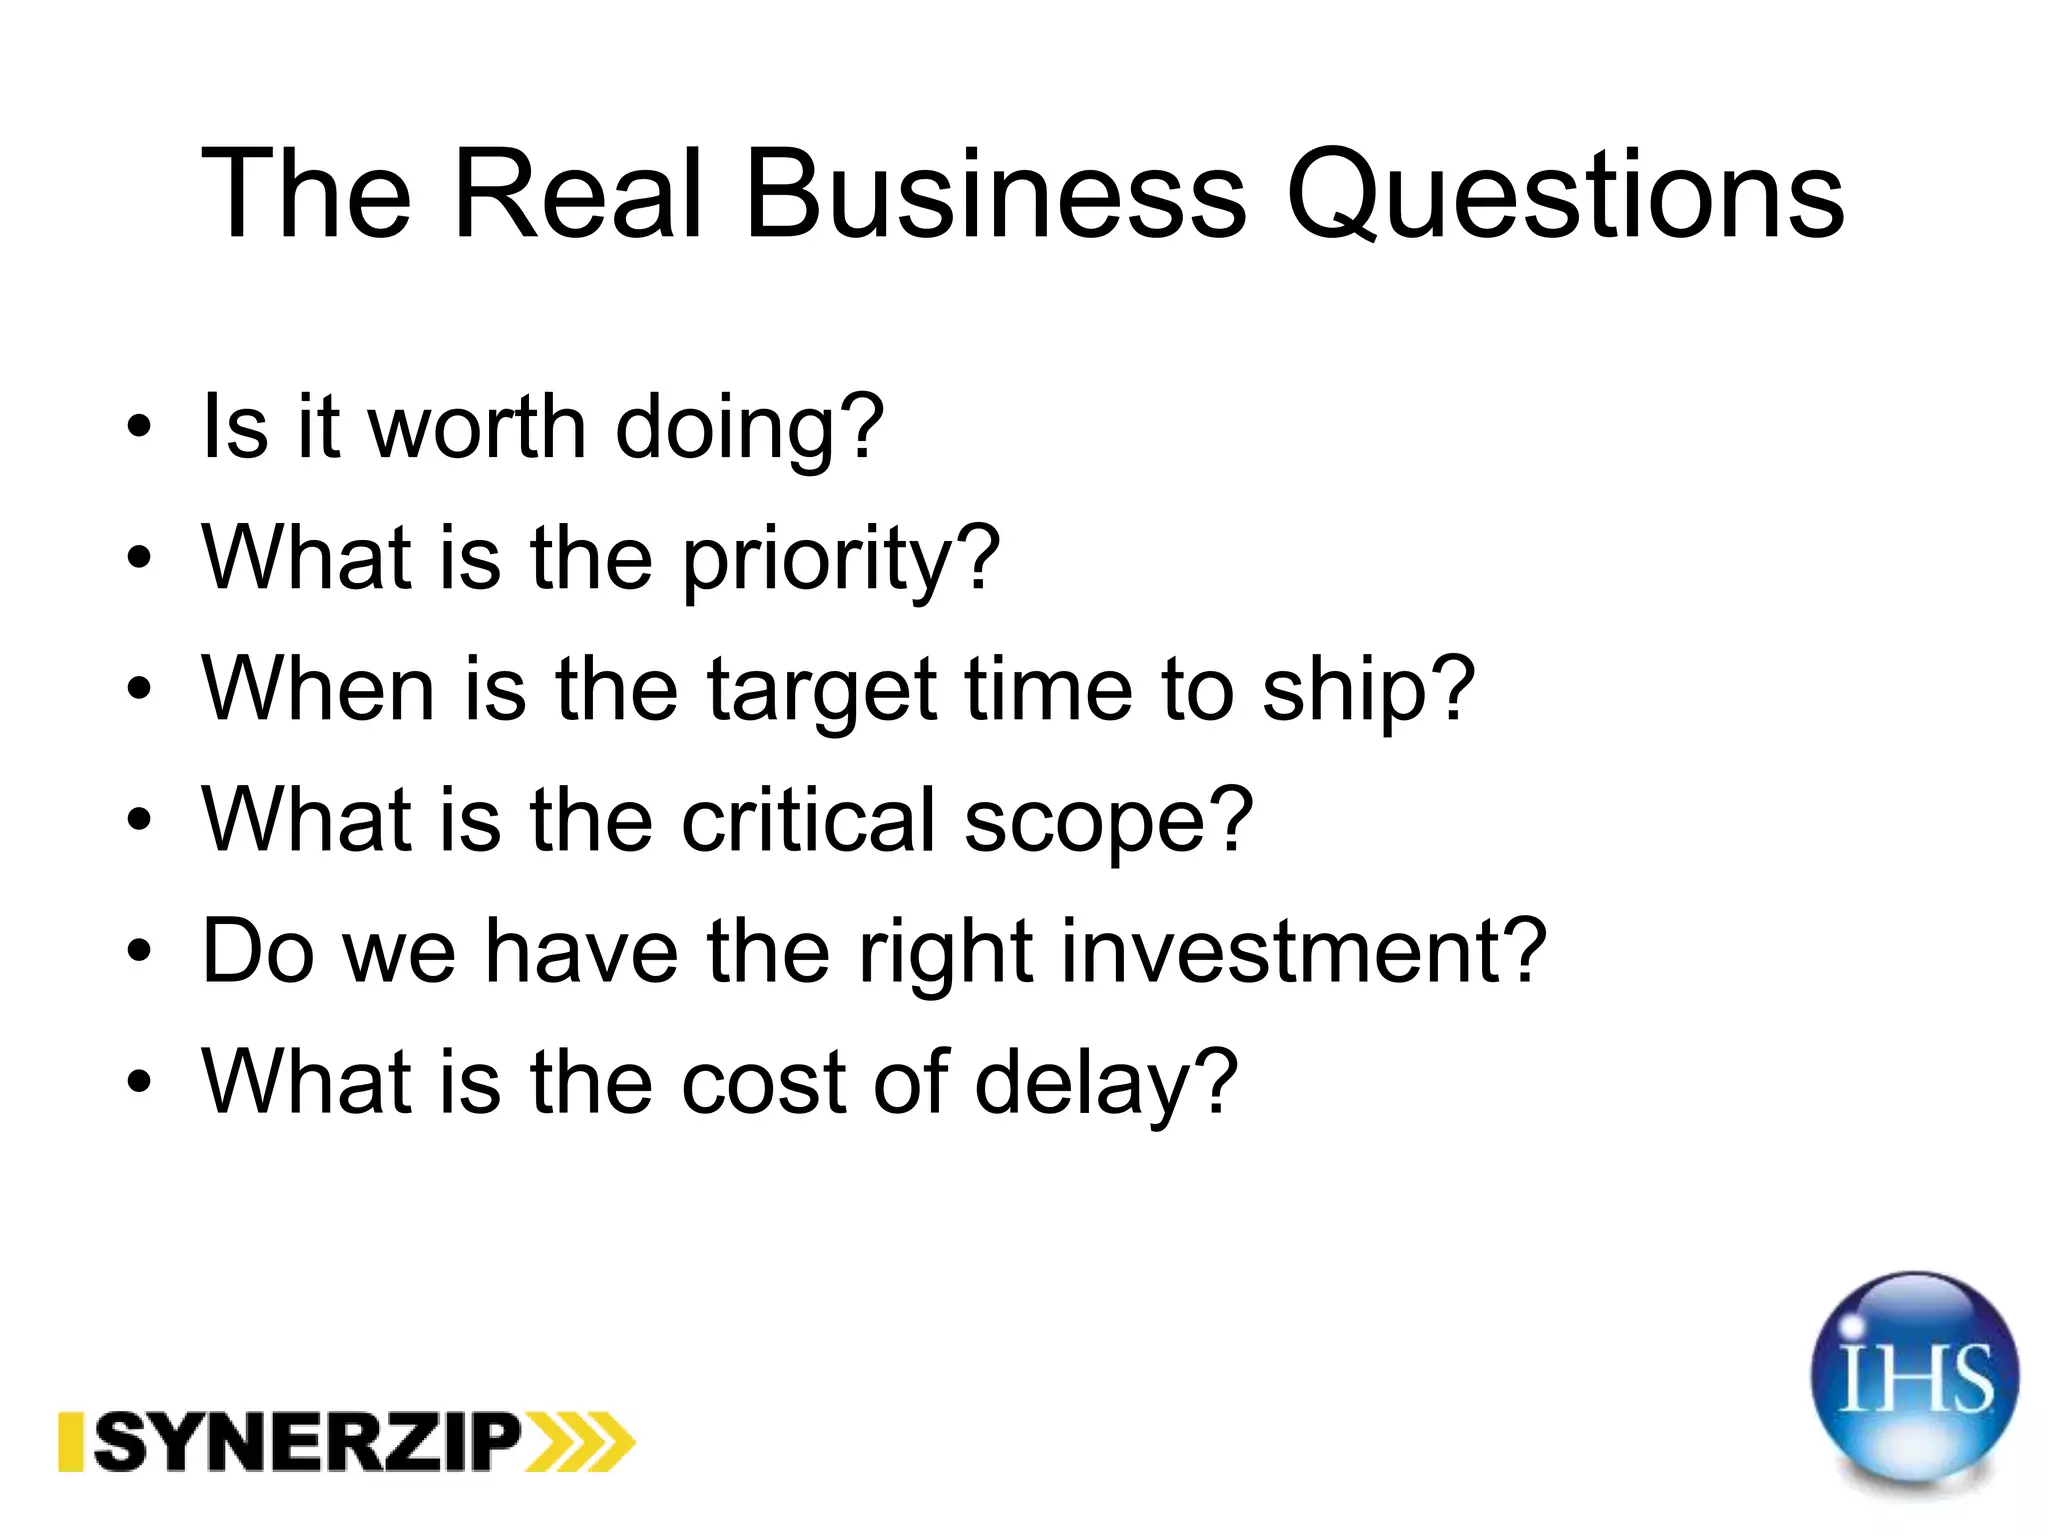

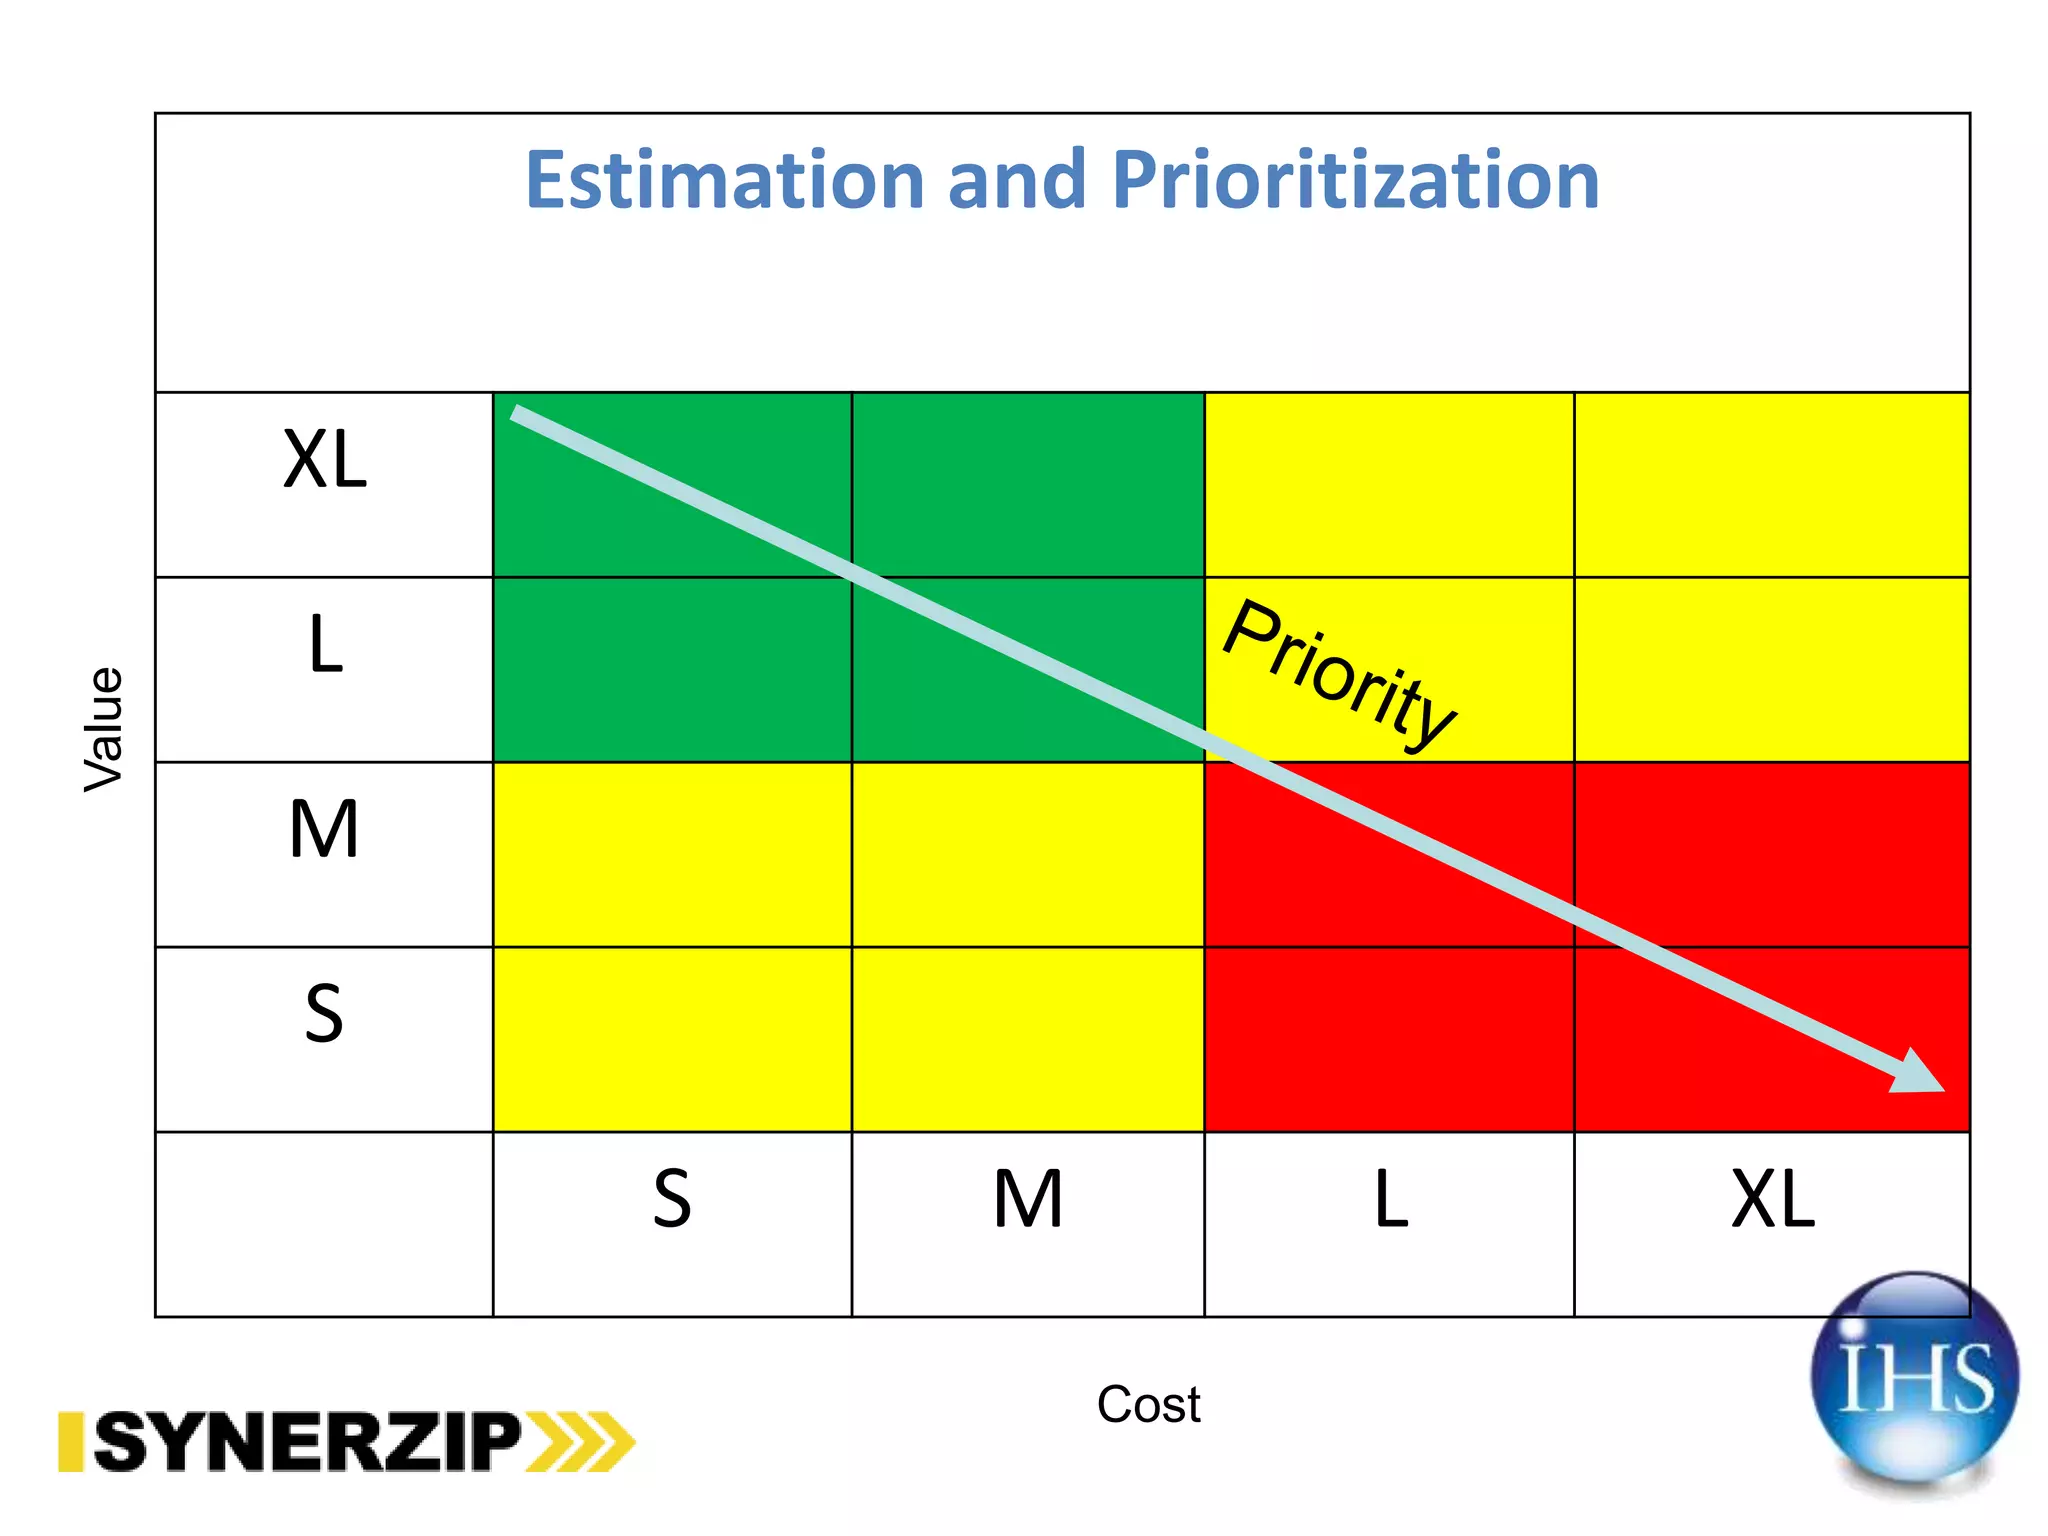
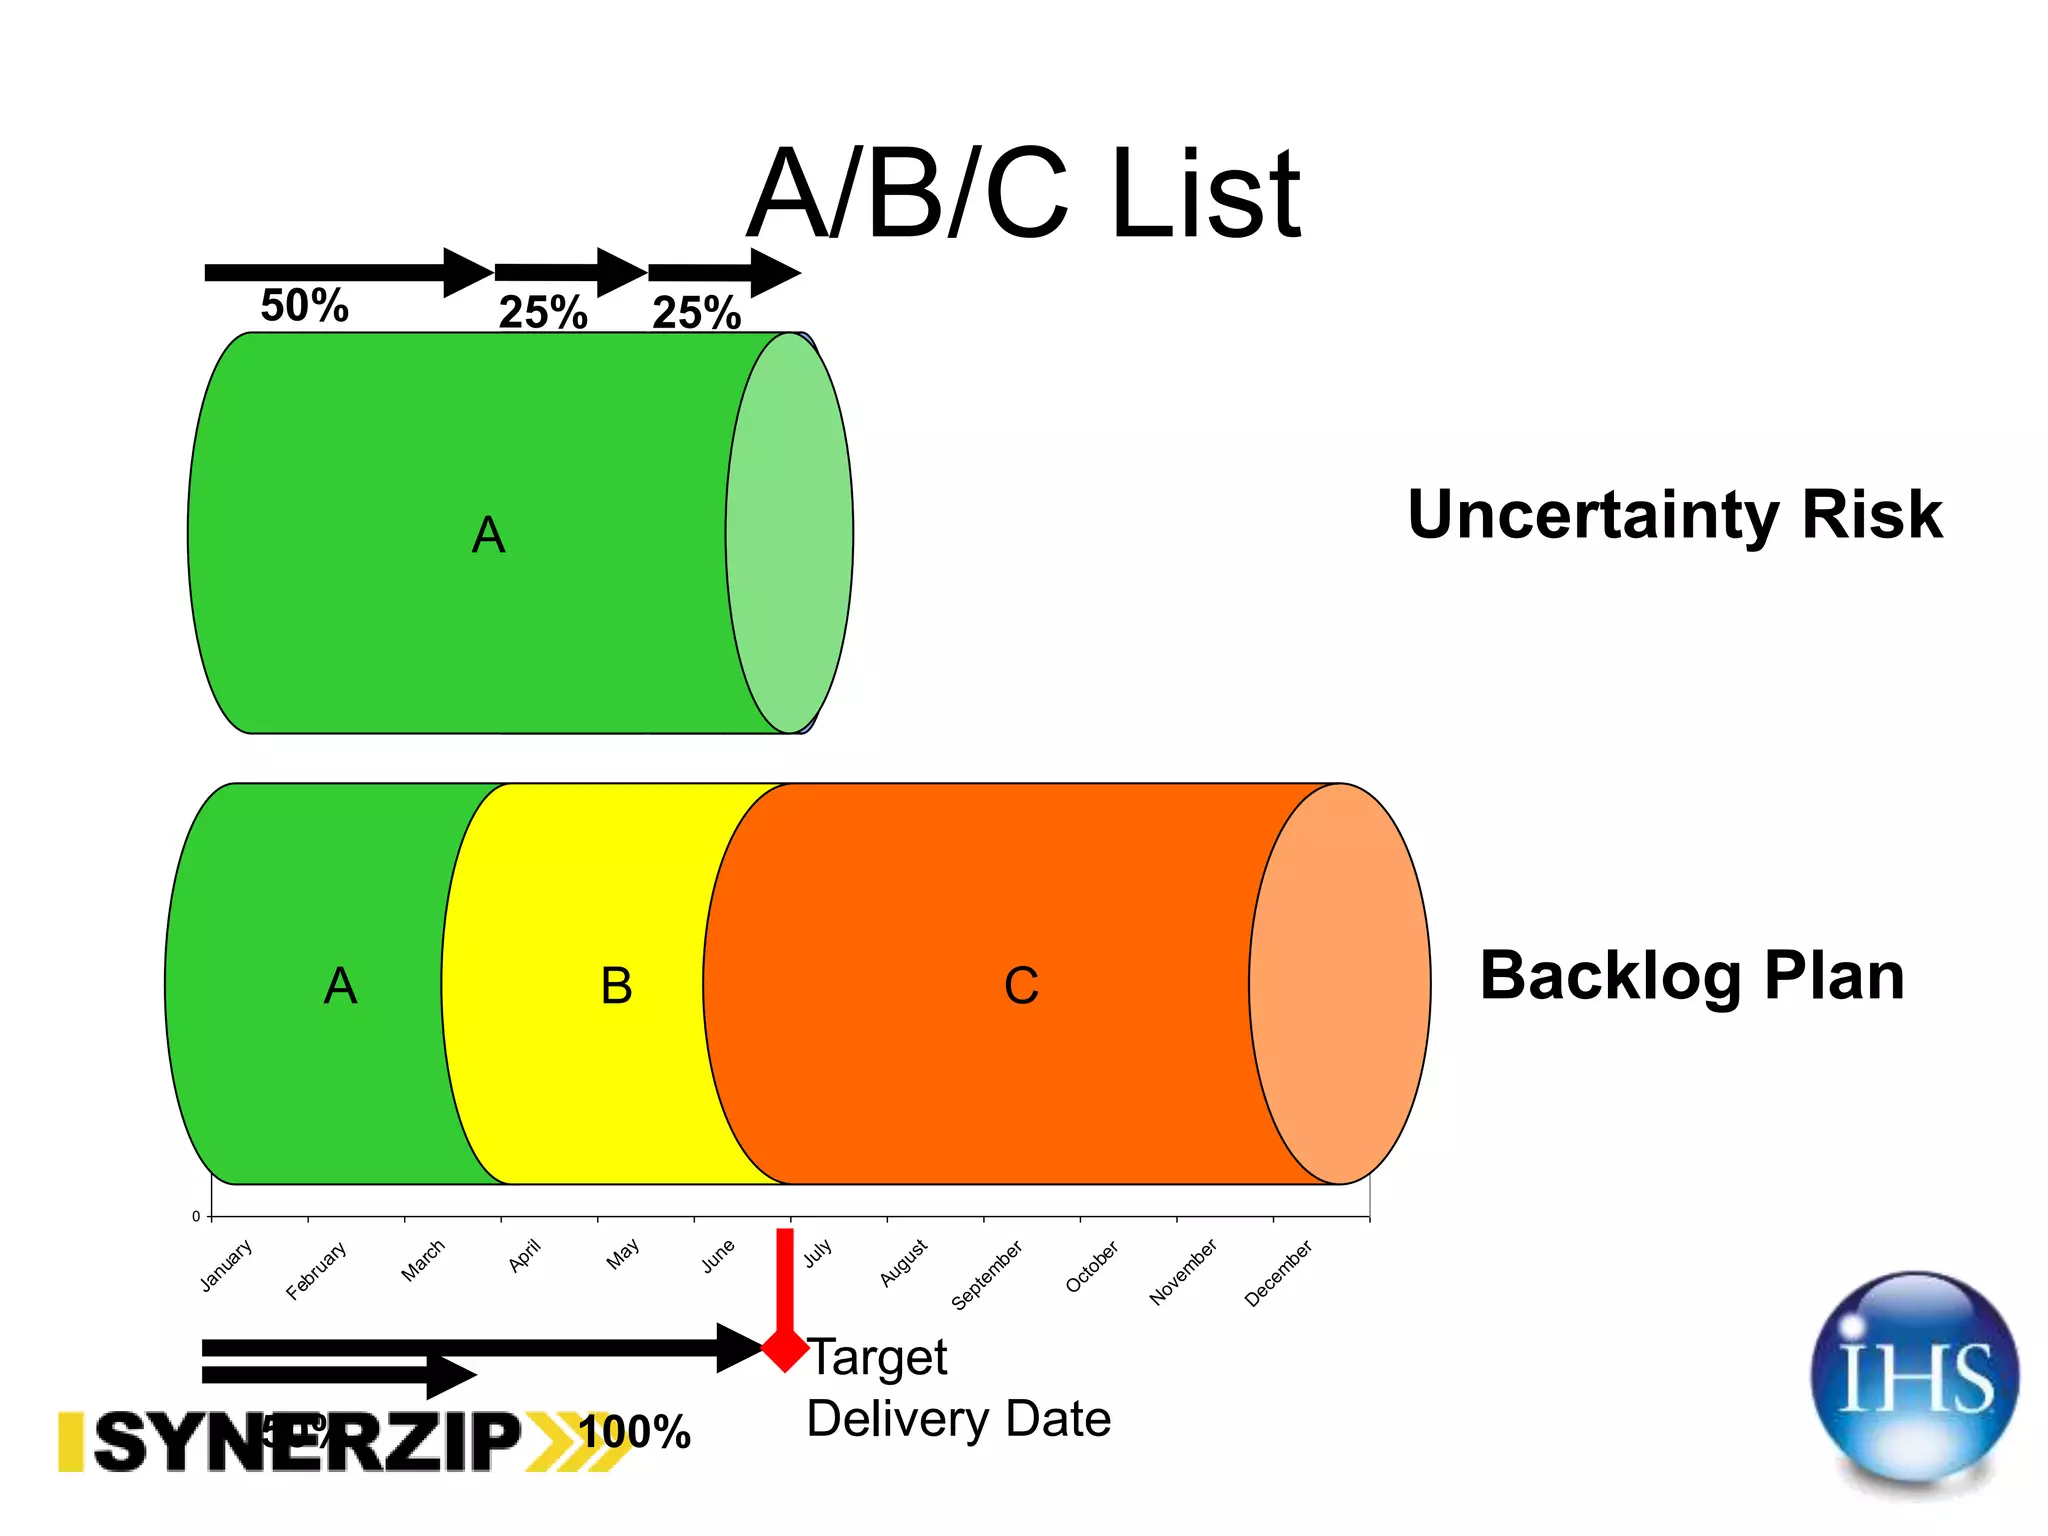
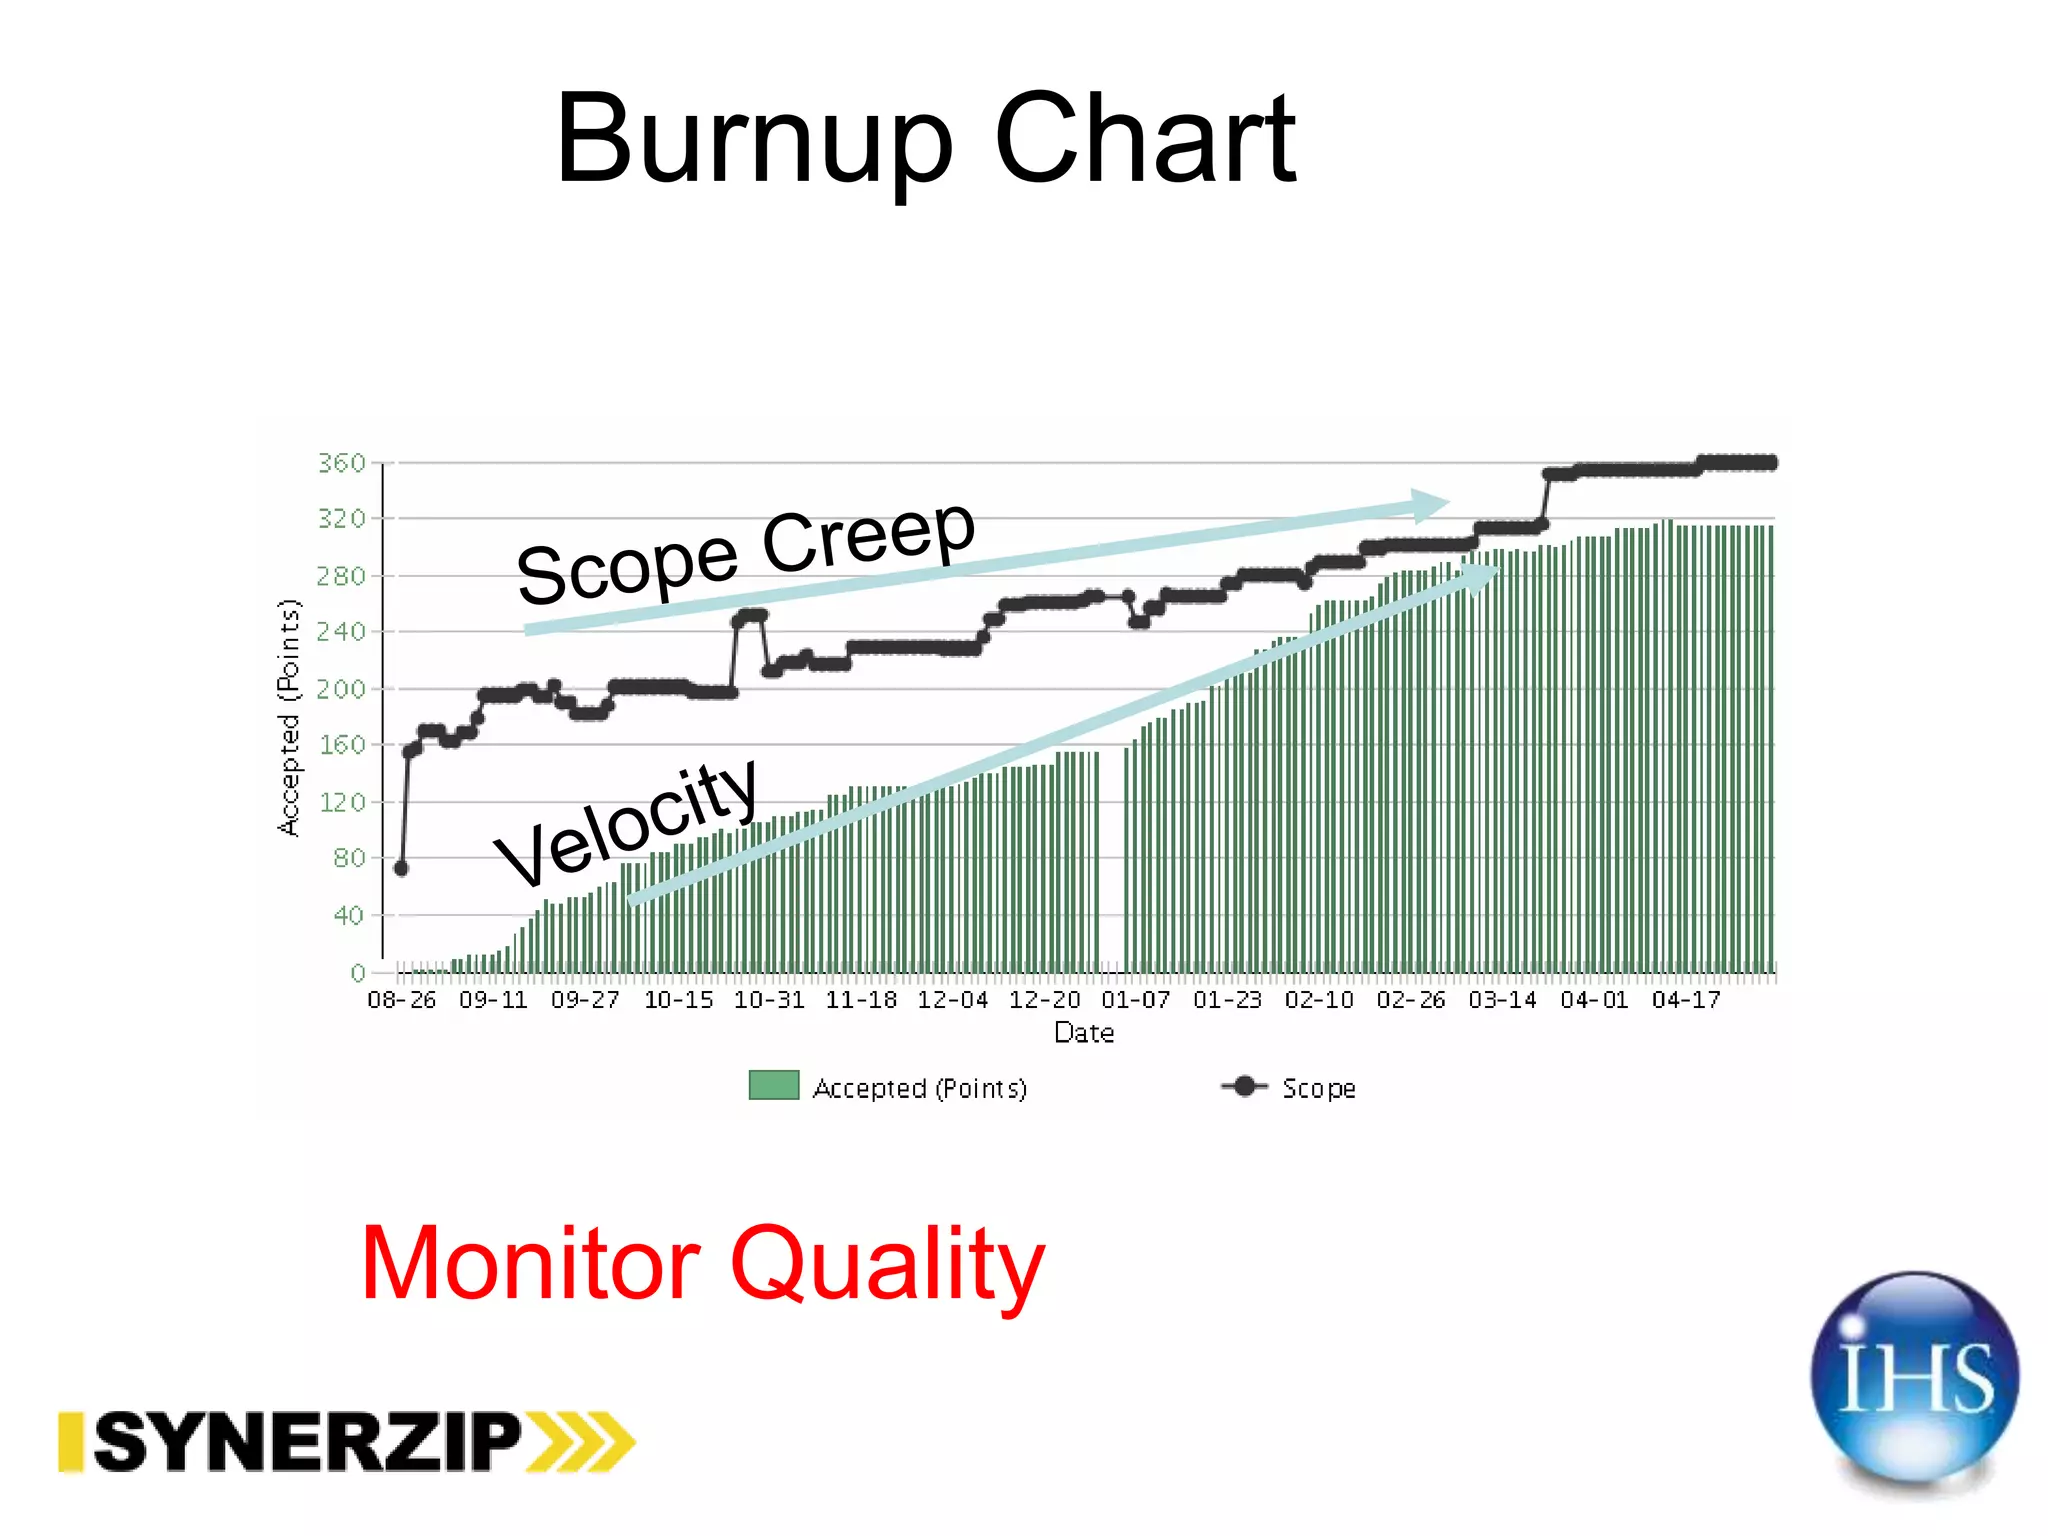
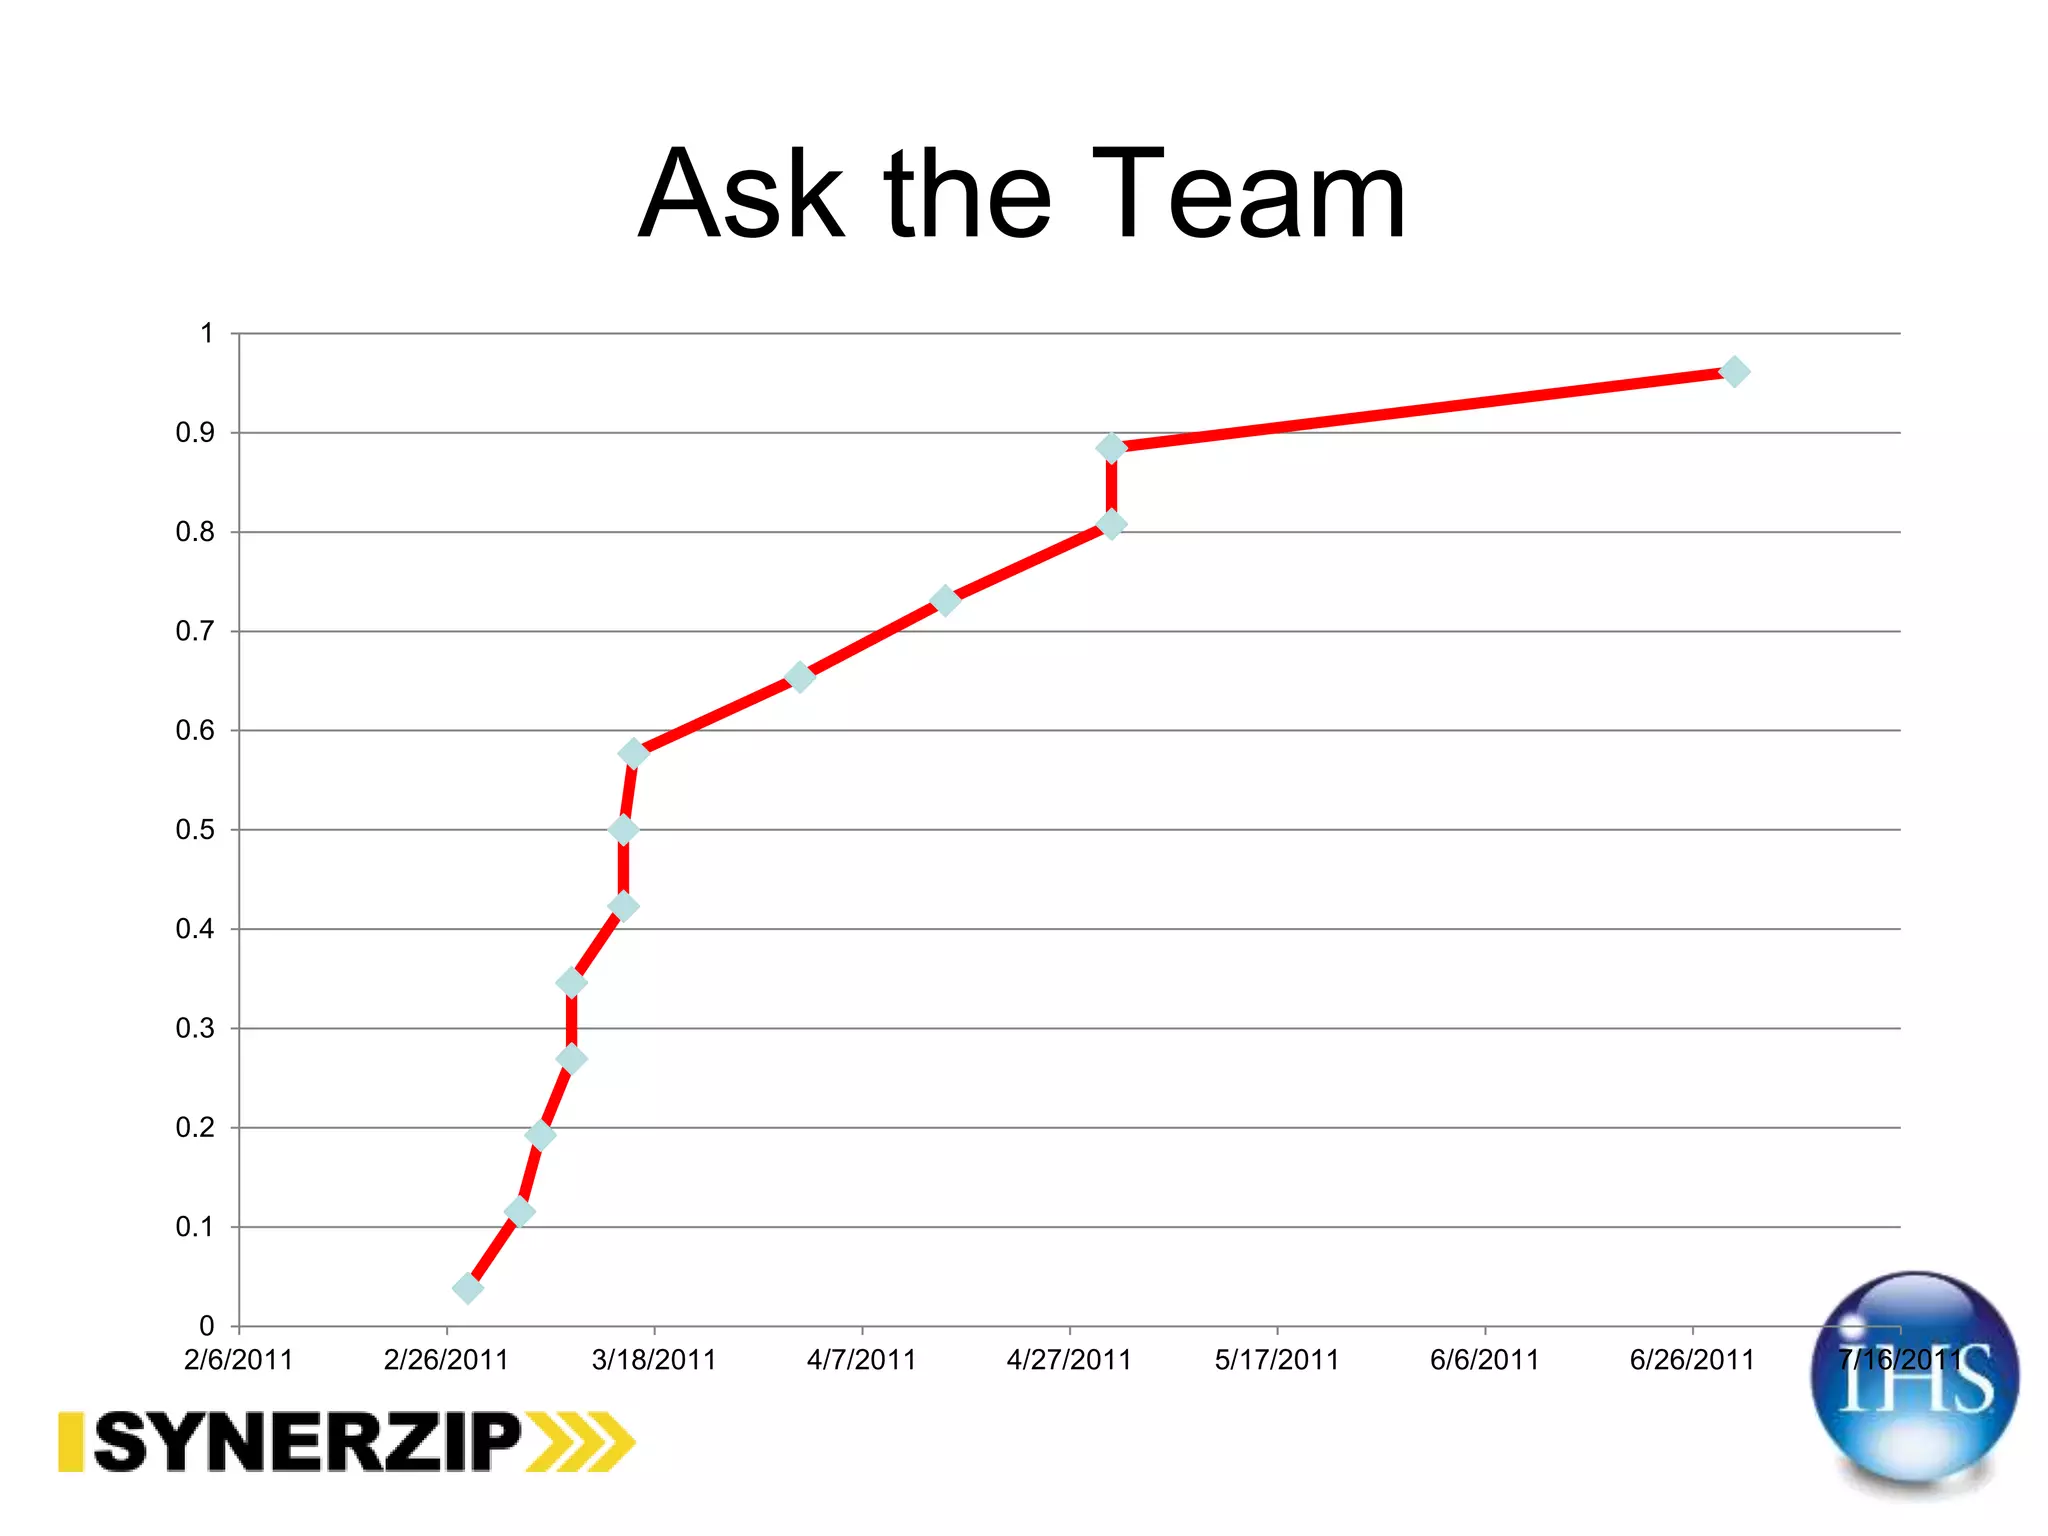


The document discusses various challenges and biases in software project estimation, highlighting that estimation accuracy improves as projects progress and that including more estimators can enhance accuracy. Key points include the impacts of scope creep, the importance of on-time delivery for project success, and how estimation can often be viewed as waste. It also suggests using tools like velocity for adjusting estimates and emphasizes the need for effective prioritization in project management.


