Electrical & Energy Audit 22 Nov.pptx
•Download as PPTX, PDF•
0 likes•23 views

Electrical and Energy Audit performs in order to apply safety procedure to electrical distribution network along with energy saving protocol in order to reduce the carbon foot print. Energy efficiency solution is required to control the consumption of electricity thus reduce the dependence on fossil fuel usage and economy import policy f fossil fuel.

Recommended
Recommended
More Related Content
Similar to Electrical & Energy Audit 22 Nov.pptx
Similar to Electrical & Energy Audit 22 Nov.pptx (20)
More from Syed Atif Naseem
More from Syed Atif Naseem (20)
Recently uploaded
Recently uploaded (20)
Electrical & Energy Audit 22 Nov.pptx
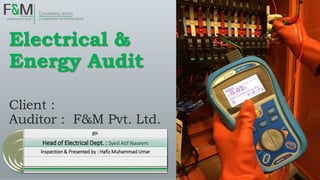
- 1. Electrical & Energy Audit Client : Auditor : F&M Pvt. Ltd. BY- Head of Electrical Dept. : Syed Atif Naseem Inspection & Presented by : Hafiz Muhammad Umar
- 2. F&M Pvt. Ltd. Introduction “F&M was established with the aim to provide one window solutions for the Industries of Pakistan with respect to international codes and standards, quality, and integrity. We are committed and determined to deliver innovative services and solutions that will assist our customers to accomplish their goals.” MANAGING DIRECTOR: SYED FARUKH MAZHAR
- 4. Electrical Audit & Standard “An electrical audit is completed at an industry or commercial building to determine its electrical efficiency. Simply put, electrical efficiency means using less energy to do the same job. The audit will provide you with complete electricity consumption and electrical efficiency assessment.” Standard that we follow: •IEC 61439, 60364-6 (Visual Inspection / Earthing) •NFPA 70 E (Electrical Safety Audit) •ASTM E 1934/37 (Thermography) •BS-767 (Load Management) •NETA/ANSI (Insulation Resistance Test)
- 5. “Visual Inspection” Visual inspection of MD’S is conducted based on IEC 61439, 60364-6 Observations •SMDB-1-B must be maintained / rectify on urgent basis. •Cable tray must be cover properly. •MDB-10, SMDB-12, MDB-14, SMDB-19 and SMDB-1-B are critical DB’s Recommendations These DBs need to rectify on an urgent basis.
- 6. “Earth Testing” “Earthing audit is conducted to ensures the good health of the complete Earthing system. It is imperative that the Earthing system is inspected periodically to ensure efficiency. Observations • Earthing required in Electrical Panels. • More than 5 ohms resistance of earth found on various DB’S. • Total of 26 DBs were not lying in an acceptable range •Recommendations. Need to rectify the earthing issue as early as possible.
- 7. “Thermography” “Thermography is the process of using an infrared camera to look for abnormally hot or cold areas on a component operating under normal conditions. It is a viable nondestructive evaluation technique and is the simplest of all thermal inspection techniques”. Observations • 5 DB’s are lying in Moderate category which are unsatisfactory. • DB’s have overloaded circuits & equipment. • Due to looseness or overload of circuit, Electrical Fire can erupt. Recommendation 5*DB lies in Moderate category. It is requires to shift the load on particular DB’s in order to lower the temperature in a safe zone.
- 8. “Lux Calculation” “Lighting systems present opportunities to reduce electric cost. Lighting systems include all the equipment required for the provision of, offices area, Corridor, Lift Area, etc. including fixtures and luminaries for light distribution of the light source and associated controls.”. Observations • Lux level at few locations is greater than the standard value, so it is recommended to reduce Lux level •Recommendation Near lift the lux value is greater than the required value so it is recommended to reduce lux level.
- 9. Energy Audit
- 10. “Analysis” ENERGY CONSUMPTION Energy consumption pattern can be clearly seen in period of Jan 2022 – Sep 2022. Their consumption is about 500 MWh in starting of the year but increases gradually as summer season goes up in 2022 and consumption reached about 800MWh.
- 11. “Analysis” LOAD FACTOR Using the data extracted from electricity bill, monthly load factor profiles for 9 months were generated as shown in Figure 7. Load factor is satisfactory as it is calculated on 24 hour and Ocean Mall peak operation time is not 24 hours.
- 12. “Analysis” MAXIMUM DEMAND & SANCTIONED LOAD •Maximum Demand (MD) is an important parameter as fixed charges are calculated on it. Billing demand means the highest of maximum demand recorded in a month. MDI stands for Maximum Demand Indicator which means the maximum energy utilization in the given month. •As we can see the trends of 9-month data, we have found out that Sanctioned load is approximately double than the MD, so by reducing sanctioned load we can save fixed charges from K.E. For more detail we have provided a link in an energy audit report.
- 13. “IEEE-519 Standard” CURRENT DISTORTION LIMITS FOR GENERAL DISTRIBUTION SYSTEMS (120 V THROUGH 69000 V) As for the reference of current harmonic limit, you can see below table.
- 14. “Analysis” TDD OF TX1 IEEE-519 states that harmonic amount can be measure in terms of TDD on the contrary THD represent harmonic content w.r.t load, as we can clearly see that total demand distortion (TDD) of phases (A, B, C) are above the limit. According to the IEEE Std. 519 (see Table), recommended TDD based on Isc/IL is 15.
- 15. “Analysis” TDD OF TX2 As we can clearly see that total demand distortion (TDD) of phases (A, B, C) are nearly close to exceed the limit. According to the IEEE Std. 519 (see Table), recommended TDD based on Isc/IL is 15.
- 16. “Analysis” IMPACT OF HARMONICS DUE TO VFD ON 40 HZ & 50 HZ As we can clearly see that the harmonics on each phase is working as a filter for harmonics on other two phases in 50 Hz case and also we can see that harmonics are present on each phases at 40 Hz & 50 Hz condition.
- 17. “Analysis” IMPACT OF HARMONICS WITH VFD & WITHOUT VFD (POWER SUPPLY) •From table we can see that, by using a VFD harmonics were present on each phase which clarifies that the harmonics were generated by using a VFD. •By using direct power supply we do not have any harmonics at any phase, but we have harmonics on neutral which clearly indicates that harmonics were present in a Network.
- 18. “Analysis” CASE STUDY We have performed a simulation on VFD to reduce harmonics, and during the case study we have found out that by using a 24 pulse filter we can reduce the significant amount harmonics as well as we can save apparent power of 3.7kVA, results of case study were on next slide.
- 19. “Analysis” RESULTS OF CASE STUDY
- 20. “Analysis” TRANSFORMERS ARE AT UNDER-LOADING This was found that transformers are operating at highly under-loaded conditions. A transformer gives maximum efficiency when iron losses equal to the copper losses. This is critical, lower loading in a transformer result in poor efficiency. Furthermore, these losses are not accountable in LT panels meter and only recorded in KE-meter. Scenario: If we use only 1 transformer to diminish the under-loading, then 2nd transformer were operating on no load condition and when the transformer is operating at no load we have no load loses in a transformer, so we can conclude that we have only one solution which is to increase the load on each transformer.
- 21. “Savings” Description Savings in PKR (Monthly) 1. By installing AHF 3% to 5% of electricity bill saving can be achieve 2. Fixed cost will save by reducing sanctioned load - Total Estimated Saving Per Month Approximately 1.2million
- 22. Thank you!