SlideShare a Scribd company logo
1 of 6
Suguru Taga<br />IB Biology HL 2, P4<br />Mr. Stantus<br />January 19, 2011<br />Mangrove Ecosystems At Kung Kraben Bay<br />Introduction:<br />This lab report is about the study of mangrove ecosystem at Chantaburi (Kung Kraben Bay), Thailand. The data was collected at mangrove at night, using quadrants by making a 25 meters straight line towards the sea and within that line at every 5 meters, both biotic and abiotic data were collected.<br />Data Collection:<br />Picture 1: This is a picture at the mangrove. As from the picture, the site is muddy and the white mangrove’s roots sticking out of the mud. <br />Picture 2: This picture shows how the data collection was done. As from the picture, four quadrants were used for data collection and the organisms that were seen in the quadrants were recorded.<br />Organisms and Abiotic Factors<br />Table 1: This table shows both organisms observed at the mangrove and abiotic factors. As from the table the pH and the temperature has not changed, but the number of organisms increased as it moved towards that sea.<br />Qualitative Data:<br />At the mangroves two different types of mangroves were observed, one with roots shooting out from the ground like a needle (pencil roots) and one with root that has several branched roots (prop roots). The mud (ground) was mostly gray and dry, but when the foot was taken out of the ground redish brown color soil with water coming from the ground was observed. The place was very dark that without the flash light, it is hard to even see. The organisms were usually in the mud than out in the surface so not many organisms were observed as from table 1. Also, there were only little organisms and not big ones like fish or lobster. While the observations there were poping sound like pop corn and according to the rangers it was the sound of shrimp jumping. While walking on the board walk the mangroves were densely close to each other, but towards the sea the number of mangroves got less dense. <br />Data Processing and Presentation:<br />Graph 1: This graph shows the average number of organisms that were observed during data collection. As from the graph almost none of crabs were observed but many crab holes were founded about 27 in an average. Also almost none of the worms were found either. Lastly, in an average about 4 of snails were found.<br />Calculations (Mangrove):<br />D=N(N-1)n(n-1)<br />D=Simpson’s Index<br />N=total number of organisms<br />n=number of organisms of a species<br />From Table 1:<br />N=((total # of crabs)+ (total # of crab holes)+(total # of snails)+(total # of worms))<br />  =1+136+20+1<br />  =158<br />N(N-1)=158(158-1)<br />      =158(157)<br />      =24806<br />Crabs:<br />n= (0 meter) + (5 meters) + (10 meters) + (15 meters) + (20 meters)<br /> = 1+0+0+0+0<br /> = 1<br />n(n-1) =1(1-1)<br />      =1(0)<br />      =0<br />Crab Holes:<br />n= (0 meter) + (5 meters) + (10 meters) + (15 meters) + (20 meters)<br /> = 22+27+20+47+20<br /> = 136<br />n(n-1)= 136(136-1)<br />     = 136(135)<br />     = 18360<br />Snails:<br />n= (0 meter) + (5 meters) + (10 meters) + (15 meters) + (20 meters)<br /> = 0+2+0+8+10<br /> = 20<br />n(n-1)= 20(20-1)<br />     = 20(19)<br />     = 380<br />Worms:<br />n= (0 meter) + (5 meters) + (10 meters) + (15 meters) + (20 meters)<br /> =0+0+0+0+1<br /> =1<br />n(n-1)= 1(1-1)<br />     = 1(0)<br />     = 0<br />Simpson Index (Mangrove):<br />D=N(N-1)n(n-1)<br />D = 248060+18360+380+0<br />D= 2480618740<br />D= 1.323692636<br />D≈1.32<br />Simpson Index of other group (Rocky Shore):<br />D=4.60687<br />D≈4.61<br />Conclusion and Evaluation:<br />This lab is about the data collected at mangrove. As from table 1, only one crab, 136 crab holes, 20 snails, and only one worm were observed during the data collection. It is surprising that 136 crab holes were found but only one crab was found. Also, pH of 7.5 and 25 ℃ were constant along the 20 meters. There were not any connections between the biotic factors and the abiotic factors found. However, since the data collection took place at night, most of the organisms were sleeping and not many organisms were found. The Simpson index for mangrove was about 1.32 and the Simpson index for rocky shore was about 4.61. These two numbers shows that at the rocky shore, more organisms were found and fewer organisms were found at the mangrove. The time of the data collection made the difference in Simpsons because at the rocky shore the data collection was during the day time but the data collection at the mangrove took place at night. So, the organisms at mangrove might have been asleep and hiding.<br />The weaknesses during the data collection were the time of the data collection and the data was collected at a place where the mud was ruined by human. The data at the mangrove was at night so the organisms were not active like in the day time so not many organisms were found. Therefore, the data collection should have been taken at around the same period of time during day time so that most of the organisms are active and found more easily. Lastly, when other groups got off to the mud and walking around, the ground became ruined and many holes were made which might have destroyed the number of the crab holes. Also, because the ground was ruined, the organisms might have got scared and went away. For improvement, the data could be collected where people have not stepped on the ground so that the more accurate number of organisms could be recoreded.  <br />
Mangrove ecosystem
Mangrove ecosystem
Mangrove ecosystem
Mangrove ecosystem
Mangrove ecosystem

More Related Content

Viewers also liked

Enhancing the Resilience of Coastal Wetlands to Promote Sustainable Livelihoo...
Enhancing the Resilience of Coastal Wetlands to Promote Sustainable Livelihoo...Enhancing the Resilience of Coastal Wetlands to Promote Sustainable Livelihoo...
Enhancing the Resilience of Coastal Wetlands to Promote Sustainable Livelihoo...CIFOR-ICRAF
 
Climate Change Adaptation and Mitigation Through Mangrove Conservation and Re...
Climate Change Adaptation and Mitigation Through Mangrove Conservation and Re...Climate Change Adaptation and Mitigation Through Mangrove Conservation and Re...
Climate Change Adaptation and Mitigation Through Mangrove Conservation and Re...Wetlands International
 
mangrove manual_combied
mangrove manual_combiedmangrove manual_combied
mangrove manual_combiedTraceyEdwards
 
Mangroves as coastal defence
Mangroves as coastal defenceMangroves as coastal defence
Mangroves as coastal defenceRahul5110
 
Generating income from mangroves through climate change mitigation
Generating income from mangroves through climate change mitigationGenerating income from mangroves through climate change mitigation
Generating income from mangroves through climate change mitigationCIFOR-ICRAF
 
Hk mangrove ecosystem
Hk mangrove ecosystemHk mangrove ecosystem
Hk mangrove ecosystemgnimkowk
 
Mangrove field guide
Mangrove field guideMangrove field guide
Mangrove field guideTong Sandoval
 
Ecology Abiotic Factors, Light, Animals and Plants Lesson PowerPoint
Ecology Abiotic Factors, Light, Animals and Plants Lesson PowerPointEcology Abiotic Factors, Light, Animals and Plants Lesson PowerPoint
Ecology Abiotic Factors, Light, Animals and Plants Lesson PowerPointwww.sciencepowerpoint.com
 
Mangrove ecosystem
Mangrove ecosystemMangrove ecosystem
Mangrove ecosystemRaheem P K
 
natural vegetation and wildlife
natural vegetation and wildlifenatural vegetation and wildlife
natural vegetation and wildlifeChinmaya Pattnaik
 
Natural vegetation and wildlife
Natural vegetation and wildlifeNatural vegetation and wildlife
Natural vegetation and wildlifeparas3
 
Power point presentation on protection of mangroves from destruction and degr...
Power point presentation on protection of mangroves from destruction and degr...Power point presentation on protection of mangroves from destruction and degr...
Power point presentation on protection of mangroves from destruction and degr...Navanitha Warrier
 
Mangrove ecosystem
Mangrove ecosystemMangrove ecosystem
Mangrove ecosystemaizadhassan
 

Viewers also liked (17)

Enhancing the Resilience of Coastal Wetlands to Promote Sustainable Livelihoo...
Enhancing the Resilience of Coastal Wetlands to Promote Sustainable Livelihoo...Enhancing the Resilience of Coastal Wetlands to Promote Sustainable Livelihoo...
Enhancing the Resilience of Coastal Wetlands to Promote Sustainable Livelihoo...
 
Natural Capital: Counting it in!
Natural Capital: Counting it in! Natural Capital: Counting it in!
Natural Capital: Counting it in!
 
Climate Change Adaptation and Mitigation Through Mangrove Conservation and Re...
Climate Change Adaptation and Mitigation Through Mangrove Conservation and Re...Climate Change Adaptation and Mitigation Through Mangrove Conservation and Re...
Climate Change Adaptation and Mitigation Through Mangrove Conservation and Re...
 
mangrove manual_combied
mangrove manual_combiedmangrove manual_combied
mangrove manual_combied
 
Mangroves as coastal defence
Mangroves as coastal defenceMangroves as coastal defence
Mangroves as coastal defence
 
Generating income from mangroves through climate change mitigation
Generating income from mangroves through climate change mitigationGenerating income from mangroves through climate change mitigation
Generating income from mangroves through climate change mitigation
 
Hk mangrove ecosystem
Hk mangrove ecosystemHk mangrove ecosystem
Hk mangrove ecosystem
 
Mangrove field guide
Mangrove field guideMangrove field guide
Mangrove field guide
 
Mangroves
MangrovesMangroves
Mangroves
 
Ecology Abiotic Factors, Light, Animals and Plants Lesson PowerPoint
Ecology Abiotic Factors, Light, Animals and Plants Lesson PowerPointEcology Abiotic Factors, Light, Animals and Plants Lesson PowerPoint
Ecology Abiotic Factors, Light, Animals and Plants Lesson PowerPoint
 
Mangrove ecosystem
Mangrove ecosystemMangrove ecosystem
Mangrove ecosystem
 
natural vegetation and wildlife
natural vegetation and wildlifenatural vegetation and wildlife
natural vegetation and wildlife
 
Living organisms & their surroundings
 Living organisms & their surroundings Living organisms & their surroundings
Living organisms & their surroundings
 
Natural vegetation and wildlife
Natural vegetation and wildlifeNatural vegetation and wildlife
Natural vegetation and wildlife
 
Power point presentation on protection of mangroves from destruction and degr...
Power point presentation on protection of mangroves from destruction and degr...Power point presentation on protection of mangroves from destruction and degr...
Power point presentation on protection of mangroves from destruction and degr...
 
What Are Mangroves?
What Are Mangroves? What Are Mangroves?
What Are Mangroves?
 
Mangrove ecosystem
Mangrove ecosystemMangrove ecosystem
Mangrove ecosystem
 

Similar to Mangrove ecosystem

Mercury in the Global OceanPURPOSE USE THE NEWS The followin
Mercury in the Global OceanPURPOSE USE THE NEWS The followinMercury in the Global OceanPURPOSE USE THE NEWS The followin
Mercury in the Global OceanPURPOSE USE THE NEWS The followinAbramMartino96
 
ASM Poster cd jk ma
ASM Poster cd jk maASM Poster cd jk ma
ASM Poster cd jk maJesse Kerr
 
Marine Ecology lab report sample
Marine Ecology lab report sampleMarine Ecology lab report sample
Marine Ecology lab report sampleBenjamin Gibson
 
The Cause Of The Dinosaur Extinction Essay
The Cause Of The Dinosaur Extinction EssayThe Cause Of The Dinosaur Extinction Essay
The Cause Of The Dinosaur Extinction EssayPatty Buckley
 
SCAS Poster Seagrass FINAL
SCAS Poster Seagrass FINALSCAS Poster Seagrass FINAL
SCAS Poster Seagrass FINALKali Staniec
 
GeologicalTimeline.pdf
GeologicalTimeline.pdfGeologicalTimeline.pdf
GeologicalTimeline.pdfjoyce67633
 
How much do we know - edited
How much do we know - editedHow much do we know - edited
How much do we know - editedFawad Kiyani
 
A Rapid marine biodiversity assessment of the coral reefs in morales Beach, B...
A Rapid marine biodiversity assessment of the coral reefs in morales Beach, B...A Rapid marine biodiversity assessment of the coral reefs in morales Beach, B...
A Rapid marine biodiversity assessment of the coral reefs in morales Beach, B...Innspub Net
 
FAITH.WARREN.BIOASSESSMENTPAPER.4.21.14
FAITH.WARREN.BIOASSESSMENTPAPER.4.21.14FAITH.WARREN.BIOASSESSMENTPAPER.4.21.14
FAITH.WARREN.BIOASSESSMENTPAPER.4.21.14Faith Warren
 
Presentation1 final shortened.pdf
Presentation1 final shortened.pdfPresentation1 final shortened.pdf
Presentation1 final shortened.pdfDr. Arzu Javadova
 
A paleontologist is studying the history of group of stratigraphic fo.pdf
A paleontologist is studying the history of group of stratigraphic fo.pdfA paleontologist is studying the history of group of stratigraphic fo.pdf
A paleontologist is studying the history of group of stratigraphic fo.pdfdhavalbl38
 
Where Is All The Water
Where Is All The WaterWhere Is All The Water
Where Is All The WaterSimon Cheatle
 
3.3-million-year-old stone tools from Lomekwi 3, West Turkana, Kenya
3.3-million-year-old stone tools from Lomekwi 3, West Turkana, Kenya3.3-million-year-old stone tools from Lomekwi 3, West Turkana, Kenya
3.3-million-year-old stone tools from Lomekwi 3, West Turkana, KenyaJosé Luis Moreno Garvayo
 

Similar to Mangrove ecosystem (20)

invertposter
invertposterinvertposter
invertposter
 
Mercury in the Global OceanPURPOSE USE THE NEWS The followin
Mercury in the Global OceanPURPOSE USE THE NEWS The followinMercury in the Global OceanPURPOSE USE THE NEWS The followin
Mercury in the Global OceanPURPOSE USE THE NEWS The followin
 
Science Case Study
Science Case StudyScience Case Study
Science Case Study
 
Measuring biodiversity
Measuring biodiversityMeasuring biodiversity
Measuring biodiversity
 
ASM Poster cd jk ma
ASM Poster cd jk maASM Poster cd jk ma
ASM Poster cd jk ma
 
Marine Ecology lab report sample
Marine Ecology lab report sampleMarine Ecology lab report sample
Marine Ecology lab report sample
 
Biological oceanography
Biological oceanographyBiological oceanography
Biological oceanography
 
The Cause Of The Dinosaur Extinction Essay
The Cause Of The Dinosaur Extinction EssayThe Cause Of The Dinosaur Extinction Essay
The Cause Of The Dinosaur Extinction Essay
 
SCAS Poster Seagrass FINAL
SCAS Poster Seagrass FINALSCAS Poster Seagrass FINAL
SCAS Poster Seagrass FINAL
 
GeologicalTimeline.pdf
GeologicalTimeline.pdfGeologicalTimeline.pdf
GeologicalTimeline.pdf
 
How much do we know - edited
How much do we know - editedHow much do we know - edited
How much do we know - edited
 
A Rapid marine biodiversity assessment of the coral reefs in morales Beach, B...
A Rapid marine biodiversity assessment of the coral reefs in morales Beach, B...A Rapid marine biodiversity assessment of the coral reefs in morales Beach, B...
A Rapid marine biodiversity assessment of the coral reefs in morales Beach, B...
 
Kenchel
KenchelKenchel
Kenchel
 
FAITH.WARREN.BIOASSESSMENTPAPER.4.21.14
FAITH.WARREN.BIOASSESSMENTPAPER.4.21.14FAITH.WARREN.BIOASSESSMENTPAPER.4.21.14
FAITH.WARREN.BIOASSESSMENTPAPER.4.21.14
 
Report
ReportReport
Report
 
Presentation1 final shortened.pdf
Presentation1 final shortened.pdfPresentation1 final shortened.pdf
Presentation1 final shortened.pdf
 
Lobster Life Cycle
Lobster Life CycleLobster Life Cycle
Lobster Life Cycle
 
A paleontologist is studying the history of group of stratigraphic fo.pdf
A paleontologist is studying the history of group of stratigraphic fo.pdfA paleontologist is studying the history of group of stratigraphic fo.pdf
A paleontologist is studying the history of group of stratigraphic fo.pdf
 
Where Is All The Water
Where Is All The WaterWhere Is All The Water
Where Is All The Water
 
3.3-million-year-old stone tools from Lomekwi 3, West Turkana, Kenya
3.3-million-year-old stone tools from Lomekwi 3, West Turkana, Kenya3.3-million-year-old stone tools from Lomekwi 3, West Turkana, Kenya
3.3-million-year-old stone tools from Lomekwi 3, West Turkana, Kenya
 

More from Sugurusunshine

More from Sugurusunshine (6)

Panthernet
PanthernetPanthernet
Panthernet
 
Interview
InterviewInterview
Interview
 
Senior seminar presentation
Senior seminar presentationSenior seminar presentation
Senior seminar presentation
 
Conflict case study assignment (final)
Conflict case study assignment (final)Conflict case study assignment (final)
Conflict case study assignment (final)
 
The significance of communication 2
The significance of communication 2The significance of communication 2
The significance of communication 2
 
光と影
光と影光と影
光と影
 

Mangrove ecosystem

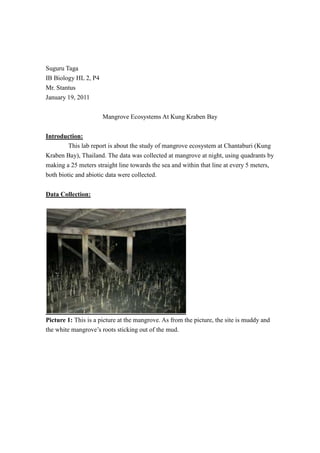
  • 1. Suguru Taga<br />IB Biology HL 2, P4<br />Mr. Stantus<br />January 19, 2011<br />Mangrove Ecosystems At Kung Kraben Bay<br />Introduction:<br />This lab report is about the study of mangrove ecosystem at Chantaburi (Kung Kraben Bay), Thailand. The data was collected at mangrove at night, using quadrants by making a 25 meters straight line towards the sea and within that line at every 5 meters, both biotic and abiotic data were collected.<br />Data Collection:<br />Picture 1: This is a picture at the mangrove. As from the picture, the site is muddy and the white mangrove’s roots sticking out of the mud. <br />Picture 2: This picture shows how the data collection was done. As from the picture, four quadrants were used for data collection and the organisms that were seen in the quadrants were recorded.<br />Organisms and Abiotic Factors<br />Table 1: This table shows both organisms observed at the mangrove and abiotic factors. As from the table the pH and the temperature has not changed, but the number of organisms increased as it moved towards that sea.<br />Qualitative Data:<br />At the mangroves two different types of mangroves were observed, one with roots shooting out from the ground like a needle (pencil roots) and one with root that has several branched roots (prop roots). The mud (ground) was mostly gray and dry, but when the foot was taken out of the ground redish brown color soil with water coming from the ground was observed. The place was very dark that without the flash light, it is hard to even see. The organisms were usually in the mud than out in the surface so not many organisms were observed as from table 1. Also, there were only little organisms and not big ones like fish or lobster. While the observations there were poping sound like pop corn and according to the rangers it was the sound of shrimp jumping. While walking on the board walk the mangroves were densely close to each other, but towards the sea the number of mangroves got less dense. <br />Data Processing and Presentation:<br />Graph 1: This graph shows the average number of organisms that were observed during data collection. As from the graph almost none of crabs were observed but many crab holes were founded about 27 in an average. Also almost none of the worms were found either. Lastly, in an average about 4 of snails were found.<br />Calculations (Mangrove):<br />D=N(N-1)n(n-1)<br />D=Simpson’s Index<br />N=total number of organisms<br />n=number of organisms of a species<br />From Table 1:<br />N=((total # of crabs)+ (total # of crab holes)+(total # of snails)+(total # of worms))<br /> =1+136+20+1<br /> =158<br />N(N-1)=158(158-1)<br /> =158(157)<br /> =24806<br />Crabs:<br />n= (0 meter) + (5 meters) + (10 meters) + (15 meters) + (20 meters)<br /> = 1+0+0+0+0<br /> = 1<br />n(n-1) =1(1-1)<br /> =1(0)<br /> =0<br />Crab Holes:<br />n= (0 meter) + (5 meters) + (10 meters) + (15 meters) + (20 meters)<br /> = 22+27+20+47+20<br /> = 136<br />n(n-1)= 136(136-1)<br /> = 136(135)<br /> = 18360<br />Snails:<br />n= (0 meter) + (5 meters) + (10 meters) + (15 meters) + (20 meters)<br /> = 0+2+0+8+10<br /> = 20<br />n(n-1)= 20(20-1)<br /> = 20(19)<br /> = 380<br />Worms:<br />n= (0 meter) + (5 meters) + (10 meters) + (15 meters) + (20 meters)<br /> =0+0+0+0+1<br /> =1<br />n(n-1)= 1(1-1)<br /> = 1(0)<br /> = 0<br />Simpson Index (Mangrove):<br />D=N(N-1)n(n-1)<br />D = 248060+18360+380+0<br />D= 2480618740<br />D= 1.323692636<br />D≈1.32<br />Simpson Index of other group (Rocky Shore):<br />D=4.60687<br />D≈4.61<br />Conclusion and Evaluation:<br />This lab is about the data collected at mangrove. As from table 1, only one crab, 136 crab holes, 20 snails, and only one worm were observed during the data collection. It is surprising that 136 crab holes were found but only one crab was found. Also, pH of 7.5 and 25 ℃ were constant along the 20 meters. There were not any connections between the biotic factors and the abiotic factors found. However, since the data collection took place at night, most of the organisms were sleeping and not many organisms were found. The Simpson index for mangrove was about 1.32 and the Simpson index for rocky shore was about 4.61. These two numbers shows that at the rocky shore, more organisms were found and fewer organisms were found at the mangrove. The time of the data collection made the difference in Simpsons because at the rocky shore the data collection was during the day time but the data collection at the mangrove took place at night. So, the organisms at mangrove might have been asleep and hiding.<br />The weaknesses during the data collection were the time of the data collection and the data was collected at a place where the mud was ruined by human. The data at the mangrove was at night so the organisms were not active like in the day time so not many organisms were found. Therefore, the data collection should have been taken at around the same period of time during day time so that most of the organisms are active and found more easily. Lastly, when other groups got off to the mud and walking around, the ground became ruined and many holes were made which might have destroyed the number of the crab holes. Also, because the ground was ruined, the organisms might have got scared and went away. For improvement, the data could be collected where people have not stepped on the ground so that the more accurate number of organisms could be recoreded. <br />