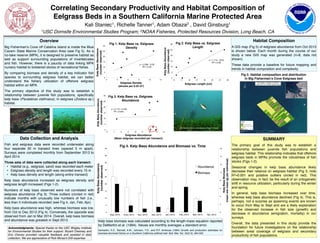
1. Correlating Secondary Productivity and Habitat Composition of
Eelgrass Beds in a Southern California Marine Protected Area!
Kali Staniec1, Richelle Tanner1, Adam Obaza2 , David Ginsburg1 !
1USC Dornsife Environmental Studies Program; 2NOAA Fisheries, Protected Resources Division, Long Beach, CA!
Fig.
3
Overview!
!
Big Fisherman’s Cove off Catalina Island is inside the Blue
Cavern State Marine Conservation Area (see Fig 5). As a
no-take reserve (MPA), it is designed to preserve habitat as
well as support surrounding populations of invertebrates
and fish. However, there is a paucity of data linking MPA
nursery habitat to bolstered stocks of recreational fishes. !
!
By comparing biomass and density of a key indicator fish
species to surrounding eelgrass habitat, we can better
understand the fishery utilization of offshore eelgrass
habitat within an MPA.!
!
The primary objective of this study was to establish a
relationship between juvenile fish populations, specifically
kelp bass (Paralabrax clathratus), in eelgrass (Zostera sp.)
habitat.!
SUMMARY!
!
The primary goal of this study was to establish a
relationship between juvenile fish populations and
eelgrass habitat. This relationship indicates that offshore
eelgrass beds in MPAs promote the robustness of fish
stocks (Figs 1-2). !
!
Seasonal changes in kelp bass abundance likely
decrease their reliance on eelgrass habitat (Fig 3, note
R2=0.001 and putative outliers circled in red). This
observation may, in fact, be the result of an ontogenetic
shift in resource utilization, particularly during the winter
and spring.!
!
In general, kelp bass biomass increased over time,
whereas kelp bass abundance declined (Fig 4). This is,
perhaps, not a surprise as spawning events are known
to occur from May to Sept and are a likely explanation
for the observed increase in fish size (growth) and
decrease in abundance (emigration, mortality) in our
surveys. !
!
Overall, the data presented in this study provide the
foundation for future investigations on the relationship
between areal coverage of eelgrass and secondary
productivity of fish populations.!
Habitat Composition!
!
A GIS map (Fig 5) of eelgrass abundance from Oct 2013
is shown below. Each month during the course of our
study a new GIS map was generated (n=8, data not
shown). !
!
These data provide a baseline for future mapping and
trends in habitat composition and complexity.!
Data Collection and Analysis!
!
Fish and eelgrass data were recorded underwater along
four separate 30 m transect lines (spaced 5 m apart).
Surveys were completed monthly from September 2013 to
April 2014.!
!
Three sets of data were collected along each transect: !
• Habitat (e.g., eelgrass, sand) was recorded each meter!
• Eelgrass density and length was recorded every 10 m!
• Kelp bass density and length (along entire transect)!
!
Kelp bass abundance increased as eelgrass density and
eelgrass length increased (Figs 1-2).!
!
Numbers of kelp bass observed were not correlated with
eelgrass abundance (Fig 3). Three outliers (circled in red)
indicate months with unusually low numbers of fish (i.e.,
less than 5 individuals recorded (see Fig 4, Jan, Feb, Apr).!
!
Kelp bass abundance was high, whereas biomass was low,
from Oct to Dec 2013 (Fig 4). Conversely, the opposite was
observed from Jan to Mar 2014. Overall, kelp bass biomass
and abundance was greatest in Sept 2013.!
P. clathratus; Image: T. Carr!
y = 2.09x - 0.03!
R² = 0.20!
0!
5!
10!
15!
20!
25!
30!
2! 4! 6! 8! 10! 12!
KelpBassAbundance!
(numberobserved)!
Eelgrass Density!
(shoots per 0.25 m2)!
Fig 1. Kelp Bass vs. Eelgrass
Density!
y = 1.71x - 22.6!
R² = 0.56!
0!
5!
10!
15!
20!
25!
30!
15! 17! 19! 21! 23! 25! 27! 29!
KelpBassAbundance!
(numberobserved)!
Eelgrass Length (cm)!
Fig 2. Kelp Bass vs. Eelgrass
Length!
y = 0.17x + 9.49!
R² = 0.001!
0!
5!
10!
15!
20!
25!
30!
6! 7! 8! 9! 10! 11! 12! 13! 14!
KelpBassAbundance!
(numberobserved)!
Eelgrass Abundance!
(Mean eelgrass recorded per transect)!
Fig 3. Kelp Bass vs. Eelgrass
Abundance!
Kelp bass biomass was calculated according to the length-mass equation reported
by DeMartini et al. (1994). Values are monthly averages ± standard error.!
!
Demartini, E.E., Barnett, A.M., Johnson, T.D., and R.F. Ambrose (1994) Growth and production estimates for
biomass-dominant fishes on a Southern California artificial reef. Bull. Mar. Sci. 55(2-3): 484-500!
Acknowledgments: Special thanks to the USC Wrigley Institute
for Environmental Studies for their support. Bryant Chesney and
Eric Chavez provided valuable feedback and assisted in data
collection. We are appreciative of Rick Morse’s GIS expertise.!
Source: Esri, i-cubed, USDA, USGS, AEX, GeoEye, Getmapping, Aerogrid, IGN, IGP, and the GIS User Community
´
0 6 123 Meters
Legend
Habitat
High Density Eelgrass
Eelgrass and other habitat
Sand
Macroalgae
Source: Esri, i-cubed, USDA, USGS, AEX, GeoEye, Getmapping,
Aerogrid, IGN, IGP, and the GIS User Community
Fish Habitat - sampled 10-18-2013
Fisherman's Cove, Santa Catalina Island
NOAA-NMFS-SWR-Long Beach
Date:
Scale:
2014-04-21
1:111
0!
2!
4!
6!
8!
10!
12!
14!
16!
0!
5!
10!
15!
20!
25!
30!
35!
40!
45!
Sep_2013! Octo_2013! Nov_2013! Dec_2013! Jan_2013! Feb_2013! Mar_2013! Apr_2013!
KelpBassBiomass!
(meanwetmass(g)perindividual)!
KelpBassAbundance!
(numberobserved)!
Fig 4. Kelp Bass Abundance and Biomass vs. Time!
Abundance!
Biomass!
Zostera sp.; Image: A. Obaza!
Kelp bass and diver in eelgrass bed.; Image: A. Obaza!
Jan_2014! Feb_2014! Mar_2014! Apr_2014!
Fig 5. Habitat composition and distribution
in Big Fisherman’s Cove Eelgrass bed!