
Recommended
More Related Content
More from SteveBoylan2
More from SteveBoylan2 (20)
Recently uploaded
Recently uploaded (20)
Copper(II) nitrate concentration analysis using linear regression (1)
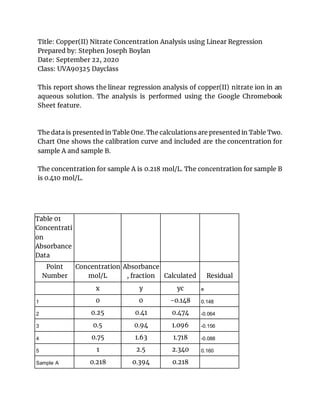
- 1. Title: Copper(II) Nitrate Concentration Analysis using Linear Regression Prepared by: Stephen Joseph Boylan Date: September 22, 2020 Class: UVA90325 Dayclass This report shows the linear regression analysis of copper(II) nitrate ion in an aqueous solution. The analysis is performed using the Google Chromebook Sheet feature. The data is presented in Table One. The calculations are presented in Table Two. Chart One shows the calibration curve and included are the concentration for sample A and sample B. The concentration for sample A is 0.218 mol/L. The concentration for sample B is 0.410 mol/L. Table 01 Concentrati on Absorbance Data Point Number Concentration mol/L Absorbance , fraction Calculated Residual x y yc e 1 0 0 -0.148 0.148 2 0.25 0.41 0.474 -0.064 3 0.5 0.94 1.096 -0.156 4 0.75 1.63 1.718 -0.088 5 1 2.5 2.340 0.160 Sample A 0.218 0.394 0.218
- 2. Sample B 0.410 0.873 0.410 Table 02 Linear Regression Analysis A count 5 B sum x 2.5 C sum y 5.48 D average x 0.5 E average y 1.096 F sum x^2 1.875 G sum y^2 9.9586 H sum xy 4.295 I parameter b 2.488 J parameter a -0.148 K parameter c 0.4019292605 L parameter d 0.05948553055