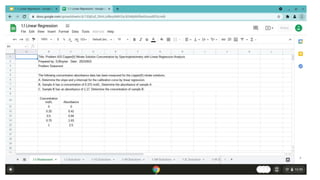
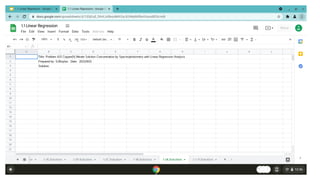
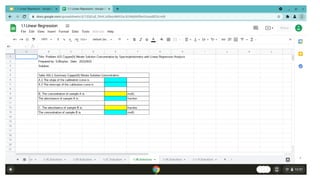
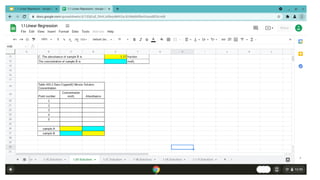
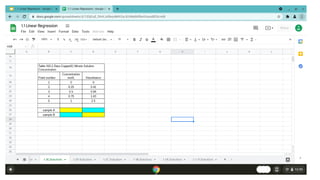
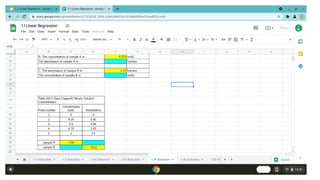
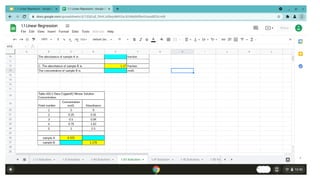
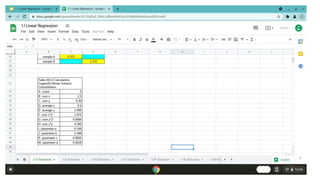
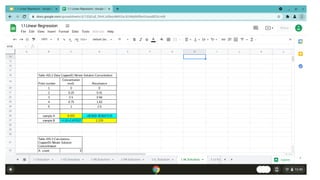
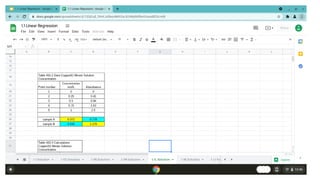
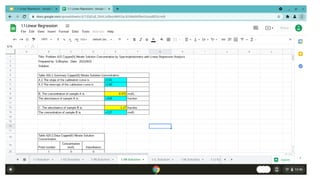
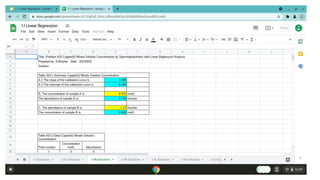
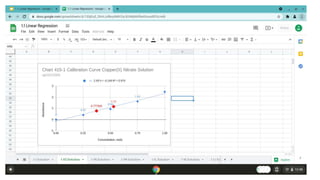
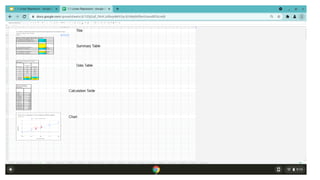
1.1 Linear
Regression
Spectrophotometer
Stephen Joseph Boylan 202100915
Here we go
In this exercise, you will:
Analyse spectrophotometer
data from copper nitrate
solutions using linear
regression on a spreadsheet.
In the exercise you will:
1 Start and save a spread sheet.
2 Make three tables in your spread sheet
3 Make a chart in your spreadsheet.
4 Email your spread sheet.
Step Seventeen Your completed spreadsheet.
Your spreadsheet will have a Title, a Summary Table, a
Data Table, a Calculation Table and a Chart.
The next slide shows an expanded view of the completed
spreadsheet
Step One Open Google Sheets in the HP Chromebook
Start a new spreadsheet.
Get the data from the problem statement.
Data from the problem statement is shown on next slide
Step Two Start your spreadsheet with a title block.
Enter title for your spreadsheet
Enter your name and date
Enter the title block as shown on the next page.
Step Three Make Table 415-1 Summary
Enter table as shown on next slide.
Step Four Enter Concentration and absorbance in
Table 415-1 Summary
See next slide for Table 415-1 with the values
Step Five Make Table 415-2 Data
See next slide for Table 415-2
Step Six Enter Concentration absorbance data in
table 415-2
See Table on next slide
Step Seven Add formulas to Table 415-2
See next slide
Step Eight Check your formulas
Your table will look like the table in the next slide
Step Nine Enter Table 415-3
Copy Table 415-3 as shown on next slide
Step Ten Add formulas to Table 415-3
See next slide for formulas
Step Eleven Check your values in Table 415-3
Your table will show the value shown in the next slide
Step Twelve Add formulas to Table 415-2
Formulas are shown on next slide
Step Thirteen Check your values
Your table will show the value on the next screen
Step Fourteen Add Formulas to Table 415-1
See formula on next slide
Step Fifteen Check your values
See correct values on next slide
Step Sixteen Add a Chart
See next slide for chart
Step Seventeen Check your completed spreadsheet.
Your spreadsheet will have a Title, a Summary Table, a
Data Table, a Calculation Table and a Chart.
The next slide shows an expanded view of the completed
spreadsheet
Step Eighteen Send copy of your spreadsheet by
email
Use File > Email > Email this file to send your report
What we have accomplished
Analyse spectrophotometer
data from copper nitrate
solutions using linear
regression on a spreadsheet.
Thank you for
taking the
time to watch.
1.1 Linear Regression
Spectrophotometer
The End

1.1 linear regression

  • 1.
  • 2.
  • 3.
    In this exercise,you will: Analyse spectrophotometer data from copper nitrate solutions using linear regression on a spreadsheet.
  • 4.
    In the exerciseyou will: 1 Start and save a spread sheet. 2 Make three tables in your spread sheet 3 Make a chart in your spreadsheet. 4 Email your spread sheet.
  • 5.
    Step Seventeen Yourcompleted spreadsheet. Your spreadsheet will have a Title, a Summary Table, a Data Table, a Calculation Table and a Chart. The next slide shows an expanded view of the completed spreadsheet
  • 7.
    Step One OpenGoogle Sheets in the HP Chromebook Start a new spreadsheet. Get the data from the problem statement. Data from the problem statement is shown on next slide
  • 9.
    Step Two Startyour spreadsheet with a title block. Enter title for your spreadsheet Enter your name and date Enter the title block as shown on the next page.
  • 11.
    Step Three MakeTable 415-1 Summary Enter table as shown on next slide.
  • 13.
    Step Four EnterConcentration and absorbance in Table 415-1 Summary See next slide for Table 415-1 with the values
  • 15.
    Step Five MakeTable 415-2 Data See next slide for Table 415-2
  • 17.
    Step Six EnterConcentration absorbance data in table 415-2 See Table on next slide
  • 19.
    Step Seven Addformulas to Table 415-2 See next slide
  • 21.
    Step Eight Checkyour formulas Your table will look like the table in the next slide
  • 23.
    Step Nine EnterTable 415-3 Copy Table 415-3 as shown on next slide
  • 25.
    Step Ten Addformulas to Table 415-3 See next slide for formulas
  • 27.
    Step Eleven Checkyour values in Table 415-3 Your table will show the value shown in the next slide
  • 29.
    Step Twelve Addformulas to Table 415-2 Formulas are shown on next slide
  • 31.
    Step Thirteen Checkyour values Your table will show the value on the next screen
  • 33.
    Step Fourteen AddFormulas to Table 415-1 See formula on next slide
  • 35.
    Step Fifteen Checkyour values See correct values on next slide
  • 37.
    Step Sixteen Adda Chart See next slide for chart
  • 39.
    Step Seventeen Checkyour completed spreadsheet. Your spreadsheet will have a Title, a Summary Table, a Data Table, a Calculation Table and a Chart. The next slide shows an expanded view of the completed spreadsheet
  • 41.
    Step Eighteen Sendcopy of your spreadsheet by email Use File > Email > Email this file to send your report
  • 42.
    What we haveaccomplished Analyse spectrophotometer data from copper nitrate solutions using linear regression on a spreadsheet.
  • 43.
    Thank you for takingthe time to watch.
  • 44.