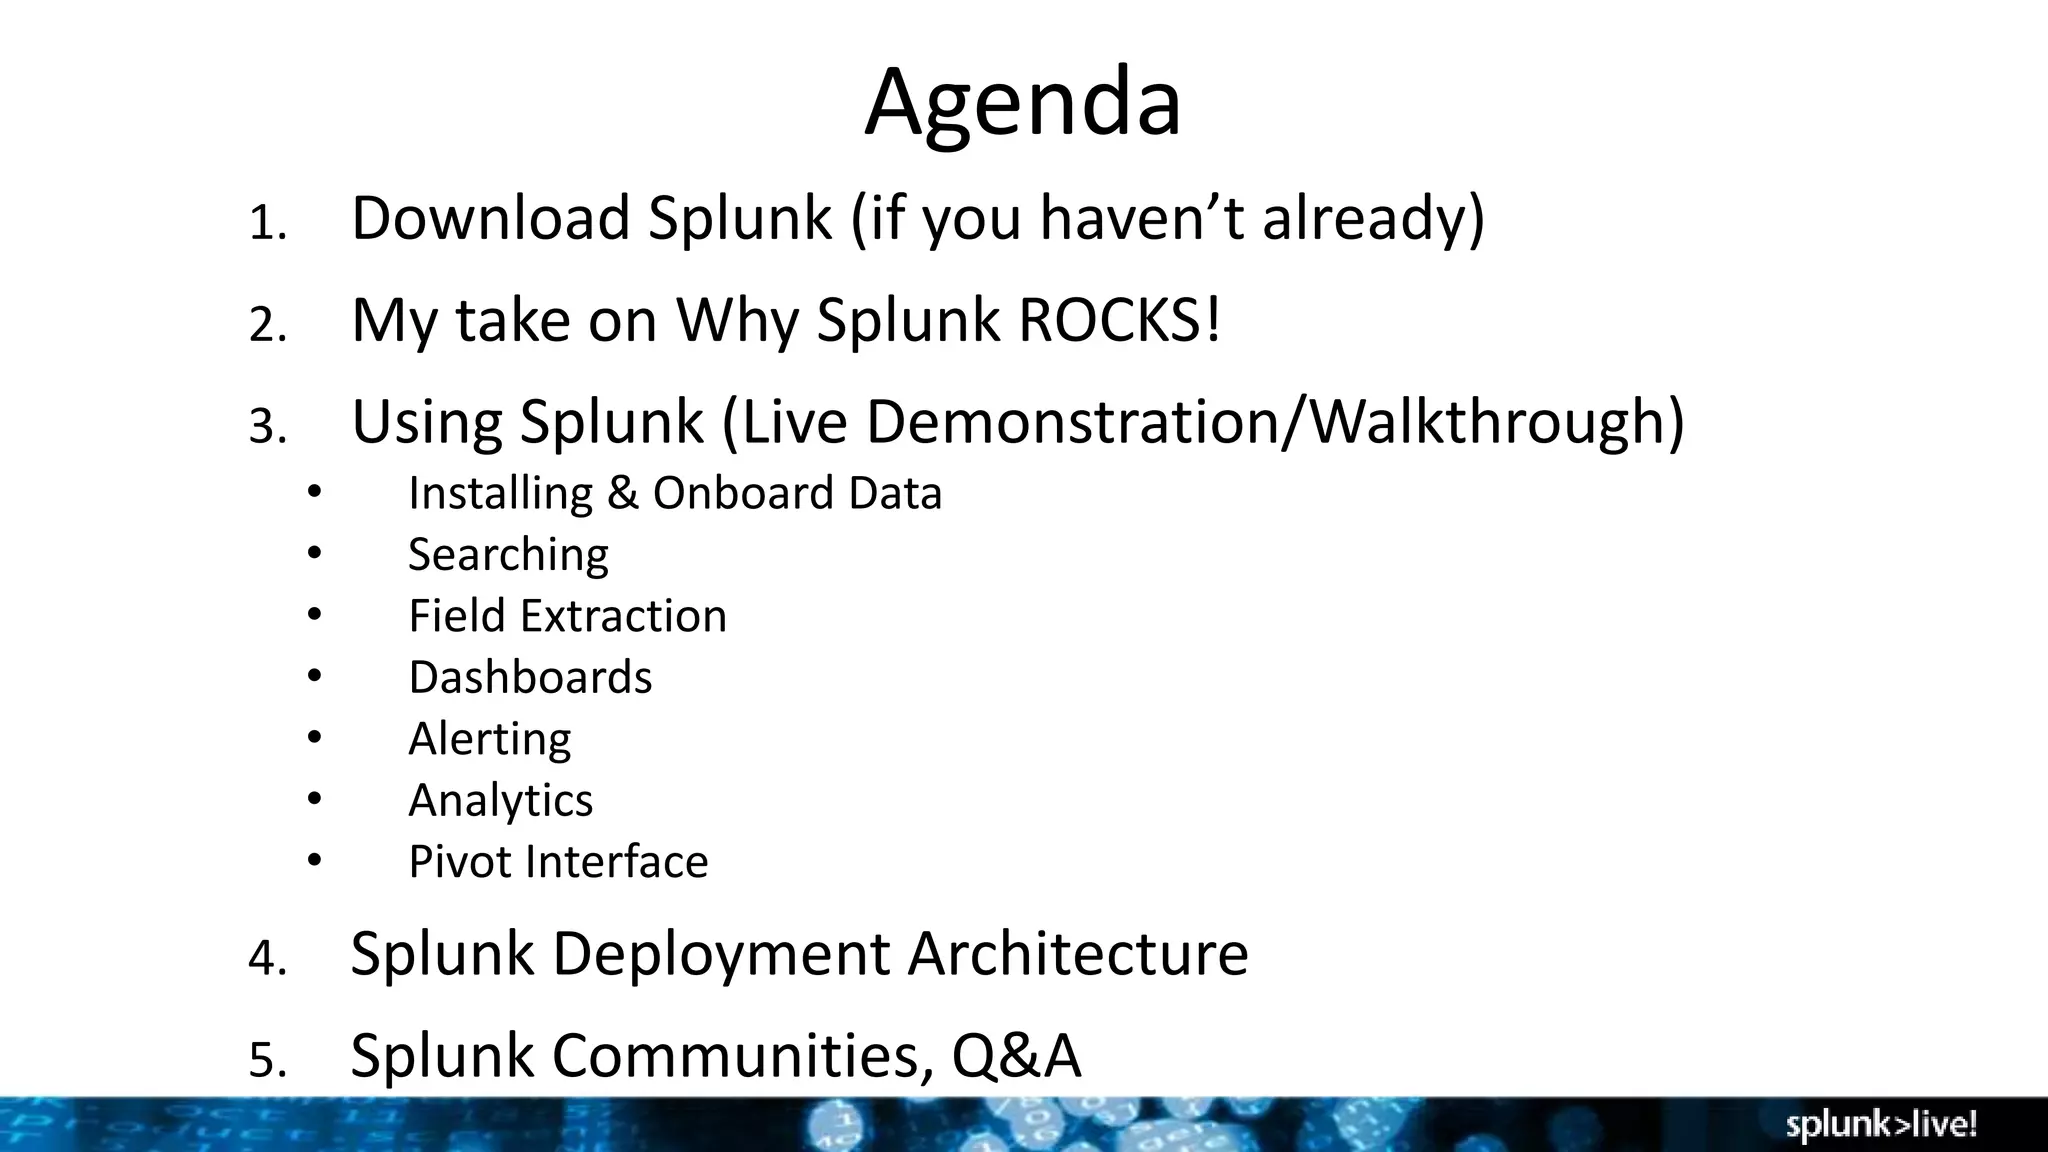
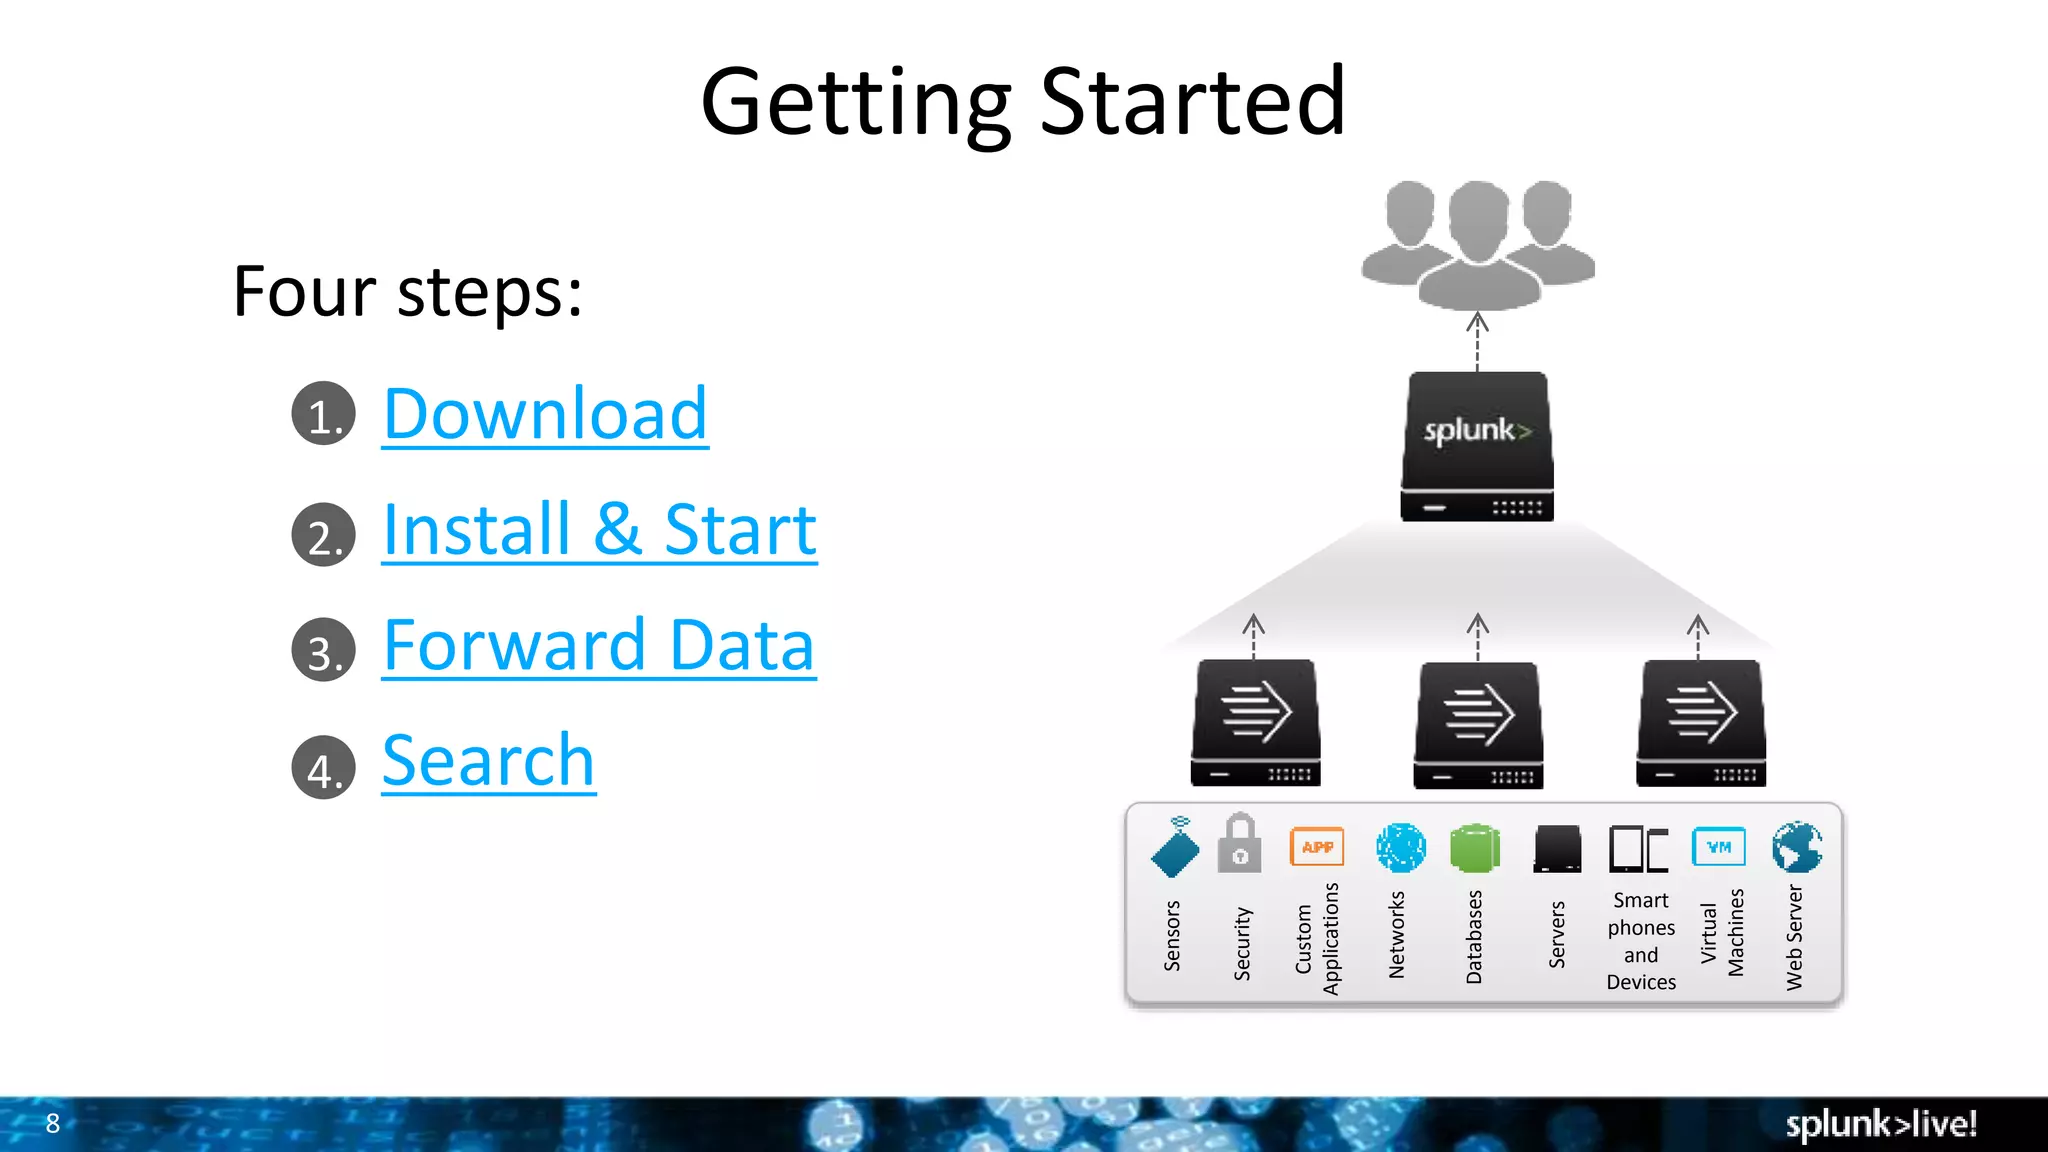
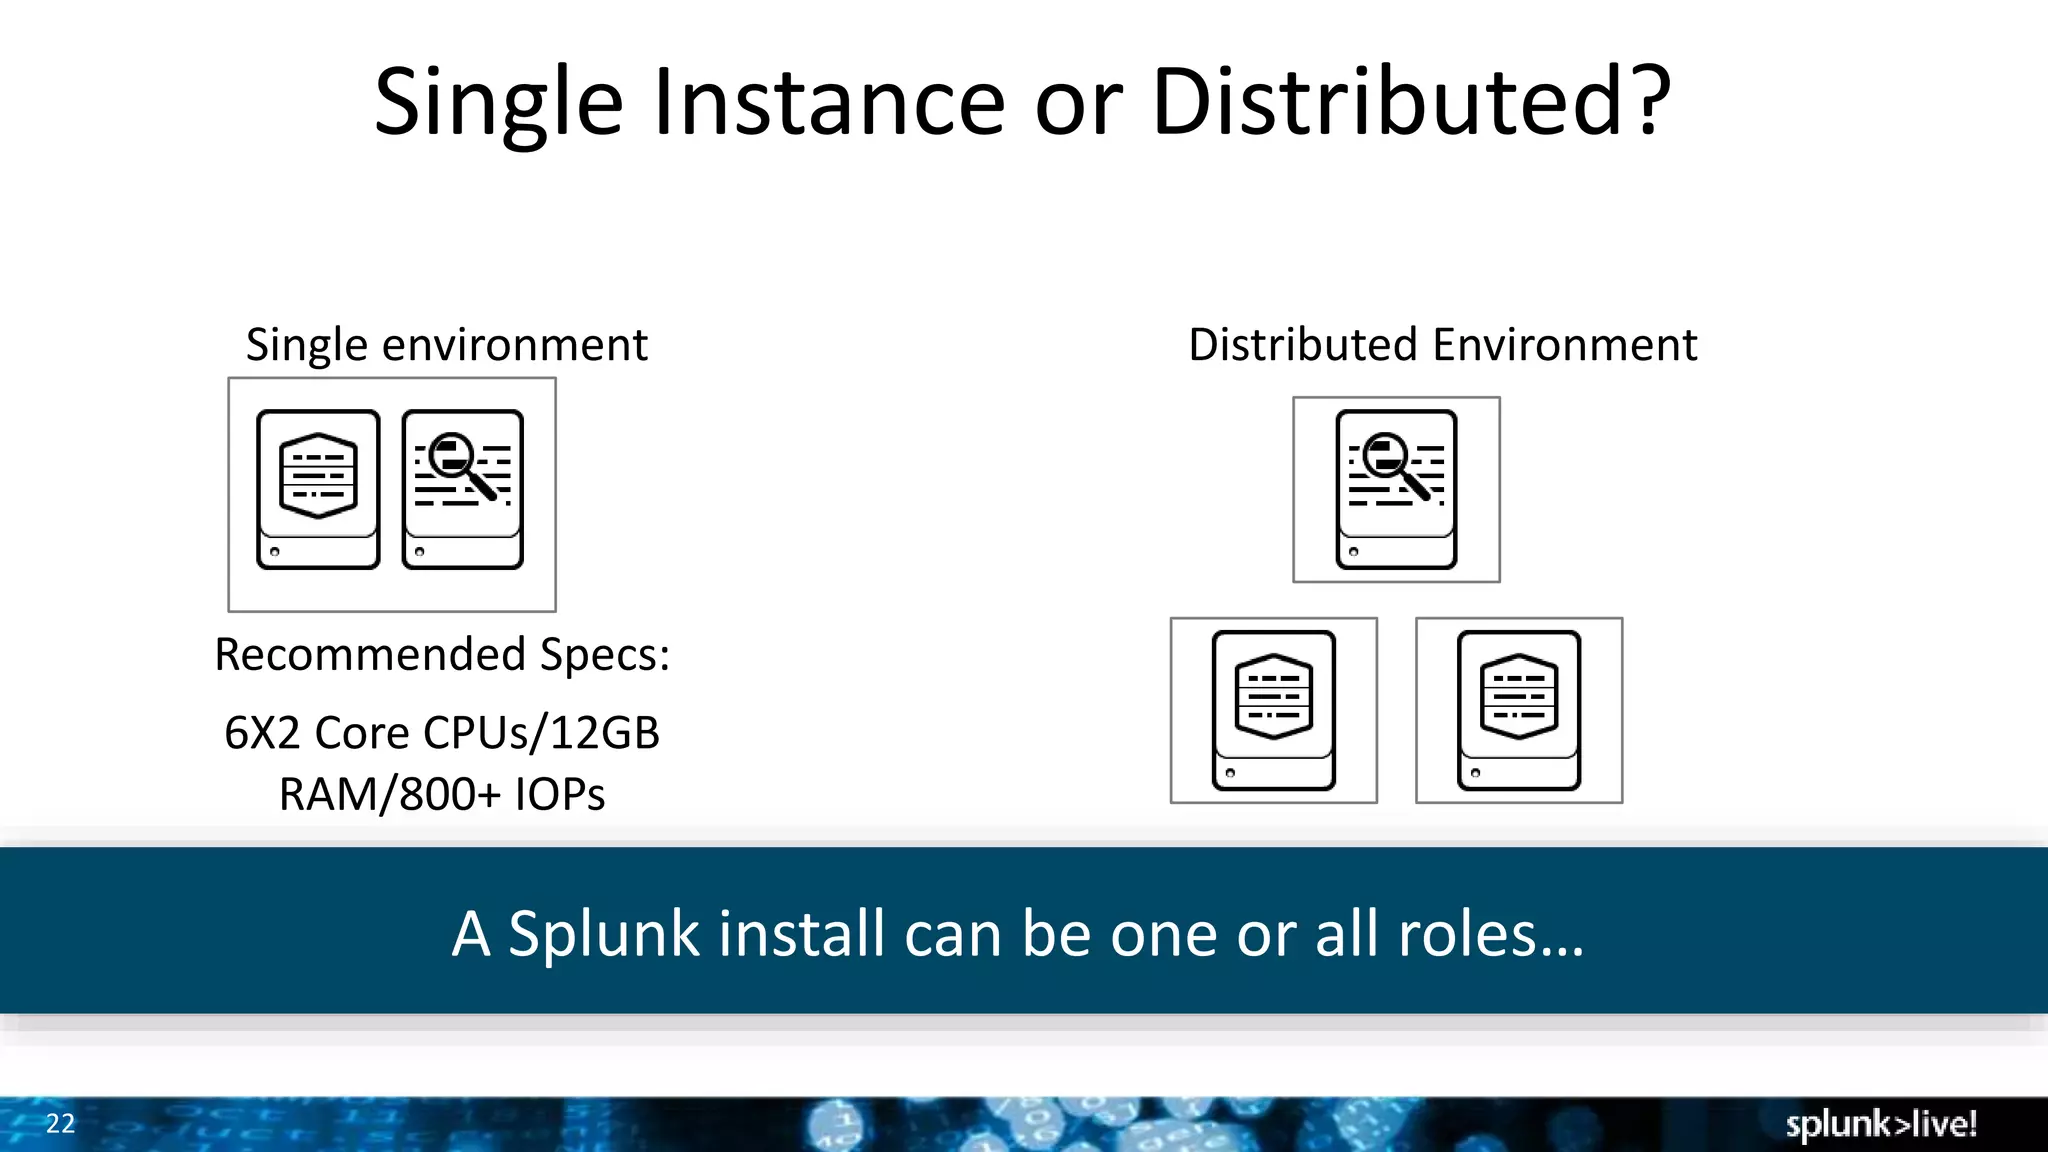
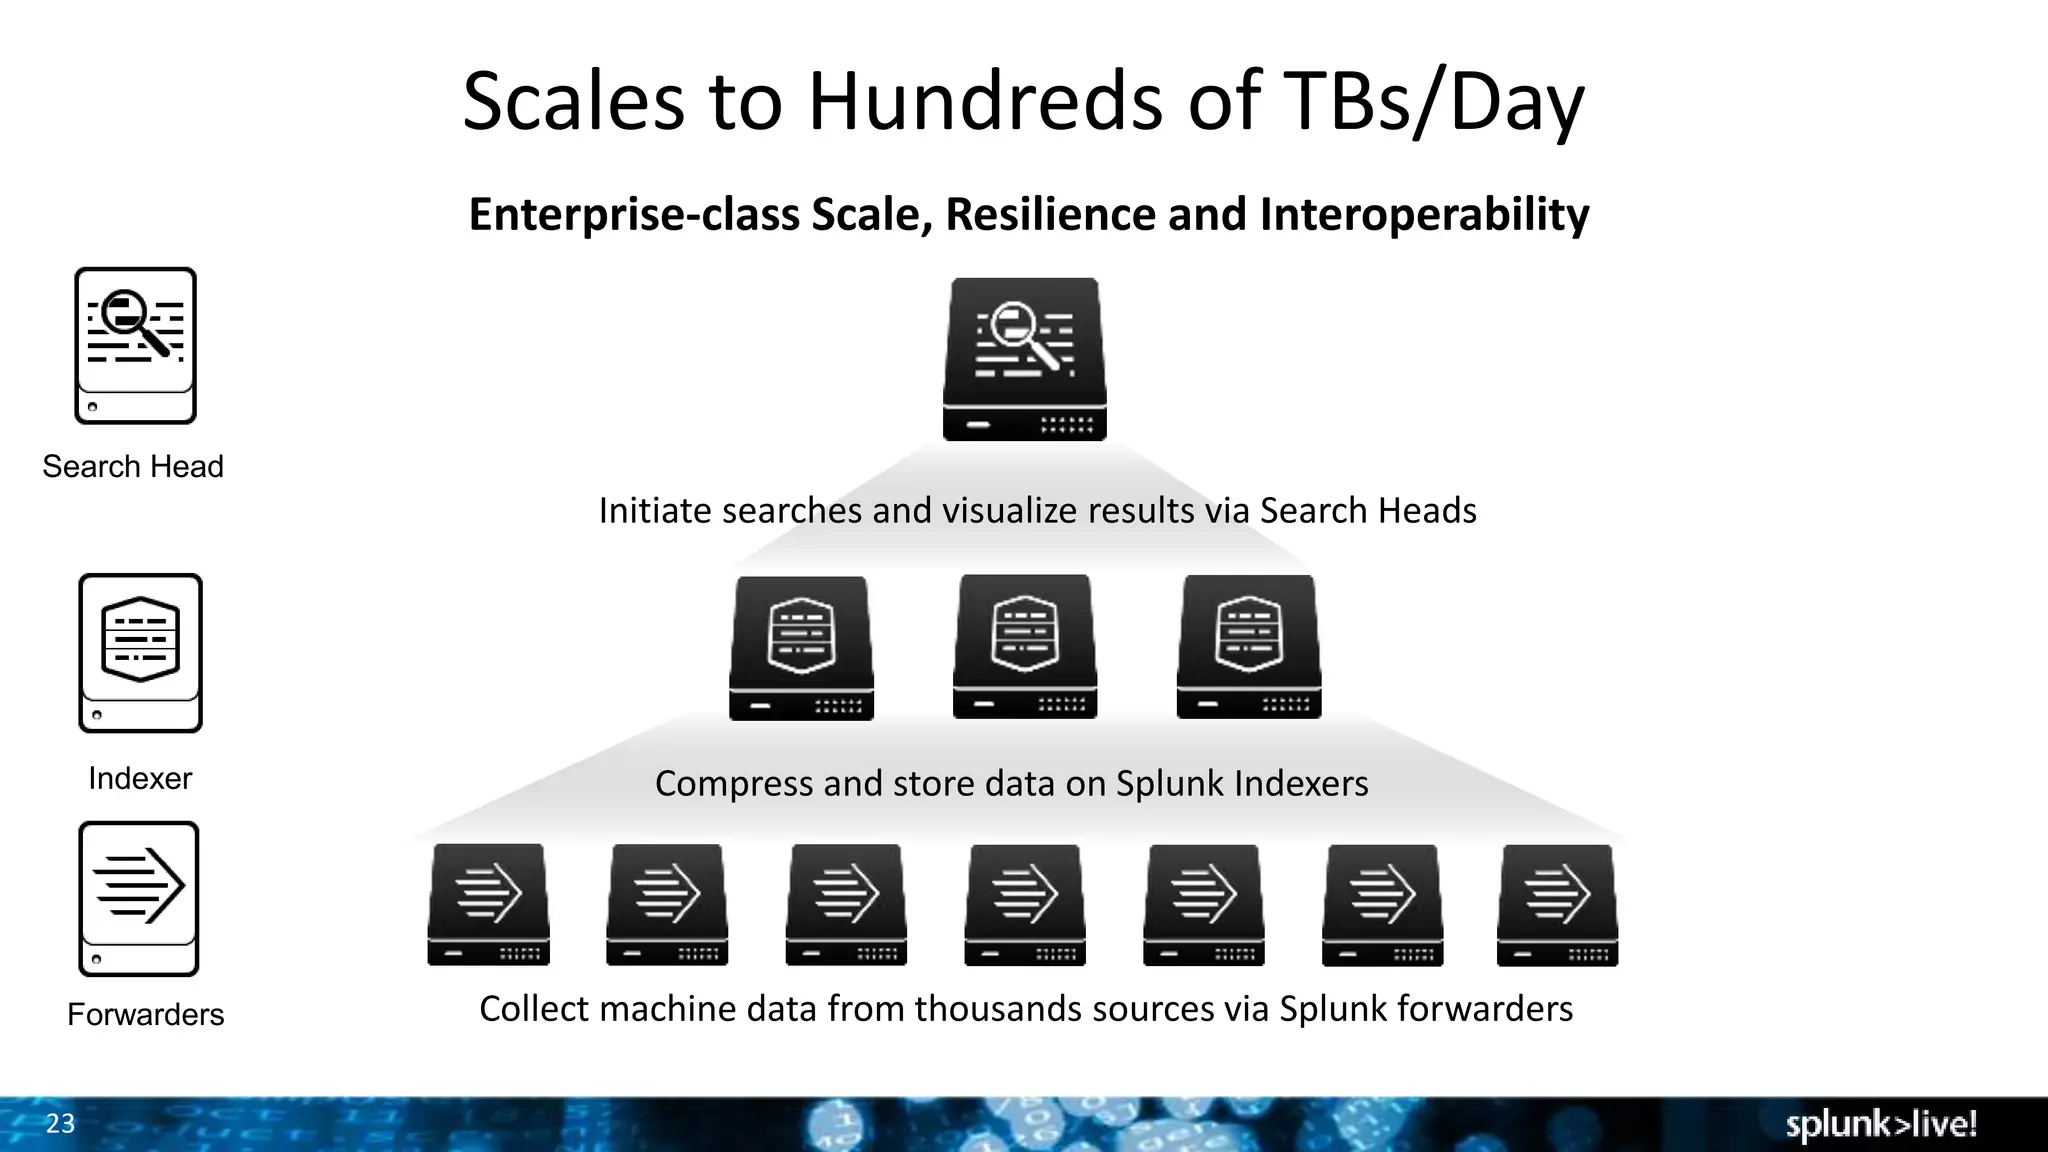
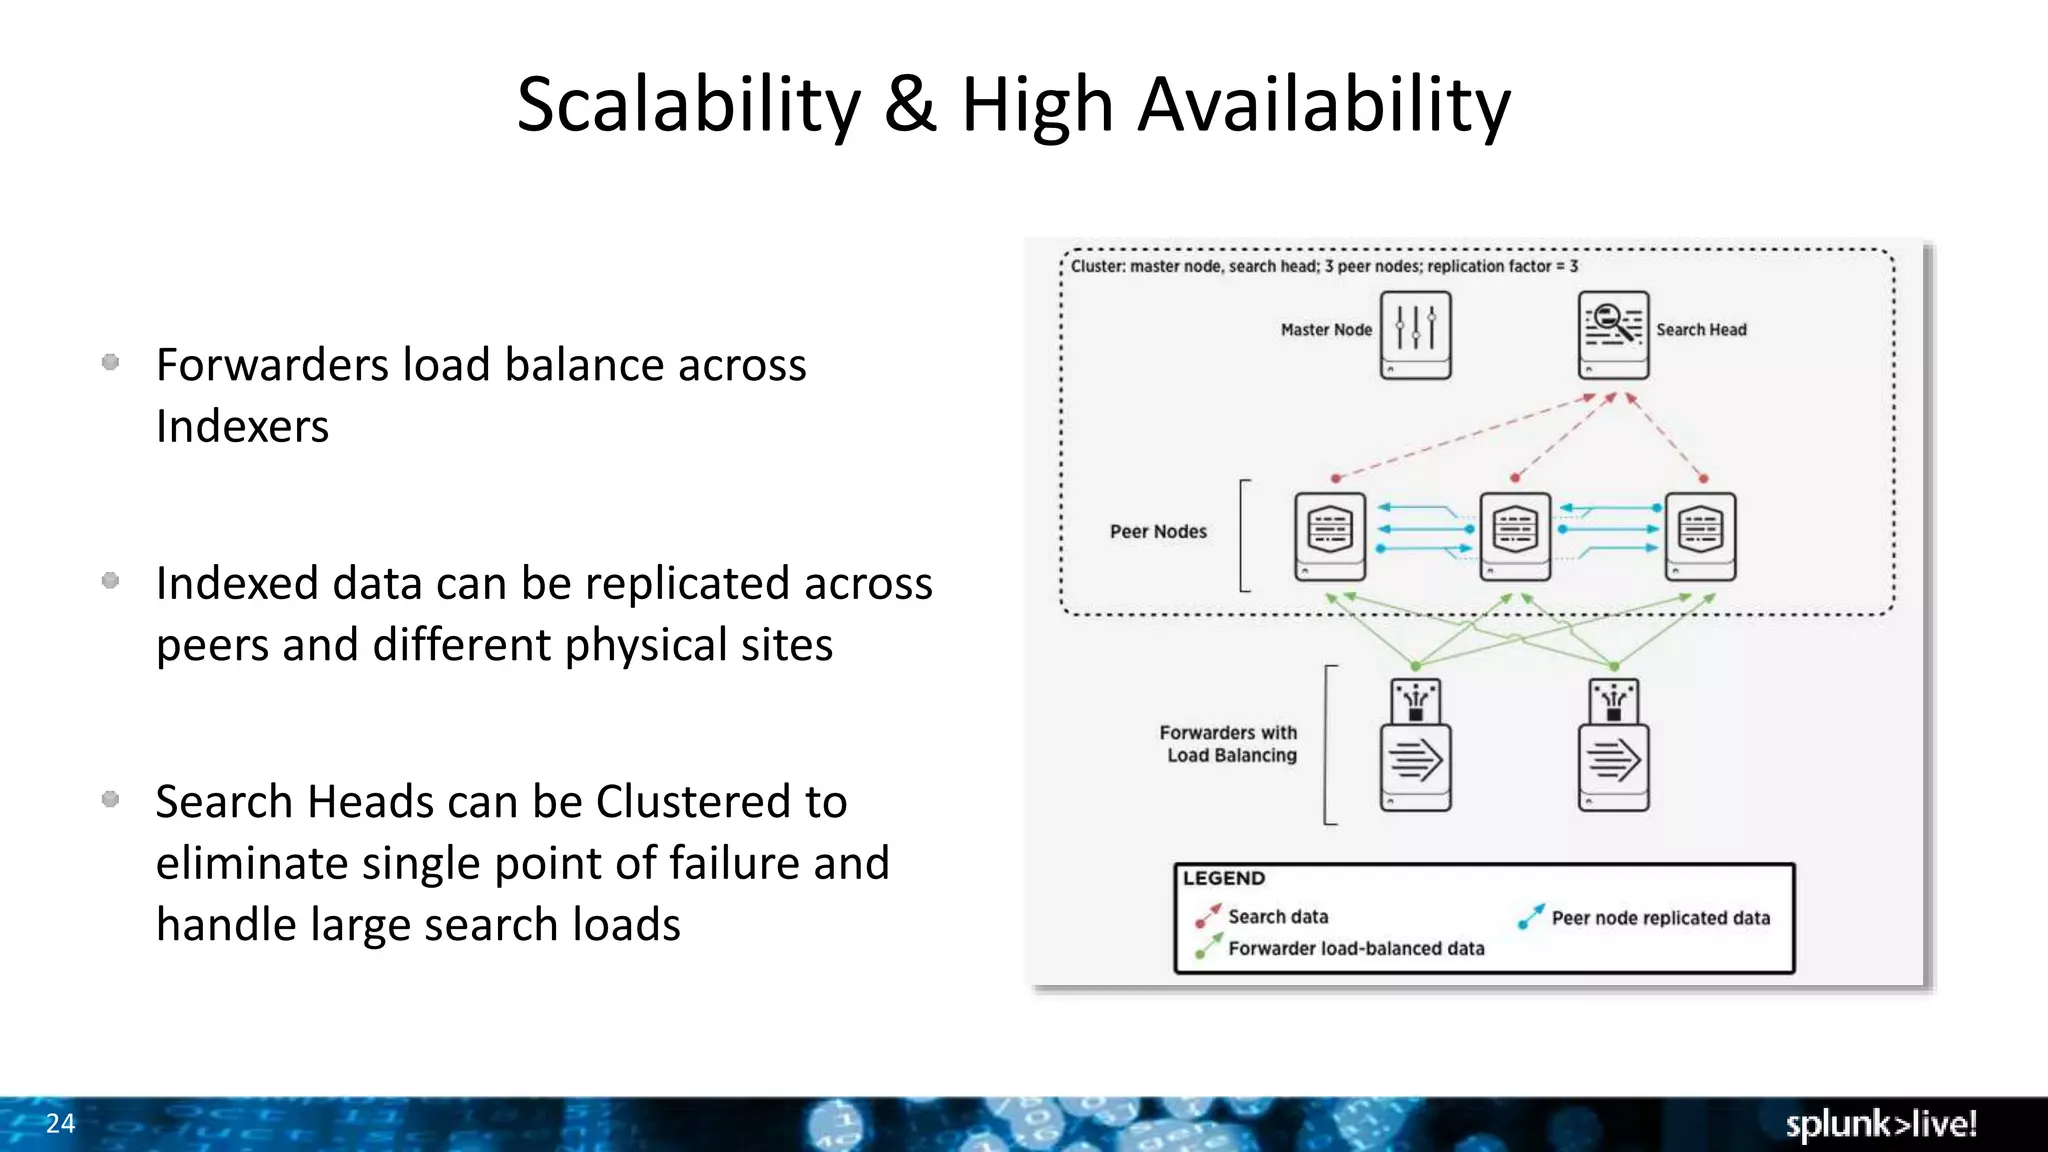
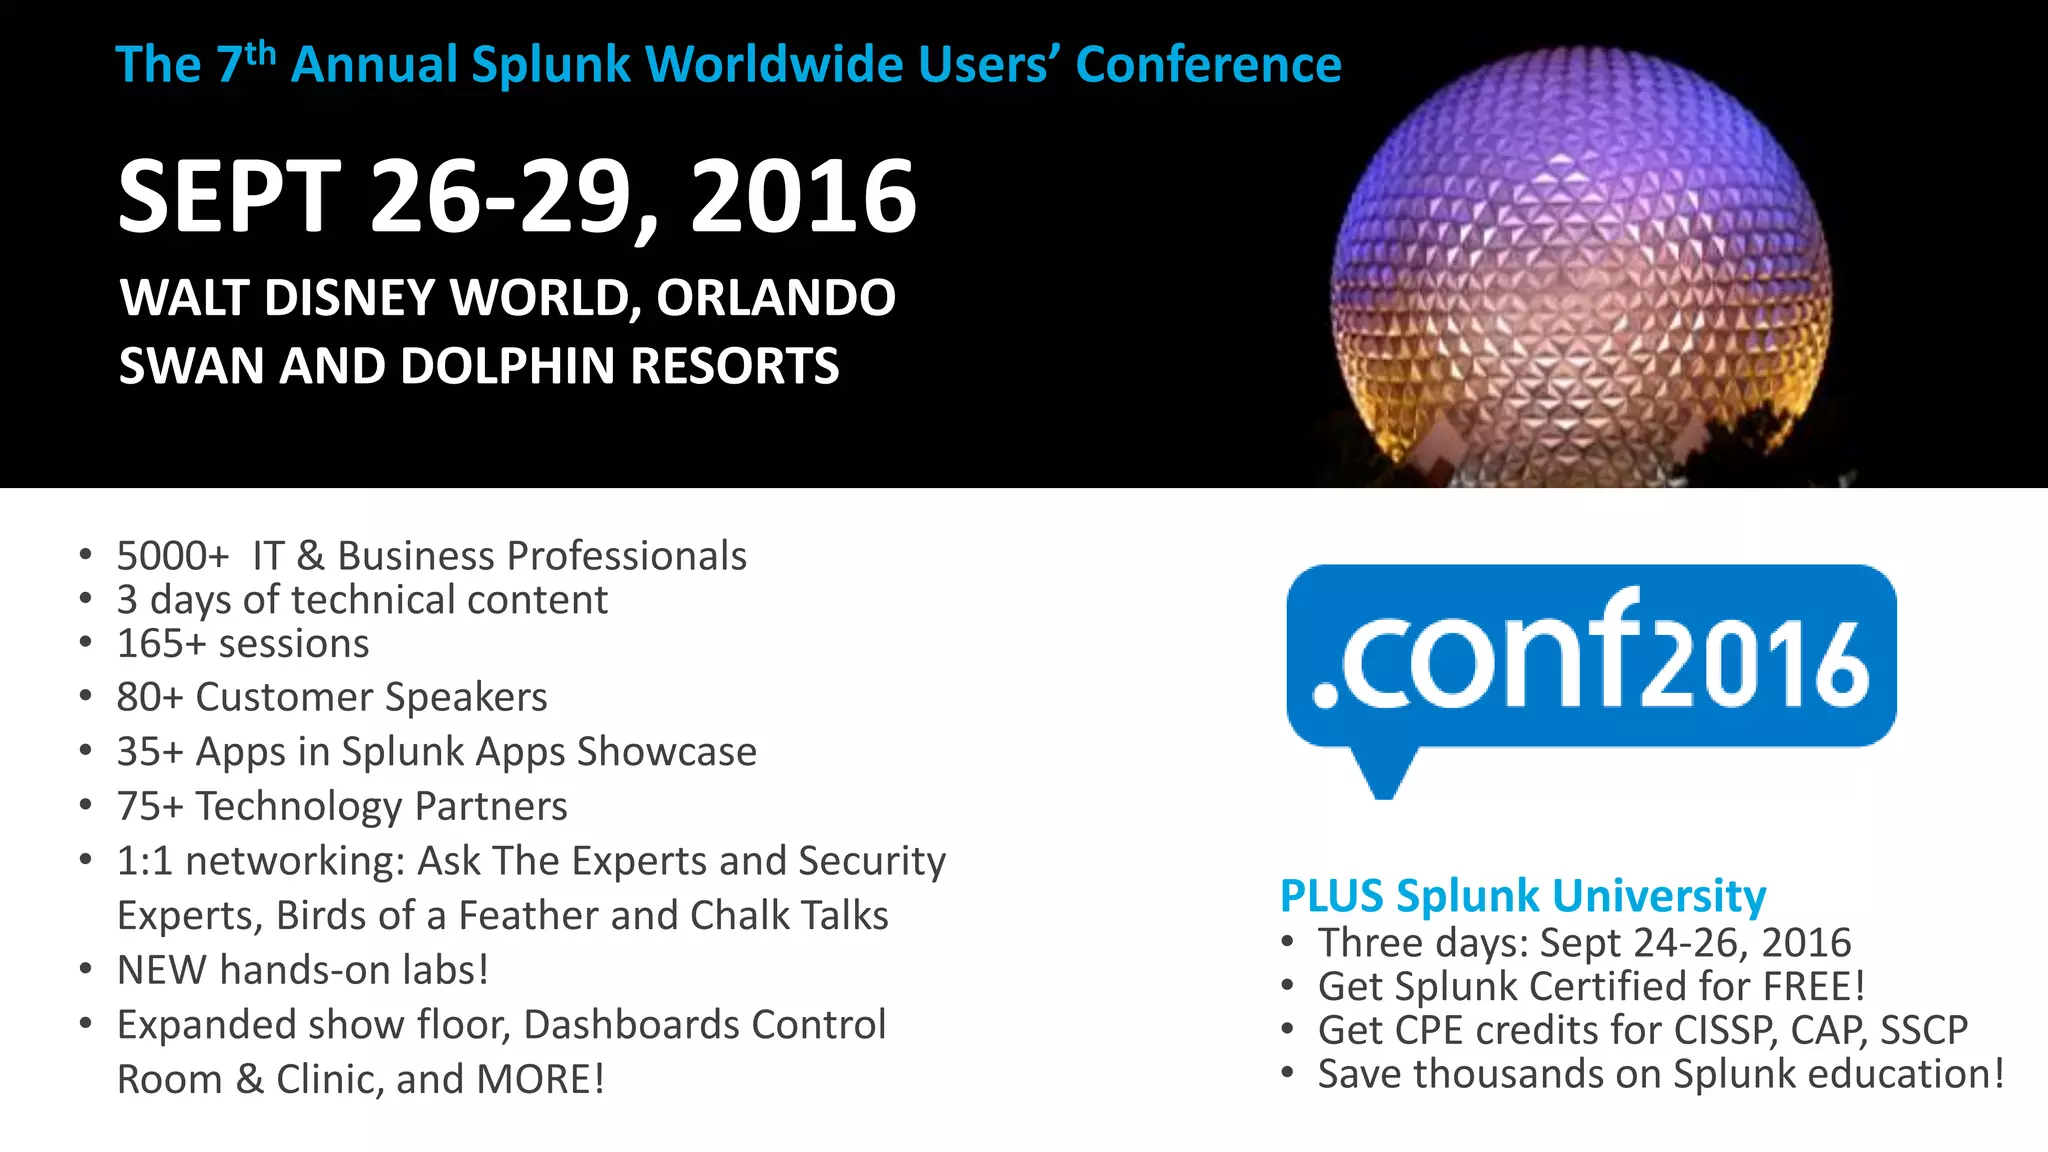
Copyright © 2016 Splunk Inc.
Getting Started with
Splunk Enterprise
Ahmed Kira –
Sr. Sales Engineer
Agenda
1. Download Splunk (if you haven’t already)
2. My take on Why Splunk ROCKS!
3. Using Splunk (Live Demonstration/Walkthrough)
• Installing & Onboard Data
• Searching
• Field Extraction
• Dashboards
• Alerting
• Analytics
• Pivot Interface
4. Splunk Deployment Architecture
5. Splunk Communities, Q&A
3
Safe Harbor Statement
During the course of this presentation, we may make forward-looking statements regarding future
events or the expected performance of the company. We caution you that such statements reflect our
current expectations and estimates based on factors currently known to us and that actual events or
results could differ materially. For important factors that may cause actual results to differ from those
contained in our forward-looking statements, please review our filings with the SEC. The forward-
looking statements made in this presentation are being made as of the time and date of its live
presentation. If reviewed after its live presentation, this presentation may not contain current or
accurate information. We do not assume any obligation to update any forward-looking statements
we may make. In addition, any information about our roadmap outlines our general product direction
and is subject to change at any time without notice. It is for informational purposes only and shall
not be incorporated into any contract or other commitment. Splunk undertakes no obligation either
to develop the features or functionality described or to include any such feature or functionality in a
future release.
3
Ahmed Kira
Sr. Sales Engineer, Enterprise
San Francisco Bay Area, CA
18 years in IT Operations,
Network Engineering, and Data
Analytics
Cal Berkeley Class of ‘95. GO
BEARS!
5
Northern Cal Tech Talks!
Monthly WebEx Sessions
• Ted Talk style presentation
• Q&A Chat forum
So what’s next on the agenda?
• March 23rd @ 10AM PST - Building &
Deploying Apps.
• April 20th @ 10AM PST - Top 5 most useful
search commands.
See more at:
http://live.splunk.com/NorCalTechTalks
6
IT Service
Intelligence
ITSI
Mainframe
Data
VMware
Platform for Machine Data
Splunk also offers a wealth of apps
to address many use cases
Exchange PCISecurity
DB Connect MobileForwarders
Syslog /
TCP / Other
Sensors &
Control Systems
Rich Ecosystem of Apps
Stream
Passionate
and Vibrant
Community
750 1000 free
apps on
apps.splunk.comPacket Analysis
(Wire Data)
- App Response Time
- Detect unauthorized
access
Import & Correlate
external DB data
- 3rd party tools
- Enrich data already in Splunk
Place Splunk search & analytics
on top of Hadoop/noSQL
cluster
Mobile Application
Performance Management
(APM)
- App Crashes
- User Experience
Installing & Using
Splunk
(Live Demonstration &
Walk-along)
8
1.
2.
3.
4.
Getting Started
Download
Install & Start
Forward Data
Search
Databases
Networks
Servers
Virtual
Machines
Smart
phones
and
Devices
Custom
Applications
Security
WebServer
Sensors
Four steps:
Let’s get out hands dirty!
Install & Initial Setup
10
Download the sample file, follow this link and save the file to your
desktop, IMPORT THE ZIP FILE, not individual files within it:
http://www.splunkbook.com
(sample data is located under ‘related links’ section)
To add the file to Splunk:
– Click Add Data
– Click Upload files from my computer.
– Drag and drop you sample data zip file.
– Add a new Index
– Review and Finish.
Getting Data into Splunk
We will import
sample web
ecommerce store
events
11
Search All Your Machine Data
Search all your data
Results right away
Schema on the fly
• Search across real-time and historical
data
• Over 135 search commands built in
• See results instantly
Data
ParsingQueue
Parsing Pipeline
• Source, event typing
• Character set
normalization
• Line breaking
• Timestamp
identification
• Regex transforms
Indexing
Pipeline
Real-
time
Buffer
Raw data
Index Files
Real-time
Search
Process
Monitor
Input IndexQueue
TCP/UDP
Input
Scripted
Input
Splunk
Index
Time to use the
magnifying glass
13
Schema-on-the-fly
Raw events
Auto-detected fields and values
What If I want
to create my
own field
extraction?
Like the target
URL field?
Report & Dashboard
1
Proactive
notifications
18
Actionable Alerting
Alerts
• Create alerts based on any
search
• Customize content and
format of email alerts
• Provide context
• Highlight next steps
• Enable custom workflows
• Trigger an action
• SMS alert
• SNMP trap
• Other
19
Data Analysis
Over 135 different analytic
commands
– Transaction
– Anomaly Detection
– Prediction
Geospatial Visualization
– Visualizes metric variance across a
customizable geographic area
Single Value Display
– At-a-glance, single-value indicators
with useful context
1
20
Alternative to Search Language: Pivot Interface
• Drag-and-drop interface
enables any user to analyze
data
• Create complex queries and
reports without learning
search language
• Click to visualize any chart
type; reports dynamically
update when fields change
Select fields from
data model
Time window
All chart types available in the chart toolbox
Save report
to share
Pivot
Deployments &
Architecture
22
Single Instance or Distributed?
Single environment Distributed Environment
Recommended Specs:
6X2 Core CPUs/12GB
RAM/800+ IOPs
A Splunk install can be one or all roles…
23
Scales to Hundreds of TBs/Day
Enterprise-class Scale, Resilience and Interoperability
Collect machine data from thousands sources via Splunk forwarders
Compress and store data on Splunk Indexers
Initiate searches and visualize results via Search Heads
Forwarders
Indexer
Search Head
24
Scalability & High Availability
Forwarders load balance across
Indexers
Indexed data can be replicated across
peers and different physical sites
Search Heads can be Clustered to
eliminate single point of failure and
handle large search loads
25
Over 1000 Apps @ http://apps.splunk.com
2
26
Time to start SPLUNKING!!!
Where do I go
for help?
Documentation
– http://www.splunk.com/base/Documentation
Technical Support
– http://www.splunk.com/support
Videos
– http://www.splunk.com/videos
Education
– http://education.splunk.com
Community
– http://answers.splunk.com
• Splunk Book
– http://splunkbook.com
27
SEPT 26-29, 2016
WALT DISNEY WORLD, ORLANDO
SWAN AND DOLPHIN RESORTS
• 5000+ IT & Business Professionals
• 3 days of technical content
• 165+ sessions
• 80+ Customer Speakers
• 35+ Apps in Splunk Apps Showcase
• 75+ Technology Partners
• 1:1 networking: Ask The Experts and Security
Experts, Birds of a Feather and Chalk Talks
• NEW hands-on labs!
• Expanded show floor, Dashboards Control
Room & Clinic, and MORE!
The 7th Annual Splunk Worldwide Users’ Conference
PLUS Splunk University
• Three days: Sept 24-26, 2016
• Get Splunk Certified for FREE!
• Get CPE credits for CISSP, CAP, SSCP
• Save thousands on Splunk education!
2
Thank You
29
Queries used in session
All errors events:
– index=* sourcetype=access_combined_wcookie status != 200
Hits by uri_path (perfect for a pie chart):
– index=* sourcetype=access_combined_wcookie | stats count by uri_path
Timechart of error by HTTP code:
– index=* sourcetype=access_combined_wcookie status != 200| timechart count by
status limit=10
Timechart of errors by URL:
– index=* sourcetype=access_combined_wcookie status != 200 | timechart count by
uri_path
Charting options for
timechart
30
Queries used in session
Long Transactions
index=* sourcetype=access_combined_wcookie
| transaction maxspan=1m JSESSIONID clientip
| table clientip duration
| where duration>10
| sort –duration
Anomalies:
index=* sourcetype=access_combined_wcookie status!=200
|timechart count | anomalies
index=* sourcetype=access_combined_wcookie status!=200
| timechart count | anomalous values
Prediction/Projection:
index=* sourcetype=access_combined_wcookie status!=200 |
timechart count | predict count
index=* sourcetype=access_combined_wcookie status!=200 |
timechart span=2h count | predict future_timespan=100 count
Sample query to return all available geo
values for an IP:
index=* sourcetype=access_combined_wcookie
| iplocation prefix=iploc_ allfields=true clientip | fields iploc_* clientip
Sample query to map the location by city:
index=* sourcetype=access_combined_wcookie
| iplocation allfields=true clientip
| geostats count by City
Leveraging Chloropleth feature in Splunk
6.3 to map by country:
index=* sourcetype=access_combined_wcookie
| iplocation allfields=true clientip
| eval featureId=Country
|stats count by featureId
| geom geo_countries
NOTE: If some queries don’t work, there might be
some foreign characters. Try placing one line.
31
Field Extractions
1. Perform a search for a
specific sourcetype
2. Expand an event of interest
and select ‘Extract Fields’
3. From Field Extraction UI,
select ‘regular expression’
4. Highlight the field of
interest, and define a field
name
5. Add a non-matching event
(from the non-matching
events tab)
6. Add desired text to match
7. Go through remaining steps

Getting Started with Splunk Enterprise Hands-On

  • 1.
    Copyright © 2016Splunk Inc. Getting Started with Splunk Enterprise Ahmed Kira – Sr. Sales Engineer
  • 2.
    Agenda 1. Download Splunk(if you haven’t already) 2. My take on Why Splunk ROCKS! 3. Using Splunk (Live Demonstration/Walkthrough) • Installing & Onboard Data • Searching • Field Extraction • Dashboards • Alerting • Analytics • Pivot Interface 4. Splunk Deployment Architecture 5. Splunk Communities, Q&A
  • 3.
    3 Safe Harbor Statement Duringthe course of this presentation, we may make forward-looking statements regarding future events or the expected performance of the company. We caution you that such statements reflect our current expectations and estimates based on factors currently known to us and that actual events or results could differ materially. For important factors that may cause actual results to differ from those contained in our forward-looking statements, please review our filings with the SEC. The forward- looking statements made in this presentation are being made as of the time and date of its live presentation. If reviewed after its live presentation, this presentation may not contain current or accurate information. We do not assume any obligation to update any forward-looking statements we may make. In addition, any information about our roadmap outlines our general product direction and is subject to change at any time without notice. It is for informational purposes only and shall not be incorporated into any contract or other commitment. Splunk undertakes no obligation either to develop the features or functionality described or to include any such feature or functionality in a future release. 3
  • 4.
    Ahmed Kira Sr. SalesEngineer, Enterprise San Francisco Bay Area, CA 18 years in IT Operations, Network Engineering, and Data Analytics Cal Berkeley Class of ‘95. GO BEARS!
  • 5.
    5 Northern Cal TechTalks! Monthly WebEx Sessions • Ted Talk style presentation • Q&A Chat forum So what’s next on the agenda? • March 23rd @ 10AM PST - Building & Deploying Apps. • April 20th @ 10AM PST - Top 5 most useful search commands. See more at: http://live.splunk.com/NorCalTechTalks
  • 6.
    6 IT Service Intelligence ITSI Mainframe Data VMware Platform forMachine Data Splunk also offers a wealth of apps to address many use cases Exchange PCISecurity DB Connect MobileForwarders Syslog / TCP / Other Sensors & Control Systems Rich Ecosystem of Apps Stream Passionate and Vibrant Community 750 1000 free apps on apps.splunk.comPacket Analysis (Wire Data) - App Response Time - Detect unauthorized access Import & Correlate external DB data - 3rd party tools - Enrich data already in Splunk Place Splunk search & analytics on top of Hadoop/noSQL cluster Mobile Application Performance Management (APM) - App Crashes - User Experience
  • 7.
    Installing & Using Splunk (LiveDemonstration & Walk-along)
  • 8.
    8 1. 2. 3. 4. Getting Started Download Install &Start Forward Data Search Databases Networks Servers Virtual Machines Smart phones and Devices Custom Applications Security WebServer Sensors Four steps:
  • 9.
    Let’s get outhands dirty! Install & Initial Setup
  • 10.
    10 Download the samplefile, follow this link and save the file to your desktop, IMPORT THE ZIP FILE, not individual files within it: http://www.splunkbook.com (sample data is located under ‘related links’ section) To add the file to Splunk: – Click Add Data – Click Upload files from my computer. – Drag and drop you sample data zip file. – Add a new Index – Review and Finish. Getting Data into Splunk We will import sample web ecommerce store events
  • 11.
    11 Search All YourMachine Data Search all your data Results right away Schema on the fly • Search across real-time and historical data • Over 135 search commands built in • See results instantly Data ParsingQueue Parsing Pipeline • Source, event typing • Character set normalization • Line breaking • Timestamp identification • Regex transforms Indexing Pipeline Real- time Buffer Raw data Index Files Real-time Search Process Monitor Input IndexQueue TCP/UDP Input Scripted Input Splunk Index
  • 12.
    Time to usethe magnifying glass
  • 13.
  • 14.
    What If Iwant to create my own field extraction? Like the target URL field?
  • 15.
  • 16.
  • 17.
    18 Actionable Alerting Alerts • Createalerts based on any search • Customize content and format of email alerts • Provide context • Highlight next steps • Enable custom workflows • Trigger an action • SMS alert • SNMP trap • Other
  • 18.
    19 Data Analysis Over 135different analytic commands – Transaction – Anomaly Detection – Prediction Geospatial Visualization – Visualizes metric variance across a customizable geographic area Single Value Display – At-a-glance, single-value indicators with useful context 1
  • 19.
    20 Alternative to SearchLanguage: Pivot Interface • Drag-and-drop interface enables any user to analyze data • Create complex queries and reports without learning search language • Click to visualize any chart type; reports dynamically update when fields change Select fields from data model Time window All chart types available in the chart toolbox Save report to share Pivot
  • 20.
  • 21.
    22 Single Instance orDistributed? Single environment Distributed Environment Recommended Specs: 6X2 Core CPUs/12GB RAM/800+ IOPs A Splunk install can be one or all roles…
  • 22.
    23 Scales to Hundredsof TBs/Day Enterprise-class Scale, Resilience and Interoperability Collect machine data from thousands sources via Splunk forwarders Compress and store data on Splunk Indexers Initiate searches and visualize results via Search Heads Forwarders Indexer Search Head
  • 23.
    24 Scalability & HighAvailability Forwarders load balance across Indexers Indexed data can be replicated across peers and different physical sites Search Heads can be Clustered to eliminate single point of failure and handle large search loads
  • 24.
    25 Over 1000 Apps@ http://apps.splunk.com 2
  • 25.
    26 Time to startSPLUNKING!!! Where do I go for help? Documentation – http://www.splunk.com/base/Documentation Technical Support – http://www.splunk.com/support Videos – http://www.splunk.com/videos Education – http://education.splunk.com Community – http://answers.splunk.com • Splunk Book – http://splunkbook.com
  • 26.
    27 SEPT 26-29, 2016 WALTDISNEY WORLD, ORLANDO SWAN AND DOLPHIN RESORTS • 5000+ IT & Business Professionals • 3 days of technical content • 165+ sessions • 80+ Customer Speakers • 35+ Apps in Splunk Apps Showcase • 75+ Technology Partners • 1:1 networking: Ask The Experts and Security Experts, Birds of a Feather and Chalk Talks • NEW hands-on labs! • Expanded show floor, Dashboards Control Room & Clinic, and MORE! The 7th Annual Splunk Worldwide Users’ Conference PLUS Splunk University • Three days: Sept 24-26, 2016 • Get Splunk Certified for FREE! • Get CPE credits for CISSP, CAP, SSCP • Save thousands on Splunk education!
  • 27.
  • 28.
    29 Queries used insession All errors events: – index=* sourcetype=access_combined_wcookie status != 200 Hits by uri_path (perfect for a pie chart): – index=* sourcetype=access_combined_wcookie | stats count by uri_path Timechart of error by HTTP code: – index=* sourcetype=access_combined_wcookie status != 200| timechart count by status limit=10 Timechart of errors by URL: – index=* sourcetype=access_combined_wcookie status != 200 | timechart count by uri_path Charting options for timechart
  • 29.
    30 Queries used insession Long Transactions index=* sourcetype=access_combined_wcookie | transaction maxspan=1m JSESSIONID clientip | table clientip duration | where duration>10 | sort –duration Anomalies: index=* sourcetype=access_combined_wcookie status!=200 |timechart count | anomalies index=* sourcetype=access_combined_wcookie status!=200 | timechart count | anomalous values Prediction/Projection: index=* sourcetype=access_combined_wcookie status!=200 | timechart count | predict count index=* sourcetype=access_combined_wcookie status!=200 | timechart span=2h count | predict future_timespan=100 count Sample query to return all available geo values for an IP: index=* sourcetype=access_combined_wcookie | iplocation prefix=iploc_ allfields=true clientip | fields iploc_* clientip Sample query to map the location by city: index=* sourcetype=access_combined_wcookie | iplocation allfields=true clientip | geostats count by City Leveraging Chloropleth feature in Splunk 6.3 to map by country: index=* sourcetype=access_combined_wcookie | iplocation allfields=true clientip | eval featureId=Country |stats count by featureId | geom geo_countries NOTE: If some queries don’t work, there might be some foreign characters. Try placing one line.
  • 30.
    31 Field Extractions 1. Performa search for a specific sourcetype 2. Expand an event of interest and select ‘Extract Fields’ 3. From Field Extraction UI, select ‘regular expression’ 4. Highlight the field of interest, and define a field name 5. Add a non-matching event (from the non-matching events tab) 6. Add desired text to match 7. Go through remaining steps

Editor's Notes

  • #7 The Splunk platform consists of multiple products and deployment models to fit your needs. At the core we have the universal machine data platform that underpins our four key technology offerings. These include: Splunk Enterprise – for on-premise deployments Splunk Cloud – Fully managed service with 100% SLA and all the capabilities of Splunk Enterprise…in the Cloud (currently only available in North America) Hunk – for analytics on data in Hadoop Splunk Mint – to get insights into data from Mobile devices The products can pull in data from virtually any source to support multiple use cases. On top of deployments for Splunk Enterprise and Splunk Cloud, Splunk Apps extend and simplify deployments by providing pre-packaged content designed for specific use cases and data types. There is a rich ecosystem of apps that come from the Splunk community. And there are premium apps that are developed and fully supported by Splunk. You see those at the top here. For the rest of the presentation, we’ll focus on explaining Splunk Enterprise.
  • #9 It only takes minutes to download and install Splunk on the platform of your choice, bringing you fast time to value. Once Splunk has been downloaded and installed the next step is to get data into a Splunk instance. The data then becomes searchable from a single place! Since Splunk stores only a copy of the raw data, searches won’t affect the end devices data comes from. Having a central place to search your data not only simplifies things, it also decreases risk since a user doesn’t have to log into the end devices. Splunk can be installed on a single small instance, such as a laptop, or installed on multiple servers to scale as needed. The ability to scale from a single desktop to an enterprise is another of our key differentiators. When installed on multiple servers the functions can be split up to meet any performance, security, or availability requirements.
  • #12 Allows you to search all your data in one place in real time. The search interface operates very similar to doing a search on any web search engine. Any user can become powerful very quickly with preexisting knowledge of using a search engine; however, Splunk has created over 100 commands (135 published) to make analyzing the data quicker and easier. <This is a great time to start a demo and show the search language if giving a demo> The schema on the fly approach is a key differentiator with Splunk.
  • #14 Applying a schema at the last possible moment allows for the greatest flexibility when asking questions of your data. Splunk enterprise will atomically extract the values from the fields in events. If the data source is updated and new fields are added or the format of the events change Splunk does not need to re-index the data. Sometimes the raw event doesn’t contain useful enough information and it needs to be enriched.
  • #19 Alerts are triggered when certain conditions are met by the results of the search upon which it is based. Alerts can be based on both historical and real-time searches. When an alert is triggered, it performs an alert action. This action can be the sending of the alert information to a designated set of email addresses, or the posting of the alert information to an RSS feed. Alerts can also be set up to run a custom script when they are triggered. You can base these alerts on a wide range of threshold and trend-based scenarios, including empty shopping carts, brute force firewall attacks, and server system errors.
  • #20 Splunk now offers a new set of visualization and analytics features that are targeted to help address user challenges of big data analysis. Enhanced Anomaly detection: Helps you rapidly discover events that merit further investigation Geospatial mapping: Lets you visualize and better communicate results using geographic or custom-defined areas Single value display: Gives you "at-a-glance" indicators and relevant contextual data for war-room displays and management discussions Sample commands: TRANSACTION index=* sourcetype=access_combined_wcookie | transaction JSESSIONID clientip index=* sourcetype=access_combined_wcookie | transaction maxspan=1m JSESSIONID clientip | table clientip duration | where duration>10 | sort -duration ANOMALY index=* sourcetype=access_combined_wcookie status!=200 | timechart count | anomalies index=* sourcetype=access_combined_wcookie status!=200 | timechart count | anomalous values PREDICT index=* sourcetype=access_combined_wcookie status!=200 | timechart count | predict count index=* sourcetype=access_combined_wcookie status!=200 | timechart span=2h count | predict future_timespan=100 count
  • #21 The Pivot interface enables non-technical and technical users alike to quickly generate sophisticated charts, visualizations and dashboards using simple drag and drop and without learning the Search Processing Language (SPL). Users can access different chart types from the Splunk toolbox to easily visualize their data different ways. Queries using the Pivot interface are powered by underlying “data models” which define the relationships in Machine Data.
  • #24 Splunk Forwarders are lightweight components which collect Machine data throughout your environment. Forwarder deployment is highly customizable, you can have the forwarder remotely collect data or place the forwarder locally on hundreds of thousands of devices as some of our customers do. Forwarders automatically load-balance their collected machine data across a pool of Indexers, which scale horizontally on commodity hardware to adjust to your growing pool of Machine Data. Search Heads initiate map-reduced searches across the indexer tier, combine and return the results to the Splunk console or your interface of choice. Like Indexers, Search Heads can scale horizontally to meet your needs on commodity hardware.
  • #26 More than 1000 are available for download on our Website. These Apps significantly reduce the time to value and make it easy for customers to extend their visibility across common sources or use cases.
  • #28 We’re headed to the East Coast! 2 inspired Keynotes – General Session and Security Keynote + Super Sessions with Splunk Leadership in Cloud, IT Ops, Security and Business Analytics! 165+ Breakout sessions addressing all areas and levels of Operational Intelligence – IT, Business Analytics, Mobile, Cloud, IoT, Security…and MORE! 30+ hours of invaluable networking time with industry thought leaders, technologists, and other Splunk Ninjas and Champions waiting to share their business wins with you! Join the 50%+ of Fortune 100 companies who attended .conf2015 to get hands on with Splunk. You’ll be surrounded by thousands of other like-minded individuals who are ready to share exciting and cutting edge use cases and best practices. You can also deep dive on all things Splunk products together with your favorite Splunkers. Head back to your company with both practical and inspired new uses for Splunk, ready to unlock the unimaginable power of your data! Arrive in Orlando a Splunk user, leave Orlando a Splunk Ninja! REGISTRATION OPENS IN MARCH 2016 – STAY TUNED FOR NEWS ON OUR BEST REGISTRATION RATES – COMING SOON!