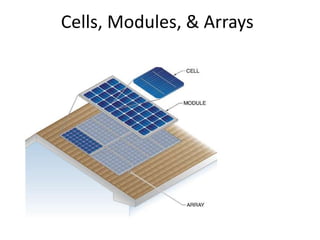
9. PV Efficiencies (www.wikipedia.com)
• 1883 - less than 1% efficiency
• 1954 – AT&T labs marks 6% efficiency.
• 1955 - 2% efficient commercial solar cell for $25/cell or $1,785/Watt.
• 1957 - 8% efficient commercial solar cell
• 1958 - 9% efficient commercial solar cells
• 1959 - 10% efficient commercial solar cell
• 1960 - 14% efficient commercial solar cell
• 1976 - first amorphous silicon PV cells have an efficiency of 1.1%
• 1980 - thin-film solar cell exceeding 10% efficiency
• 1985 - 20% efficient silicon cell
• 1989 - Reflective solar concentrators are first used with solar cells.
• 1994 - concentrator cell (180 suns) becomes the first solar cell to exceed
30% conversion efficiency
• 2005 - Solar cells in modules convert around 17% of visible incidental
radiant energy
11. PV Modules
• Many sizes and types available (5
– 435 watts)
• Efficiencies 6 – 21%
• Cells in series: 36 – 150
• 36 – 60 – 72 cells most common
• 25 year warranties
• Currently ~$1/watt or less for
most large modules bought in
significant quantities
16. Silicon Cell Voltage
• .5 - .6 volts/cell
• Not related to size
• Voltage affected by
temperature
• Open circuit voltage
• Maximum power voltage
• For Sharp 80 watt (36 cells)
• Voc = 21.6/36 = .6 Voc/cell
17.
18. Silicon Cell Current Production
• Related to size of cell
• .2 amps/square inch or .03
amps (30 milliamps) per
square centimeter
• Affected by irradiance
primarily
• Short Circuit Current
– Used to determine
maximum current
– Isc X 1.56 to estimate
maximum current for
wire sizing
• Maximum Power Current
19. If a module has a short-circuit
current of 8 amps at 1000 w/m2,
what would the short circuit current
be at 623 watts/m2?
– 623 watts/m2 ÷ 1000 watts/m2
= .623 or 62.3%
– 8 A x .623 = 4.98 A
Amperage is proportional to irradiance
20. Two factors that affect PV Module
Performance
• Temperature
• Irradiance (solar power)
21. Response to Temperature
Voltage
T = 0 oC
T = 25 oC
T = 50 oC
Increasing
temperature
reduces
voltage
Increasing temperature
reduces power output
Increasing temperature
increases current slightly
Decreasing
temperature
increases
voltage
22. Response to Irradiance
Voltage
1000 W/m2
750 W/m2
500 W/m2
250 W/m2
Current increases proportionally
increasing irradiance
Voltage changes
insignificantly with
irradiance
Maximum power voltage
changes little with
irradiance
IV Curves at Constant Temperature
36. Calculating maximum voltage and
maximum string size
Example: How many modules, each having a Voc of 36.5 V can be
placed in a series string without exceeding the 600 volt limit of a grid tie
inverter when the record low temperature is -30 C?
Voc = 36.5 volts x 1.25 = 45.62 Voc
600 volt inverter/45.62= 13 modules
http://www.solarabcs.org/about/publications/reports/expedited-permit/map/index.html
39. Open Circuit Voltage Temperature Coefficient
(% change per degree C)
• Example
– How many Sharp 216 watt modules, each having a Voc of
36.5 V and temperature coefficient of -0.36%/C, can be
placed in a series string without exceeding the 600 volt
limit of a grid tie inverter when the record low
temperature is -31 C?
• -0.36%/C = .36/100 = .0036
• .0036 x 36.5 V = .13 V/C
• Delta T = 25C to – 31 = 56 C
• .13 V/C x 56 = 7.28 volts
• 36.5 Voc + 7.28 volts = 43.78 Voc @ -31C
• 600 V/43.78= 13.7 modules = 13 modules max per
string
40. • Cost
• Aesthetics
• Material Warranty (years)
– Range of 1 – 10 years
• Power Warranty (Years) – limited warranty for
module power at STC minus power tolerance
percentage (+/- 5%)
– 20 years common at 90% for first 10 years
and 80% for next 10 years (100 watts x .95
x .90 = 85.5 watts)
• Power Density/Efficiency
Choosing a module
45. Field Serviceable Junction
Box:
Less common today and
found primarily on smaller
modules
Sealed Junction Box:
Most common, safer to
wire, but usually cannot
replace leads
Courtesy Homepower Magazine/Kris SUtton
Module J-Box
46. • 1000 watts of
crystalline PV fits in
~100 square feet.
How much space is needed?
• Thin film efficiency
is about half, so
500 watts of thin
film in ~100 square
feet
47. How many modules do you need?
• Each KW of PV array (4 – 250 watt modules) can
produce about 1,000 KWH/year.
• Average American House uses 10,000 KWH/year
• 10,000 KWH/year / 1000 KWH/KW = 10 KW
• 10 KW = 10,000 Watts/250 watts = 40 modules
Editor's Notes
The main purpose of this and the subsequent slides is to show the students photos of the different technologies and how they appear when installed. Point out the physical characteristics (the dead white space in the mono panels for example).
The white box with the statistics is there to give the students a feel for the overall similarities and differences. Don’t spend too much time getting into the meanings of all the items, just relate them all to one another.
It is good to point out that this is just one type of amorphous panel, this manufacturer, Unisolar, makes framed versions as well that are mounted like crystalline framed modules.
This is the first demonstration of how temperature affects voltage and current. The point of this slide is to show how voltage has a dramatic change with temperature while current change is minimal.
This is a good place to introduce the term “inversely proportional” in respect to temperature and voltage. We don’t need to get too far into specifics here, just show the general concept and how the IV curves move around.
Another way to look at the effect of irradiance on current values. Since they got the concept in the last slide, this slide is intended to get them to evaluate how the IV curve is changed and even apply some math to determine the current values over varying irradiance values. Point out how the curves are shifting in the vertical dimension much more than the horizontal. You can even give a Isc value for a module at STC conditions and get them to calculate the new values for different irradiance values. This will come up again in the next slide so make sure they are aware of the way to accomplish it. Ask students to ID different points on the curves (Voc, Isc…)