Download to read offline
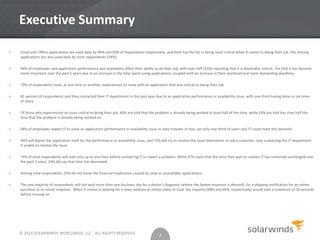
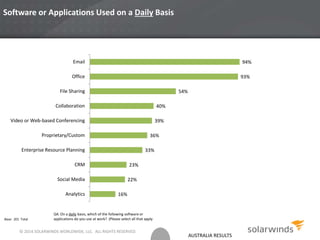
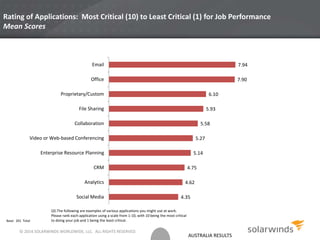
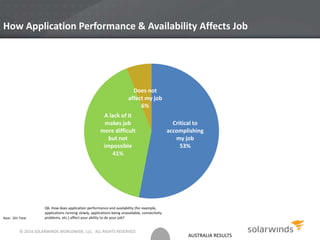
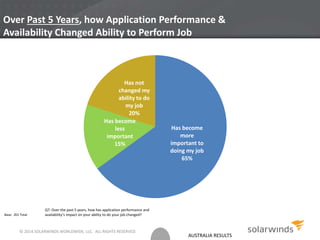
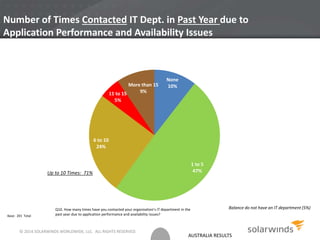
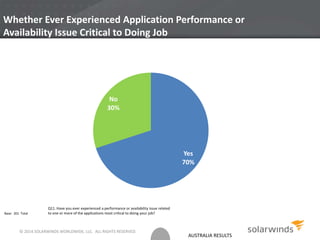
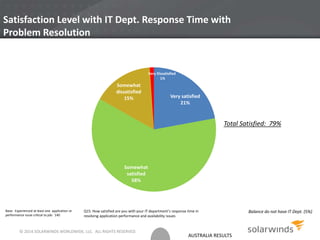
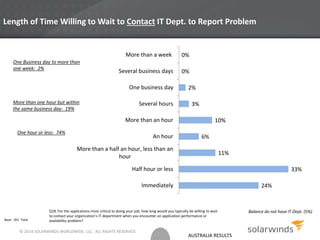
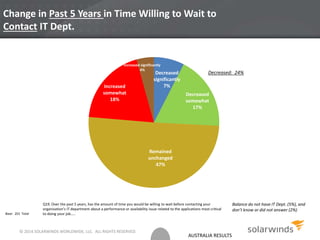
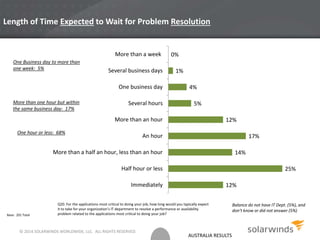
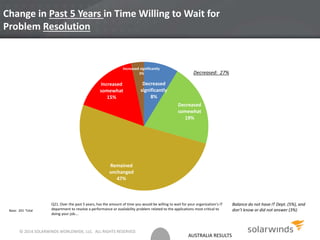
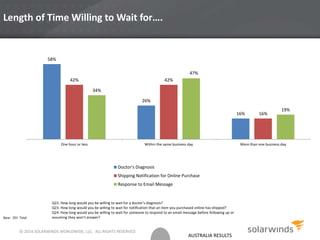


A survey conducted in July 2014 found that 94% of employees in Australia rely on email and office applications daily, with 94% asserting that application performance impacts their job. Many employees expect quick resolutions from IT for performance issues, with only 33% feeling their expectations are met. Overall, 70% of respondents reported encountering critical application issues, demonstrating a strong need for effective IT support and improved application reliability.


![5G Explained! A High Level Overview [Introduction]](https://cdn.slidesharecdn.com/ss_thumbnails/5gexplainedahighleveloverview-260119165306-cc137a3e-thumbnail.jpg?width=640&height=640&fit=bounds)


