Health & Safety KPI Dashboard
•
0 likes•450 views

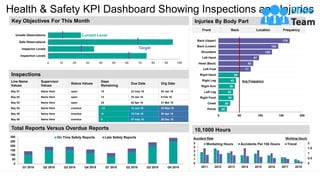
The document contains various health and safety metrics and key performance indicators for an organization. It includes graphs showing the number of safety inspections and injuries by body part over time. It also shows the number of on-time versus overdue safety reports on a quarterly basis from 2018 to present. Additionally, it displays accident rates and working hours trends from 2011 to 2018. Finally, it lists the key objectives for the current month related to inspection levels, inspector levels, and safe/unsafe observations against targets.

Recommended
Recommended
More Related Content
What's hot
What's hot (20)
Similar to Health & Safety KPI Dashboard
Similar to Health & Safety KPI Dashboard (20)
More from SlideTeam
More from SlideTeam (20)
Recently uploaded
Recently uploaded (20)
Health & Safety KPI Dashboard
- 1. Line Name Values Supervisor Values Status Values Days Remaining Due Date Org Date Bay 01 Name Here open 10 23 may 18 02 Jan 18 Bay 02 Name Here open 13 10 Jan 18 9 Feb 18 Bay 03 Name Here open 24 02 Apr 18 21 Mar 18 Bay 04 Name Here overdue -13 12 Jun 18 25 May 18 Bay 05 Name Here overdue -9 15 Feb 18 08 Apr 18 Bay 06 Name Here overdue 0 07 may 18 26 Dec 18 Health & Safety KPI Dashboard Showing Inspections and Injuries Front Back Location Frequency Injuries By Body Part Inspections 20 28 36 35 39 42 50 77 83 97 128 143 170 0 50 100 150 200 Pelvis Chest Right Food Left Leg Right Arm Right Leg Right Hand Left Foot Head (Back) Left Hand Shoulders Back (Lower) Back (Upper) Total Reports Versus Overdue Reports 0 50 100 150 200 250 300 Q1 2018 Q2 2018 Q3 2018 Q4 2018 Q1 2018 Q2 2018 Q3 2018 Q4 2018 On Time Safety Reports Late Safety Reports 10,1000 Hours 0 0.5 1 1.5 2 0 1 2 3 4 5 2011 2012 2013 2014 2015 2016 2017 2018 Worketing Hours Accidents Per 10k Hours Trend Accident Rate Working Hours Key Objectives For This Month 0 10 20 30 40 50 60 70 80 90 100 Inspection Levels Inspector Levels Safe Observations Unsafe Observations Current Level Target Avg Frequency This graph/chart is linked to excel, and changes automatically based on data. Just left click on it and select “edit data”.
- 2. Instructions To Edit This Slide This slide has been made in PowerPoint using basic PowerPoint shapes, and all graphics are 100% editable in PowerPoint. You can change color, size and orientation of any element to your liking, and add/edit any piece of text anywhere.
- 3. All images are 100% editable in PowerPoint Change color, size and orientation of any icon to your liking”
- 4. 1. Select the Graph and right click -> Select "Edit Data" 2. An excel matrix will automatically show up 3. Enter the values based on your requirements and hit enter 4. The Graph/Chart shape will automatically adjust according to your data, and anytime you can go and change the value again Edit Excel-linked Chart This is a Data Driven Chart/Graph and the shape automatically adjusts according to your data 1 2 3
- 5. Edit Color 1. Select the shape to change the color and Right click the object( click any object which you want to change color) 2. Choose Format Data Series in the dialog box. 3. Choose “Fill” in the Format Shape box then “Solid” or “Gradient” depending on the appearance of the object. Change colour as shown in the picture. 1 2 3
- 6. Select From Thousands Of Editable Icons On Every Topic These icons are available at the Icons section on www.slideteam.net