This document summarizes research on producing activated carbon from lignin through chemical activation using potassium hydroxide (KOH). Lignin was obtained from Douglas fir forest residuals and mixed with KOH at different ratios before being carbonized at various temperatures. Nitrogen adsorption tests showed that pore volume, surface area, and pore size distribution depended on KOH ratio and temperature. Higher temperatures and KOH ratios resulted in more mesoporous carbon with larger surface areas, while lower temperatures produced microporous carbon. The optimal conditions were a KOH:lignin ratio of 3 and temperature of 750°C.
EQUILIBRIUM, KINETIC AND THERMODYNAMIC STUDIES ON BASIC DYE ADSORPTION USING ...
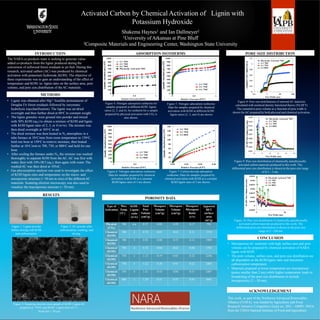
Poster_final_draft_July_23_2015
1. Activated Carbon by ChemicalActivation of Lignin with
Potassium Hydroxide
Shakema Haynes1 and Ian Dallmeyer2
1University ofArkansas at Pine Bluff
2Composite Materials and Engineering Center, Washington State University
INTRODUCTION
The NARAco-products team is seeking to generate value-
added co-products from the lignin produced during the
conversion of softwood forest residuals to jet fuel. During this
research, activated carbon (AC) was produced by chemical
activation with potassium hydroxide (KOH). The objective of
these experiments was to gain an understanding of the effect of
temperature and KOH- to- lignin ratio on the surface area, pore
volume, and pore size distribution of theAC materials.
METHODS
RESULTS
This work, as part of the Northwest Advanced Renewables
Alliance (NARA), was funded byAgriculture and Food
Research Initiative Competitive Grant no. 2011 – 68005- 30416
from the USDANational Institute of Food andAgriculture.
Figure 4: Nitrogen adsorption isotherms for
samples prepared at different KOH :lignin
ratios (2, 3, and 4).An isotherm for a sample
prepared by physical activation with CO2 is
also shown.
Figure 5: Nitrogen adsorption isotherms:
Data for samples prepared by chemical
activation with KOH at different KOH:
lignin ratios (2, 3, and 4) are shown
Figure 6: Nitrogen adsorption isotherms:
Data for samples prepared by chemical
activation with KOH at a constant
KOH:lignin ratio of 3 are shown.
Figure 7: Carbon dioxide adsorption
isotherms: Data for samples prepared by
chemical activation with KOH at a constant
KOH:lignin ratio of 3 are shown.
Figure 8: Pore size distributions of selected AC materials
calculated with nonlocal density functional theory (NLDFT)
The cumulative pore volume as a function of pore width is
shown forAC prepared by both physical and chemical activation.
Figure 9: Pore size distribution of chemically and physically
activated carbon materials produced in this work. The
differential pore size distribution is shown in the pore size range
of 0.3 – 5 nm.
ADSORPTION ISOTHERMS PORE SIZE DISTRIBUTION
Figure 10: Pore size distribution of chemically and physically
activated carbon materials produced in this work. The
differential pore size distribution is shown in the pore size
range of 5 - 100 nm.
• Lignin was obtained after Mg2+ bisulfite pretreatment of
Douglas Fir forest residuals followed by enzymatic
hydrolysis (saccharification). The lignin was air-dried
overnight and then further dried at 60oC to constant weight.
• The lignin granules were ground into powder and mixed
with 50% KOH (aq.) to obtain a mixture of KOH and lignin
with KOH:lignin ratio of 2, 3, or 4 (w/w). The mixture was
then dried overnight at 105oC in air.
• The dried mixture was then heated in N2 atmosphere in a
tube furnace at 10oC/min from room temperature to 150oC,
held one hour at 150oC to remove moisture, then heated
further at 10oC/min to 700, 750, or 800oC and held for one
hour.
• After cooling the furnace under N2, the mixture was washed
thoroughly to separate KOH from theAC.AC was first with
water, then with 10% HCl (aq.), then again with water. The
washedAC was then dried at 105oC.
• Gas physisorption analysis was used to investigate the effect
of KOH:lignin ratio and temperature on the micro- and
mesoporous structure (< 50 nm in size) of the differentAC
materials. Scanning electron microscopy was also used to
visualize the macroporous structure (> 50 nm).
Figure 1: Lignin powder
before mixing with KOH
and carbonization.
Figure 2:AC powder after
carbonization, washing, and
drying.
Figure 3: Scanning electron micrograph of KOH: LigninAC
prepared at 750oC and KOH: Lignin ratio of 3:1.
Scale bar = 30 µm
POROSITY DATA
CONCLUSION
• MicroporousAC materials with high surface area and pore
volume can be prepared by chemical activation of NARA
lignin with KOH.
• The pore volume, surface area, and pore size distribution are
all dependent on the KOH:lignin ratio and maximum
carbonization temperature.
• Materials prepared at lower temperature are microporous
(pores smaller than 2 nm) while higher temperature leads to
broadening of the pore size distribution to include
mesoporosity (2 – 50 nm).
ACKNOWLEDGEMENT
Type of
Activation
Max.
Temp.
(oC)
KOH:
Lignin
ratio
(w/w)
Total
Pore
Volume
(cm3/g)
Mesopore
Volume
(cm3/g)
Micropore
Volume
(cm3/g)
Mesopore/
Micropore
Ratio
(v/v)
Apparent
BET
surface
area
(m2/g)
Physical
(CO2)
700 n/a 0.37 0.05 0.29 0.17 791
Chemical
(KOH)
700 2 0.78 0.07 0.63 0.11 1719
Chemical
(KOH)
700 3 0.92 0.08 0.73 0.11 1989
Chemical
(KOH)
700 4 0.74 0.04 0.62 0.06 1705
Chemical
(KOH)
750 2 1.13 0.19 0.83 0.23 2236
Chemical
(KOH)
750 3 1.22 0.20 0.91 0.22 2405
Chemical
(KOH)
750 4 1.41 0.43 0.84 0.51 2487
Chemical
(KOH)
800 3 1.20 0.51 0.55 0.93 1691