
Recommended
Recommended
More Related Content
What's hot
What's hot (18)
Viewers also liked
Similar to CH5
Similar to CH5 (20)
More from Sergy Kasyanov
CH5
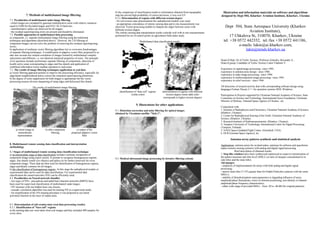
- 1. 7. Methods of multichannel image filtering. 7.1. Peculiarities of multichannel radar image filtering - initial images are corrupted by gaussian multiplicative noise with relative variances equal to 0.004 for Ka-band images and 0.011 for X-band one; - nuninformative spikes are observed for all images; - the residual superimposing errors are present and should be eliminated. 7.2. Possible approaches to multichannel data processing a) component, i.e. separate multichannel image filtering using the traditional techniques and algorithms (described above). However, the 2-D filtering of component images can not solve the problem of removing the residual superimposing errors; b) application of nonlinear vector filtering algorithms lets to overcome disadvantages of separate filtering techniques. A modification of adaptive vector filter proposed by us take into account low mutual correlation of images formed by multichannel complex subsystems and different, i.e. not identical statistical properties of noise. The principle of its operation includes preliminary separate filtering of components, detection of locally active areas corresponding to edges and fine details and application of combined subwindow/vector median operation to such areas. 7.3. The results of image filtering techniques application to real data a) vector filtering approach permits to improve the processing efficiency, especially for edge/detail neighbourhood and to correct the remained superimposing distortions. b) the degree of noise suppression for both images is appropriate but the vector processing ensures obvious sharpening of ramp edges and defocused fine details. The results of multichannel image filtering: a) initial image in monochrome representation b) after component filtering c) output of the proposed adaptive vector filter 8. Multichannel remote sensing data classification and interpretation methodology 8.1 Stages of multichannel remote sensing data classification technique a) an intermediate stage of data classification includes a primary recognition of component image using expert system. It permits to recognize homogeneous regions, edges, fine details (small size objects) and spikes (to be further removed) for every component image. These data are then used for identification of homogeneous regions, edges and details common for all images; b) the classification of homogeneous regions. At this stage the radiophysical models or experimental data can be used for data classification. For experimental data classification the neural networks (NN) can be efficiently used; 8.2. Peculiarities on Neural network classifier - two types of NNs - perceptrons and radial basis function networks (RBFN) have been used for supervised classification of multichannel radar images; - NN structure with one hidden layer was chosen; - cascade- correlation algorithm was used for training NN in a supervised mode; - for simplification of the NN training procedure it was proposed to use linear activation function in the layer of output units. 8.3. Determination of soil erosion state (real data processing results) 8.3.1. Identification of "bare soil" regions a) the training data sets were taken from real images and they included 400 samples for every class; b) the comparison of classification results to information obtained from topographic map has proved high probability of correct decisions, it was over 0.9 8.3.2. Determination of regions with different erosion degree - for soil erosion state determination the radiophysical models were used; - an appropriate coincidence of remote sensing data and in situ measurements was observed. Vector processing enables to sharpen the edges between zones with different erosion degree. The remote sensing data interpretation results coincide well with in situ measurements performed for set of control points on agricultural field under study. Multichannel data classification results: identification of “bare soil” regions (white color) determination of regions with different erosion degree (more dark color corresponds to higher erosion degree) 9. Illustrations for other applications. 9.1. Distortion correction and noise filtering for optical images obtained by Ukrainian satellite "Sich-1". 9.2. Medical ultrasound image processing by iterative filtering scheme Illustration and information materials on software and algorithms designed by Dept 504, Kharkov Aviation Institute, Kharkov, Ukraine Dept 504, State Aerospace University (Kharkov Aviation Institute), 17 Chkalova St, 310070, Kharkov, Ukraine tel. +38 0572 442352, tel./fax +38 0572 441186, e-mails: lukin@ai.kharkov.com, lukin@mmds.kharkov.ua Head of Dept: Dr of Techn. Science, Professor Zelensky Alexander A., Head of group: Candidate of Techn. Science Lukin Vladimir V. Experience in signal/image processing - since 1982, experience in antenna array design - since 1988, experience in radar image processing - since 1990, experience in multicomponent image processing - since 1995, experience in relief recovery - since 1996. All directions of research activity deal with corresponding software design using languages Fortran, Pascal, C++ for operation systems DOS, Windows. Participation in Projects supported by Ukrainian National Academy of Science, State Committee on Science and Technology, Imternational Soros Foundation, Ukrainian Ministry of Defense, National Space Agency of Ukraine, etc. Cooperation with 1. Institute of Radiophysics and Electronics, Ukrainian National Academy of Science, (Kharkov, Ukraine); 2. Center for Radiophysical Sensing of the Earth, Ukrainian National Academy of Science, (Kharkov, Ukraine); 3. Research Institute of Radiomeasurements, (Kharkov, Ukraine); 4. Tampere University of Technology, International Center for Signal Processing, (Tampere, Finland); 5. NASA Space Goddard Flight Center, (Greenbelt, USA). 6. DLR (German Space Agency), etc. Antenna array pattern synthesis and statistical analysis Applications: antenna arrays for on-land radars, antennas for airborne and spaceborne radars (remote sensing systems) with analog and digital signal processing. Brief description of obtained results: 1. Step-like windows have been synthesized (optimized in respet to minimization of the pattern maximal side lobe level (MSLL) or ratio of energies concentrated in its side lobes and the main lobe). Advantages: - simplicity of implementation for arrays with both analog and digital signal processing; - narrow main lobe (7-15% greater than for Dolph-Chebyshev patterns with the same MSLL); - stability of disturbed pattern main parameters to degrading influence of noise, amplitude/phase fluctuations, errors of element positioning, non-identity of channel amplitude/phase frequency characteristics; - rather wide range of provided MSLL - from -20 to -40 dB (for original patterns).
- 2. 2. New apodization functions have been designed for case of constructive- technological restrictions (for waveguide slot, patch and sectionized multielement antennas). Advantages: the designed apodization functions can be easily implemented for types of arrays mentioned above and they provide appropriate basic characteristics of patterns. 3. Application of weighting window to SAR line image formation and other approaches to primary signal (hologram) processing in SARs have been investigated. Advantages: a) improvement of SAR response parameters (maximal side lobe level reduction); b) proposed methods and algorithms are simple and can be added to existing systems; c) multilook image formation possibility is provided; d) methods are designed for both non-focused and partially focused image formation; e) improvement of calibration accuracy. 4. Methodology and means for statistical analysis of disturbed patterns have been elaborated. They include the following stages and functions: a) simulation of spatially independent and correlated noise and errors (occurring due to atmosphere turbulence, non-identity of array channel characteristics, antenna element displacement in respect to supposed positions, etc.) ; b) analysis of wide set of weighting windows including standard (known) ones and proposed by our group; c) optimization of sum-type window parameters; d) determination of statistical characteristics of the main parameters of disturbed patterns including - main lobe amplitude and its coordinate; - main lobe width; - maximal side lobe level (for normalized patterns) and coordinate of this maximum; - ratio of energies in side lobes and main lobe of the pattern; e) hystogram analysis of considered parameter distributions; Image processing techniques, algorithms and applications 1. Considered applications and peculiarities of image processing 1.1 Multichannel radar remote sensing mode Advantages: - possibility to estimate several characteristics of the sensed terrain simultaneously; - more reliable interpretation and classification of remote sensing data; - wider range of practical tasks to be solved; Applications of multichannel radar remote sensing: agriculture, ecological monitoring, forestry, hydrology, oceanography, disaster monitoring, subsurface sensing, etc. Arising problems: 1) necessity to superimpose images and to perform preliminary geometric corrections; 2) removal (suppression) of different kinds of noise and residual superimposing errors while providing edge/detail preservation and component mean level retaining for homogeneous regions. 1.2. Optical grey-scale and color images The main problems are image defocusing and presence of different kinds of noises and other distortions. 1.3. Medical images High level of speckle is typical for ultrasound images (like for synthetic aperture radar (SAR) images), the other types are also corrupted by different noise and/or distorted. 2. Image primary analysis (statistical, spectral-correlation) and service functions Assumes possibility to perform the following functions: - selection of the region for analysis including both rectangular and arbitrary shape fragments pointed by the User; - determination of selected fragment statistical characteristics (mean, variance, relative variance and its robust estimation, asymmetry coefficient and curtosis); - hystogram forming and its representation in different (selected) modes; - service functions like color palette selection, contrast enhancement, scaling, fragment value analysis, fragment cutting and passportization, 3-D visualization; - visualization of image line and row cross-sections; - derivation of 2-D spectrum and autocorrelation function for selected fragment of rectangular shapes (dimensions being the powers of 2) and these data visualization; 3. Image correction and superimposing techniques and their accuracy analysis 3.1. Existing methods: linear (affine transforms) and nonlinear (polynomial) Based on: a) cross-correlation, b) control point selection and transform parameter derivation, a priori knowledge can be taken into account as well for transform model selection and updating. 3.2. Assumptions: - equal error variances of determination of control point coordinates; - gaussian distribution of errors; - the used model corresponds well to really occurring distortions. 3.3. Proposed methods are based on quasioptimal selection of control point spatial locations, determination of proposed transform parameters, transform performing and image interpolation Analysis of the superimposing accuracy shows the following: - control point location and their number considerably influence on the image superimposing accuracy; - for images with approximately equal Xm and Ym it is not reasonable to use more than 7-12 control points; - to get minimal superimposing errors control points should be placed as sparsely as possible in the sense of maximal total distance between them. 3.4. Experimental results of the proposed nonlinear superimposing technique application The total accuracyof Ka-band image-to-image superimposing characterized by rms value equals to 1.97 (expressed in pixel dimension) , for superimposing of X-band image to Ka-band HH one the estimated rms=3.06. Conclusion: the residual superimposing errors are of about one resolution element. 4. Image component filtering Several original filtering techniques have been proposed by our group: Modified sigma filter and adaptive hard-switching and iterative algorithms Ka-band radar images: original image output image after processing by adaptive hard-switching filter 5. Image restoration Several original image restoration techniques have been proposed by our group: They are based on adaptive hard-switching and iterative restoration procedures. Blurred image corrupted by additive and impulsive noise Restored image using iterative procedure with restrictions 6. Edge/detail detection, line (contour) thinning. A wide set of edge/detail detection and line thinning algorithms (icluding proposed ones) have been implemented in designed software.