SlideShare a Scribd company logo
1 of 60
Download to read offline
No 82 (2021)
Vol. 3
Sciences of Europe
(Praha, Czech Republic)
ISSN 3162-2364
The journal is registered and published in Czech Republic.
Articles in all spheres of sciences are published in the journal.
Journal is published in Czech, English, Polish, Russian, Chinese, German and French, Ukrainian.
Articles are accepted each month.
Frequency: 24 issues per year.
Format - A4
All articles are reviewed
Free access to the electronic version of journal
Edition of journal does not carry responsibility for the materials published in a journal.
Sending the article to the editorial the author confirms it’s uniqueness and takes full responsibility for possible
consequences for breaking copyright laws.
Chief editor: Petr Bohacek
Managing editor: Michal Hudecek
• Jiří Pospíšil (Organic and Medicinal Chemistry) Zentiva
• Jaroslav Fähnrich (Organic Chemistry) Institute of Organic Chemistry and Biochemistry
Academy of Sciences of the Czech Republic
• Smirnova Oksana K., Doctor of Pedagogical Sciences, Professor, Department of History
(Moscow, Russia);
• Rasa Boháček – Ph.D. člen Česká zemědělská univerzita v Praze
• Naumov Jaroslav S., MD, Ph.D., assistant professor of history of medicine and the social
sciences and humanities. (Kiev, Ukraine)
• Viktor Pour – Ph.D. člen Univerzita Pardubice
• Petrenko Svyatoslav, PhD in geography, lecturer in social and economic geography.
(Kharkov, Ukraine)
• Karel Schwaninger – Ph.D. člen Vysoká škola báňská – Technická univerzita Ostrava
• Kozachenko Artem Leonidovich, Doctor of Pedagogical Sciences, Professor, Department
of History (Moscow, Russia);
• Václav Pittner -Ph.D. člen Technická univerzita v Liberci
• Dudnik Oleg Arturovich, Doctor of Physical and Mathematical Sciences, Professor, De-
partment of Physical and Mathematical management methods. (Chernivtsi, Ukraine)
• Konovalov Artem Nikolaevich, Doctor of Psychology, Professor, Chair of General Psy-
chology and Pedagogy. (Minsk, Belarus)
«Sciences of Europe» -
Editorial office: Křižíkova 384/101 Karlín, 186 00 Praha
E-mail: info@european-science.org
Web: www.european-science.org
CONTENT
ECONOMIC SCIENCES
Avagyan G., Vardanyan Q., Petrosyan G.,
Navasardyan M., Margaryan A.
THE MALMQUIST PRODUCTIVITY INDEX AND ITS
ANALYSIS ON THE EXAMPLE OF THE RA .....................3
Krasnova І., Shevaldina V.
METHODS OF HEDGING CURRENCY RISK BY BANKS .10
PEDAGOGICAL SCIENCES
Kismetova G., Abdrasilova N.
ADVANTAGES AND DISADVANTAGES OF DISTANCE
LEARNING..................................................................16
Barankhin. O.
LUMBAR-TRUNK INJURIES PREVENTION WITH
GYMNASTICS EXERCISES IN WARM-UP TRAINING
SESSION FOR POWER SPORTS...................................20
Antonova N., Karaeva A.
THE MAIN CONDITIONS FOR THE SUCCESSFUL
ADAPTATION OF YOUNG CHILDREN TO
KINDERGARTEN CONDITIONS ...................................28
Kramarenko L.
THE PRINCIPLE OF OPERATION OF ELECTRONIC
CONSULTING TERMINALS ON THE EXAMPLE OF THE
PROVISION OF SOCIAL AND LEGAL SERVICES ...........30
Matiienko O.
MODERN METHODOLOGICAL APPROACHES TO
TRAINING OF FUTURE FOREIGN LANGUAGE
TEACHERS IN MODULE SYSTEM ................................32
Tolkacheva G., Gaidukova K.
PEER EDUCATION OF PRESCHOOL CHILDREN IN THE
FAMILY: PROBLEMS AND PROSPECTS .......................36
Kulmagambetova S., Tolegen A.
DEVELOPMENT OF ORAL SPEECH SKILLS IN ENGLISH
LESSONS AT GENERAL EDUCATIONAL SCHOOL.........42
Khamitova D., Nurusheva T.
DISCUSSION AS A METHOD OF FORMATION OF
COMMUNICATION SKILLS IN HIGH SCHOOL .............44
PHILOLOGICAL SCIENCES
Gorzhaya A., Bogdanov L.
THE SPECIFICITY AND METHODS OF TRANSLATION OF
ATTRIBUTIVE COMBINATIONS BASED ON THE
MATERIAL OF POPULAR SCIENCE TEXTS ...................47
Kozhemyakina V.
DISTINCTIVE FEATURES OF THE DEMOLINGUISTIC
SITUATION IN THE REPUBLIC OF BASHKORTOSTAN..50
PSYCHOLOGICAL SCIENCES
Kosykh G.
ACMEOLOGICAL UNDERSTANDING OF PERSONALITY
AND ITS DEVELOPMENT............................................55
Sciences of Europe # 82, (2021) 3
ECONOMIC SCIENCES
THE MALMQUIST PRODUCTIVITY INDEX AND ITS ANALYSIS ON THE EXAMPLE OF THE RA
Avagyan G.,
Associate Professor, PhD in Economics
Armenian State University of Economics (ASUE)
https://orcid.org/0000-0003-3395-2473
Vardanyan Q.,
Associate Professor, PhD in Economics
Armenian State University of Economics (ASUE)
https://orcid.org/0000-0002-7198-3740
Petrosyan G.,
Armenian State University of Economics (ASUE)
https://orcid.org/0000-0002-4711-7615
Navasardyan M.,
PhD Student
Armenian State University of Economics (ASUE)
https://orcid.org/0000-0002-5474-6401
Margaryan A.
PhD Student
Armenian State University of Economics (ASUE)
DOI: 10.24412/3162-2364-2021-82-3-3-10
ABSTRACT
One of the pillars of assessing the competitiveness of the country's economy is the degree of efficiency of its
output, which mostly depends on the productivity of factors used in the production process, as well as on the
effectiveness of production, organization and control. The professional literature has repeatedly referred to the
evaluation of competitiveness and effectiveness. In this context, the Malmquist index is one of the most commonly
used and comprehensive indicators for measuring productivity and efficiency. The contribution of this paper is the
Malmquist index application in calculation of gross domestic production efficiency for a group of more than hun-
dred countries, which will let us to reveal the trends in the dynamics of the country's competitiveness. Besides,
that will help to identify the underlying issues that hinder the economic productivity of the observing country, in
particular, the Republic of Armenia, and, consequently, its competitiveness. The explorations showed that the
index in the context of economic efficiency is capable of detecting competitive advantage and disadvantage of any
decision-making unit over other ones: in the RA they are pure efficiency change and scale efficiency change ac-
cordingly. Besides, the results indicated oscillatory nature of Armenia GDP efficiency change of production pro-
cess and stable nature of production frontier shift.
Keywords: competitiveness, Malmquist index, total factor productivity, technical efficiency, scale efficiency
JEL classification: O47
Introduction
Many researchers put the efficiency of the produc-
tion and the productivity of the resources used in this
process among the pillars that form the competitiveness
of the country's economy, or at the basis of the assess-
ment of competitiveness. The "iceberg" model of com-
petition (Peneder, 2017) offers a vertical classification
of competitiveness targets and engines, the starting
point of which is productivity. On the other hand, all
the economic agents in the world are struggling to man-
age the allocation of resources, thus, in this study, the
terms "competitiveness” and “efficiency" are intercon-
nected with each other.
The current geopolitical and socio-economic situ-
ation in the Republic of Armenia contains great risks of
a negative impact on the country's production potential.
The consequences of a further decline in the country's
attractiveness for labor emigration and investment
could lead to a long-term decline in the country's eco-
nomic resources. Therefore, it is generally very im-
portant to find out and keep issues of resources and pro-
duction efficiency in the center of attention on an ongo-
ing basis.
Determining the level of efficiency of the output
produced in a country provides a valuable insight into
economic behavior and provides an opportunity to
compare it with other economies. If countries do not
use their resources properly, it is definitely an indica-
tion of the need of making adjustments in the measures
of production organization and improvement of its ef-
ficiency.
Normally, the growth rate of the output for a cer-
tain period of time differs from the growth rate of the
labour force and the capital participation in that process
in the same period of time. This can be explained by
change in total factor productivity (TFP), that is, the
ability to use and combine factors more efficiently over
time. This may be due to changes in certain qualities
(more relevant skills or new technologies introduced)
or to more optimal methods of enterprise production
management. TFP is directly associated with the real
driving force behind product growth, which is related
Sciences of Europe # 82, (2021) 4
to technological innovation and efficiency improve-
ment. It can be achieved by improving labor skills and
capital management. TFP plays a critical role on eco-
nomic fluctuations, economic growth and cross-coun-
try per capita income differences. At business cycle fre-
quencies, TFP strongly correlates with output and hours
worked (Comin, 2006). It plays a significant role in im-
proving the country's competitiveness, especially in the
current context of severe resource constraints.
The economic literature has repeatedly referred to
the assessment of the efficiency. Different authors have
developed and have even separated several components
in the nature of this concept in order to analyze it in
more detail. Hawdon (2003) attributed efficiency to
three main properties: technical, economic, and distri-
butional. Melecky and Stanickova (2012) analyzed ef-
ficiency by the example of European countries, describ-
ing it as a reflection of the level of potential competi-
tiveness.
The original idea of the Malmquist index proposed
Swedish economist-statistician Stan Malmquist in
1953. He suggested comparing the input of a firm at
two different points of time in terms of the maximum
factor by which the input in one period could be de-
creased such that the firm could still produce the same
output level of the other period. Later, this idea of in-
put-reducing ratio expanded and became Malmquist
Productivity Index (Caves et al., 1982). There was a re-
surgence of interest in its application in 1994, when the
Malmquist index of improvement of output was calcu-
lated on the panel data basis, assuming a stable return
on production. The calculated index was the average
geometric mean of the two TFP indices.
For example, Dai and Liu (2009) estimated the ef-
ficiency and productivity growth of 16 major high-tech
companies in China in 2002-2007. Sharma and Thomas
(2008) calculated the same index for 20 OECD member
countries, the Russian Federation and China. Lu and
Liu (2010) employed the Malmquist index, to decom-
pose productivity growth into technical efficiency and
technological change. The results indicate that the in-
crease in R&D productivity is mainly attributed to the
increase in technical change, and the efficiency gain
found is largely the result of improvements in scale ef-
ficiency։ Park (2014) analyzed the efficiency and
productivity change within government subsidy recipi-
ents of a national technology innovation research and
development (R&D) program.
Another attempt to calculate the Malmquist index
revealed the trends in productivity growth of OECD
member countries in 1981-2006. The assessment was
carried out for each 5 years period, calculating the av-
erage of total factor productivity. The results show that
the annual growth of TFP varies considerably, as sig-
nificant fluctuations have been observed over time in
the member countries. In most of them, the annual TFP
has significantly deteriorated. In particular, the decline
in productivity has been more perceptible since 2001.
During 2001-2006, the average annual change in the
TFP in the OECD area was negative. Only Germany
and Japan from the Group of the Seven recorded a pos-
itive change of the TFP during that period. The results
did not provide strong evidence that huge investments
in information technology, particularly in the second
half of the 1990s, clearly boosted the productivity of
large industrialized countries. In fact, in many of the
surveyed countries the growth of TFP has slowed sig-
nificantly during the 1990s compared to the 1980s. Of
the Scandinavian countries, only Finland, Norway and
Sweden have been able to record leading productivity
growth in this comparison. Australia and New Zealand
also experienced relatively higher productivity growth,
but mainly in the early 1990s. With the exception of
these countries, GDP growth was relatively weak in
most of the OECD area in the 1990s, including the G7
countries. As mentioned above, such a weak increase in
productivity continued and sometimes even became
negative after 2000.
Another interesting example of the application of
the Malmquist index is the assessment of the produc-
tivity of the construction sector in eight Australian
states in 1990-2007. As input factors of construction
were used the construction work and the number of
people working in that field. The first of these is a com-
posite indicator, which includes payments for the sup-
ply of raw materials, labor prices and speculative con-
tracts. As an output of the production, the value added
in the construction sector in the respective state was
used. The results of the research describe how the tech-
nology of this field, the net technical efficiency and the
scale of the economy affect the change of construction
productivity. The analysis is carried out not only at the
state level, but also at the national level. The study
shows how the technology, technological efficiency
and scale of economy affect on the change of overall
productivity. Although the growth rates of construction
productivity in the Australian states did not show obvi-
ous differences, the growth factors were to some extent
different (Li & Liu, 2010).
Thus, one of the theoretically substantiated and the
most common indicators measuring total factor produc-
tivity and the quality of production organization is the
Malmquist productivity index, which stands out for its
unique and meaningful nature among other estimates.
During the calculation and interpretation of the in-
dex, the keyword "change" is not stressed accidentally.
The point is that the calculated index is obtained for
each period by comparing the end and beginning of the
period, or that it is the same, through change.
The Malmquist index for the period is the ratio of
two distance functions that, under stable conditions of
production technology, measure the maximum propor-
tional change in factors-output combination from the
previous (t-1) to the observed (t) period. The
Malmquist TFP index is a geometric mean of two
Malmquist indices (Karmann & Roesel, 2016). The dif-
ference between them lies in the production technolo-
gies: in one case, it refers to the previous period, and in
the other to the observed one.
M(yt, xt, yt−1, xt−1)
= √[
Dt−1 (xt, yt)
Dt−1 (xt−1, yt−1)
×
Dt (xt, yt)
Dt (xt−1, yt−1)
]
(1)
The index introduces TFP of current DMU at point
(xt, yt) in comparision with (xt−1, yt−1) point. If the
Sciences of Europe # 82, (2021) 5
value of the index is greater than, less or equal to 1, then
the TFP has either progressed (increased productivity)
or experienced a decline (decreased productivity), or
the TFP change, respectively has missed. Thus, to cal-
culate the index describing the change in TFP for each
DMU, four distance functions must be calculated to
measure the TFP change between two periods, t and
t+1. This requires solving four LP problems (Li, 2009).
After some mathematical modifications the
Malmquist TFP index can be divided into two compo-
nents, which are meaningful in context of economic
logic: efficiency change (ECH) and technological effi-
ciency change (TECH). The first refers to the change in
the efficiency of the factors and the change in the opti-
mal operation of the existing factors. The second de-
scribes the change in production frontier, in other
words, technological progress. It should be noted that
now in the professional literature such a decomposition
of the Malmquist TFP index appears as a generally
agreed approach.
M(yt, xt, yt−1, xt−1) =
Dt (xt, yt)
Dt−1 (xt−1, yt−1)
× √(
Dt−1 (xt, yt)
Dt(xt−1, yt−1)
×
Dt−1 (xt, yt)
Dt (xt−1, yt−1)
) (2)
The discussed TFP evaluation criterion includes
another stage of separation, which follows in the “foot-
steps” of the primary sources of the efficiency of re-
sources involved in the production process: the change
in factor efficiency is explained by two circumstances:
a pure change in efficiency (PECH) and a change in ef-
ficiency from scale (SECH).
Malmquist TFP index = PECH × TECH = PECH × SECH × TECH (3)
Malmquist TFP indices calculations research for
the period 1995-2019 covers 123 countries and groups
of countries, including the whole world, as one DMU.
The calculations are based on GDP (World Bank,
2020a) as an output, gross fixed capital formation
(World Bank, 2020b) and labor force (International La-
bor Organization, 2021) as factors of production.
The research carried out within the framework of
the “Comprehensive and Enhanced Partnership Agree-
ment” involves the development and maintenance of a
number of trendy statistical software packages. The
technical solutions for Malmquist index study were
provided through one of those programs (CEPA, 1996),
which allows to calculate the indicators presented in
Equation 2.
Figure 1․ The scatter of efficiency and technical efficiency changes means of observed 123 DMUs
In Figure 1, there are introduced the average val-
ues of the first-degree decomposition of the studied
countries’ Malmquist index, which are the geometric
means of each DMU. The highlighted numbers repre-
sent the average of the corresponding type of efficiency
for the whole world as one DMU (more than 200 coun-
tries). It should be noted that the change in technical
efficiency level in the world has generally declined, de-
creasing by 0.4 percent in the observed period, while
the ECH has been positive by the same amount as
TECH. As a counterargument to this, more unstable na-
ture of the ECH variance is determined, while the
TECH mainly fluctuates in the range much closer to
unit. The highest level of TECH was registered in 2009
(Figure 2), increasing by 11․4 percent, and the lowest
in 2018 (-14.5 percent). It is interesting that the
Malmquist TFP index also showed its highest level in
2009 (7.7 percent) and the lowest in 2019 (-7.3 per-
cent). On the other hand, the highest level of ECH was
in 2018 (16.6 percent), and the lowest in 2000 (-9.2 per-
cent).
Armenia; 1,017
World; 1,004
Armenia; 0,995 World; 0,996
0,96
0,98
1
1,02
1,04
Efficiency change Technical efficiency change
Sciences of Europe # 82, (2021) 6
Figure 2․ Average Total factor productivity and scale efficiency changes in the world during 1996-2019
The dynamics of production process efficiency
and technical efficiency changes illustrates some inter-
esting facts about the nature and the causes of produc-
tion efficiency in the world during last two decades. At
first, it is noticable that almost every year during the
observed period, trends of two main characteristics de-
scribing TFP are opposite. That is, for example, in case
of efficiency positive change, technical efficiency de-
clines. Although it is an expected scenario (as if efforts
are aimed to improve production process efficiency and
productivity of factors, may lead the DMU to lag be-
hind the global trends of research and technological de-
velopment), it is possible for DMU to simultaneously
improve both types of efficiency (as in 2009). Օther-
wise, such a contraindication can occur due to the lag
between achievements of scientific and technical pro-
gress with production process efficiency. This means,
that when technical efficiency increases (TECH), that
is production frontier shifts, current level of organiza-
tional efficiency of production process does not react to
it simultaneusly. Therefore, that opposite thrends have
to be handled by synchronizing two main types of effi-
ciency changes.
An interesting behaviour of efficiency indicators
is noticable In Figure 2: there are large amplitude fluc-
tuations of Malmquist index first level components no-
ticed after 2008, which is probably caused by the global
financial and economic crisis and its consequences.
Figure 3․ Dynamics of Malmquist TFP indices of members of Eurasian Economic Union (EAEU)
0,8
0,9
1
1,1
1,2
2000 2001 2002 2003 2004 2005 2006 2007 2008 2009 2010 2011 2012 2013 2014 2015 2016 2017 2018 2019
Efficiency change Technical efficiency change Total factor productivity
0,7
0,8
0,9
1
1,1
1,2
1,3
2000 2001 2002 2003 2004 2005 2006 2007 2008 2009 2010 2011 2012 2013 2014 2015 2016 2017 2018 2019
Armenia Belarus Kazakhstan Kyrgyzstan Russia
Sciences of Europe # 82, (2021) 7
Let us make a transition to the indicators of spe-
cific countries, in particular, further analysis will be on
the example of the Republic of Armenia (RA), though
the calculations allow to do the same for all of the ob-
served DMUs (Authours’ calculations, 2021).1
Taking
into account the economic and mathematical nature of
the index, in the professional literature it is accepted to
analyze indices in some comparison edges. Therefore,
before getting acquainted with all the index compo-
nents of the Republic of Armenia separately, let us
make some comparative analysis of Armenia and other
DMUs.
Thus, from the presented Figure 3, we can first no-
tice that in the observed period, according to the change
of the TFP, there are no highlighted leaders among
EAEU members. The sharp fluctuations of the change
in TFP of RA in 2002 and 2011 are noticeable: in the
first case the negative change was more than 20 per-
cent, but in the second case the difference was positive
(25.2 percent). Note that not only for those years the
trends of the EAEU member states coincide to some
extent, but also for the years after the founding of the
union (2015). In recent years, the changes in their TFP
are almost identical, though in the case of the last ob-
servation only Armenia registered a positive result in
the list of those DMUs, with a 4.6 percent change. In
addition, the Malmquist TFP index of RA was the best
among the members of the union in 2007, 2009, 2011,
as we have already mentioned, in 2019, and the lowest
only in 2002. The main reason for that decline was 33․
2 percent increase in investment (a slight increase in la-
bor force), which significantly exceeded the economic
growth based on it (13․2 percent).
Figure 4․ Dynamics of Malmquist TFP indices of Armenia and countries comparable to it
In Figure 4 there are represented discussing index
of Armenia and other comparable by GDP per capita
countries. In this group of countries, too, according to
the assessed index, there is no emphasized leader. Only
Ukraine has obvious fluctuations: more than 30 per-
cent, and this can be seen in several year indicators. As
for the position of the Republic of Armenia in such a
framework of monitoring the index, it should be noted
1
Authours’ calculations. (2021). Malmquist TFP indices and
their components [database]. Available in
that it was the lowest not only in 2002, as in the previ-
ous group of countries, but also in 2004, 2005 and 2015.
The noticeable negative shift in 2015 (0.984) was
mainly due not to the low level of that year's compo-
nents decline, but to the high ranks of ECH and TECH
in 2014, as a result of which the index in 2015 was the
lowest among negative and comparable countries. It
should also be noted that Armenia was the leader in this
list in 2007, 2011, 2017 and 2018.
https://docs.google.com/spreadsheets/d/1mi-
hYj2rV5lWWYA54BvfTFaad-upUNajl8cF5s-KcIZk
0,7
0,9
1,1
1,3
1,5
1,7
2000 2001 2002 2003 2004 2005 2006 2007 2008 2009 2010 2011 2012 2013 2014 2015 2016 2017 2018 2019
Armenia Moldova Ukraine Iran Lebanon
Sciences of Europe # 82, (2021) 8
Figure 5․ Malmquist TFP index and its components dynamics of Armenia
In order to explain the dynamics of the Malmquist
TFP index of the RA and to justify its movement objec-
tively, we have also observed the components of the in-
dex. Looking at Figure 5 we can notice the shift in the
index of Armenia is generally caused by the ECH, that
is, the change in resources and their management effi-
ciency. Its change, in its turn, is due to more PECH,
which fluctuates in the range 0․788-1․255, while
SECH, which is the other component of ECH, is in the
narrow range 0․983-1․068 during the observed period.
Such a small difference of efficiency gained from pro-
duction scale change in Armenia hints about the need
to enter new markets, especially outside, as satisfaction
of internal demand is already quite saturated.
The maximum value that Armenia scored in the
period under review is 1.172 in 2011, which means that
the country has improved its TFP by 17.2 percent com-
pared to 2010, while the TFP change of the whole world
for the same year was negative (-11․3 percent). There
is also a significant difference with the index calculated
for the world - in the case of the lowest index registered
in the last 20 years of the Republic of Armenia (in 2002
was 0.896), the rather deep negative index of our coun-
try is opposed to the positive tendency of the same in-
dex in the world (1.027).
Thus, Malmquist TFP index provides extensive
information about DMU’s effectiveness, as well as
competitiveness. It allows to explain the fluctuations of
the TFP dynamics and the obstacles to improving com-
petitiveness. Thanks to index decomposition into inter-
pretable in macroeconomic context indicators it is pos-
sible to separate efficiency types observed during pro-
duction process.
Malmquist TFP index in the world has been gen-
erally close to 1 during the years 1996-2019, that is the
change in TFP has been missing. The reasing are the
contradictory tendencies of the two components of the
index, which represent the change in the shift in pro-
duction frontier (TECH) and in change of efficiency of
production factors or production organization process
(ECH). In particular, TECH has decreased, but a posi-
tive shift has been recorded in ECH, and both to the
same extent.
0,7
0,8
0,9
1
1,1
1,2
1,3
2000 2001 2002 2003 2004 2005 2006 2007 2008 2009 2010 2011 2012 2013 2014 2015 2016 2017 2018 2019
Efficiency change Technical efficiency change Pure efficiency change
Scale efficiency change Total factor productivity
Sciences of Europe # 82, (2021) 9
Figure 6․
Average Total factor productivity and scale efficiency changes of compared countries during 1996-2019
As the analysis of the observed period showed, the
TFP of the RA increased by an average of 1․2 percent-
age. The change in the TFP of the country was mainly
because of the change in factor efficiency, which was
largely motivated by a change in net efficiency change.
Main barriers of the competitiveness shift of Armenia
are TECH and SECH: change in scale efficiency is al-
most zero, averaging only 0․2 percentage. Expanding
export opportunities and entering foreign markets will
ensure improved efficiency from scale.
Finally, the calculated components and compara-
tive analysis of EAEU members and countries compa-
rable with Armenia confirm that competitive advantage
of the RA in the context of production efficiency is the
production process efficiency. On the contrary, the
main obstacle to the increasing its TFP is the low level
of scale efficiency. That indicates Figure 6. where are
introduced TFPCH and SECH of all the countries com-
pared with Armenia in this paper, as well as the same
changes in the world in average. Here we can find the
RA to be the lowest after Moldova and Lebanon in the
ranking by scale efficiency change. That is scale effi-
ciency changes in Armenia are not only almost static,
but also its level is less than the average in the world.
On the other hand, only in Armenia and Lebanon the
SECH is inferior to TFPCH. This fact threatens the TFP
positive dynamics of Armenia, because at such an al-
most constant pace of SECH theoretically once the
country will exhaust its potential of improving pure ef-
ficiency, and in that case, it can only increase its pro-
duction efficiency only due to TECH, which is too ex-
pensive to be always applied to improve TFP.
The nature of scale efficiency can describe how
expedient the expansion of production will be, from the
point of view of efficiency. That indicator therefore is
one of the most important indicators figuring the com-
petitiveness of the country.
References
1. Centre for Efficiency and Productivity Analy-
sis (CEPA). (1996). DEAP Version 2.1 [Computer soft-
ware]. Retrieved from https://econom-
ics.uq.edu.au/cepa/software
2. Caves, D. W., Christensen, L. R., Diewert, E.
W. (1982). The economic theory of index numbers and
the measurement of input, output, and productivity.
Econometrica, 50(6), 1393-1414.
https://doi.org/10.2307/1913388
3. Comin, D․ (2006). Total Factor Productivity.
New York University and NBER, 1. https://www.re-
searchgate.net/publication/228665597
4. Dai, F., & Liu G. (2009). R&D efficiency and
productivity growth: A Malmquist index analysis of
High-Tech industries in China. International Confer-
ence on Management Science and Engineering, 1866-
1872. https://doi.org/10.1109/icmse.2009.5317726
5. Hawdon, D. (2003). Efficiency, performance
and regulation of the international gas industry - a boot-
strap DEA approach. Energy Policy, 31(11), 1167-
1178. https://doi.org/10.1016/s0301-4215(02)00218-5
6. International Labour Organization. (2021).
ILOSTAT database [database]. Available from
https://ilostat.ilo.org/data/
7. Karmann, A., & Roesel, F. (2016). Hospital
policy and productivity, Evidence from German states.
CEPIE Working Paper, 07(16), 6.
https://doi.org/10.1002/hec.3447
8. Li, Y. (2009). A firm-level panel-data ap-
proach to efficiency, total factor productivity, catchup
and innovation and mobile telecommunications reform
(1995-2007). CCP Working Paper, 09(6), 14.
http://competitionpolicy.ac.uk/docu-
ments/107435/107587/1.114399!ccp09-6.pdf
9. Li, Y., & Liu, Ch. (2010). Malmquist indices
of total factor productivity changes in the Australian
construction industry. Construction Management and
0,95 0,96 0,97 0,98 0,99 1 1,01 1,02
Ukraine
Russia
Iran
Kazakhstan
Belarus
World
Kyrgyzstan
Armenia
Moldova
Lebanon
Total factor productivity change Scale efficiency change
Sciences of Europe # 82, (2021) 10
Economics, 8(9), 937.
https://doi.org/10.1080/01446191003762231
10. Lu, W. CH., & Liu, T. K․ (2010). Malmquist
indices of R&D productivity growth in taiwanese ic-
design industry. Global journal of business research,
4(1). https://ssrn.com/abstract=1633104
11. Melecky, L., & Stanickova M. (2012). Na-
tional Efficiency Evaluation of Visegrad Countries in
Comparison with Austria and Germany by Selected
DEA Models. International Conference on Mathemati-
cal Methods in Economics, 575-580.
http://doi.org/10.7441/joc.2012.03.05
12. Park, S. (2014). Evaluating the efficiency and
productivity change within government subsidy recipi-
ents of a national technology innovation research and
development program. R&D Management, 45(5), 549-
568. https://doi.org/10.1111/radm.12097
13. Peneder, M. (2017). Competitiveness and in-
dustrial policy: from rationalities of failure towards the
ability to evolve. Cambridge Journal of Economics, 41,
829-858. https://doi.org/10.1093/cje/bew025
14. Sharma, S., and Thomas V. (2008). Inter-
country R&D efficiency analysis: An application of
data envelopment analysis. Scientometrics, 76(3), 483-
501. https://doi.org/10.1007/s11192-007-1896-4
15. World Bank, World Bank national accounts
data, and OECD National Accounts data files. (2020a).
GDP (constant 2010 US$) [Data file]. Retrieved from
https://data.worldbank.org/indica-
tor/NY.GDP.MKTP.KD
16. World Bank, World Bank national accounts
data, and OECD National Accounts data files. (2020b).
Gross fixed capital formation (constant 2010 US$)
[Data file]. Retrieved from
https://data.worldbank.org/indica-
tor/NE.GDI.FTOT.KD
МЕТОДИ ХЕДЖУВАННЯ ВАЛЮТНОГО РИЗИКУ БАНКАМИ
Краснова І.В.,
д.е.н., професор, професор
кафедри банківської справи та страхування КНЕУ ім. В.Гетьмана
Шевалдіна В.Г.
к.е.н., доцент, доцент
кафедри банківської справи та страхування КНЕУ ім. В.Гетьмана
METHODS OF HEDGING CURRENCY RISK BY BANKS
Krasnova І.,
Doctor of Economics, Professor, Professor Department of Banking and Insurance
Kyiv National Economic University named after Vadym Hetman
Kyiv, Ukraine
Shevaldina V.
Ph. D. in Economics, Associate Professor of the Department of Banking and Insurance
Kyiv National Economic University named after Vadym Hetman
Kyiv, Ukraine
DOI: 10.24412/3162-2364-2021-82-3-10-15
АНОТАЦІЯ
Не зважаючи на велику кількість робіт присвячених питанням валютного ризику та методам його хе-
джування, деякі питання залишаються не визначеними. Не має сталої класифікації методів та стратегій
хеджування. У статті розглянуто концептуальні підходи до класифікації видів валютного ризику. Запро-
поновано авторський підхід до структуризації методів хеджування валютного ризику та виокремлено ін-
струменти хеджування валютного ризику банками клієнтів. Проаналізовано вітчизняну практику хеджу-
вання валютного ризику та визначено можливості застосування форвардних контрактів в сучасних умовах.
ABSTRACT
Despite the large number of papers on currency risk and methods of it’s hedging, some issues remain unre-
solved. There is no permanent classification of hedging methods and strategies. The article considers conceptual
approaches to the classification of currency risk types. The author's approach to the structuring of currency risk
hedging methods is proposed and the tools of currency risk hedging by clients' banks are singled out. The domestic
practice of currency risk hedging is analyzed and the possibilities of using forward contracts in modern conditions
are determined.
Ключові слова: валютний ризик, банк, хеджування, класифікація, метод, деривативи, форвард.
Keywords: currency risk, bank, hedging, classification, method, derivatives, forward.
Актуальність. Валютний ризик є частиною
ландшафту ризиків банківської установи. Він пов'-
язаний з глобалізацією та інтеграцією, інтернаціо-
налізацією ринку банківських послуг, створенням
транснаціональних компаній та банківських уста-
нов, диверсифікацією їх діяльності, і представляє
ситуацію, яка допускає потенційні грошові втрати
Sciences of Europe # 82, (2021) 11
в результаті коливань валютних курсів. За економі-
чним змістом цей ризик є ризиком невизначеності
майбутніх грошових потоків банку унаслідок змін
курсів валют. При цьому зміна валютного курсу ві-
дбувається через: 1) зміну внутрішніх витрат ва-
люти; 2) посилення транснаціональної мобільності
грошових потоків; 3) спекуляції на міжбанківсь-
кому ринку. Тим самим, валютний ризик – це наяв-
ний чи потенційний ризик який виникає через не-
визначеність майбутніх грошових потоків в наслі-
док несприятливих коливань курсів валют і цін на
банківські метали, що відбиваються на скорочені
(іноді зростанні) надходжень і капіталу.
Чутливість банку до валютного ризику вимі-
рюється відкритою валютною позицією за окре-
мими валютами та банківськими металами, динамі-
кою валютних курсів, а також кваліфікацією і коре-
ктністю дилерів (трейдерів). Цей ризик
притаманний всім фінансовим операціям банку в
іноземній валюті і фактично є валютно-курсовим
ризиком. Ця діяльність включає біржову торгівлю,
управління портфелем позик в іноземній валюті, ва-
лютні депозитні рахунки, залишки в іноземній ва-
люті (зобов'язання або активи), платежі з рахунків
та інші витрати в іноземній валюті. Валютний ри-
зик є дуже складним (виділяють багато критерії
його класифікації), за характером виникнення ва-
лютний ризик поділяється на трансакційний (опе-
раційний), трансляційний (бухгалтерський) та еко-
номічний (рис.1).
Транзакційний ризик, або експозиція до опе-
рацій є результатом зміни значень операційних на-
дходжень та відтоку готівки у період між момен-
том, коли укладається операція, і коли здійсню-
ються платежі з переказу валюти за операцією.
Трансляційний ризик, або експозиція, пов’язана з
переказами, або бухгалтерська, виникає, коли є не-
обхідність конвертувати валюти. Економічний
вплив виникає, коли коливання валют змінюють
майбутні доходи компанії та витрати і тим самим
впливає на капітал банку. Коли валютний курс змі-
нюється, це може мати значення для цінової конку-
рентоспроможності [1].
Рис. 1. Форми валютно-курсового ризику банку
Джерело: складено авторами
Щодо економічної форми валютного ризику,
то серед науковців не існує єдиного погляду щодо
її розуміння. Окремі автори пропонують виділяти
стратегічний валютний ризик. На наш погляд, до
економічного валютного ризику відносяться усі
види валютного ризику, які пов’язані з коливанням
валютних курсів та їх впливом саме на реальні гро-
шові потоки, а, відповідно, й на економічну вар-
тість банку. Трасляційний ризик, навпаки, пов'яза-
ний зі змінами у балансовій вартості.
З точки зору А.К. Солодова, якщо менеджмент
банку не визнає трансляційний ризик суттєвим, не-
має необхідності його хеджувати. Автор зазначає,
що відображення в балансовому звіті змін активів і
пасивів при їх оцінці в базовій валюті є всього лише
бухгалтерською процедурою, яка не має істотного
значення. Той факт, що вартість активів в іноземній
валюті, коливається разом з рухом обмінного курсу
національної валюти до іноземної, може ніяк не
вплинути на основну діяльність або прибутковість
портфелем деномінованим в іноземній, витрати на
хеджування трансляційного ризику можуть вважа-
тися недоцільними, так як фактично не існує ризику
втрат від коливань курсу. Визнаємо таку точку зору
доцільною за умови, якщо зміна курсу розгляда-
ються як відхилення від відносно стабільного курсу
Sciences of Europe # 82, (2021) 12
[2, 208-209]. З нашої точки зору, при існуванні пев-
ної тенденції зміни курсу, сама ця тенденція вважа-
ється суттєвим фактором впливу, хоча відхилення
від курсу в ту або іншу сторону можуть бути несут-
тєвими.
Укладаючи зовнішньоекономічні угоди з від-
строчкою платежів провідні компанії різних країн
неодмінно використовують хеджування, щоб убез-
печити себе від небажаного руху валютного курсу
у майбутньому. Статистика свідчить, що обсяг угод
спот (тобто з розрахунками день в день) на світо-
вому валютному ринку значно поступається обсягу
угод з використанням інструментів хеджування.
Ґрунтуючись на аналізі світової теорії й практиці
виділяємо наступні методи, які банк може застосо-
вувати для хеджування валютного ризику:
1) методи зовнішнього хеджування – операції
з валютними деривативами, у т.ч.: валютні операції
“форвард”, операції “своп”, опціонні угоди, валю-
тні ф’ючерсні контракти;
2) методи внутрішнього хеджування: структу-
рне збалансування активів (matching), пасивів, кре-
диторської та дебіторської заборгованості; страте-
гія випереджень та запізнювань (leads&lags), кре-
дитування та інвестування в іноземній валюті,
паралельні позички (cash pooling), структурування
зустрічних валютних потоків (netting), валютні “по-
душки”;
3) контрактні методи: валютні застереження,
вбудовані похідні інструменти, угода про поділ ри-
зиків;
4) інші: створення реінвойсингових центрів;
дисконтування вимог в іноземній валюті (фор-
фейтинг); самострахування тощо.
Суть хеджування валютного ризику полягає у
використанні інструментів строкових і спот-угод з
іноземною валютою, а також похідних фінансових
інструментів, базисним активом за якими виступає
валюта, позиції за якими протилежні відкритими
валютними позиціями банку.
Рис 2. Методи хеджування валютного ризику
Джерело: складено авторами
Всі ці інструменти банки можуть застосову-
вати як для хеджування валютного ризику клієнтів,
так і ризику банку. Банки найчастіше хеджують
трансакційний ризик клієнта та ризик позикового
капіталу. Співпраця з багатьма зарубіжними парт-
нерами обумовлює значний вплив ризику коливань
обмінних курсів валют на діяльність підприємств-
експортерів. Крім того внаслідок значного часового
лагу між моментом підписання зовнішньоекономі-
чного контракту і моментом отримання чи перера-
хування коштів за ним в компанії виникає транзак-
ційний валютний ризик. Такий ризик є короткотри-
валим. Валютний ризик позикового капіталу
виникає в компанії в період повернення позикових
коштів. Такий ризик є середньотривалим.
Для хеджування транзакційного ризику клієн-
тів банки можуть пропонувати наступні інструме-
нти:
1) валютні форвардні / ф'ючерсні контракти.
Дозволяє зафіксувати обмінний валютний курс до
моменту надходження виручки або оплати заборго-
ваності в іноземній валюті в майбутньому. Це зобо-
в'язання купити / продати валюту за встановленим
курсом на майбутню дату. Є ймовірність упущеної
вигоди при сприятливій зміні цін на об'єкт хеджу-
вання. Якщо ринок СПОТ рухається в несприят-
ливу сторону (для імпортера девальвація, для екс-
портера - зміцнення гривні) то форвардний договір
(з поставкою) може бути пролонгований чи достро-
Зовнішнє
хеджування
(використання похідних
інструментів)
Дозволяють
здійснювати розрахунки
в певний період часу у
майбутньому, що сприяє
перерозподілу грошових
потоків
Передбачають існування
спеціального ринку
(організований ринок та
ринок OTC)
Внутрішнє
хеджування
(угоди на готівковому
ринку)
Виключають ризик
зміни ціни в
майбутньому за рахунок
завчасного характеру
операції
Викликають значні
матеріальні витрати
через необхідність
розрахунків за всією
сумою угоди в один
момент.
Не потребують
спеціального ринку
Контрактне
хеджування
(додаткові умови, які
вносяться в контракт)
Є результатом
домовленостей
контрагентів
Є гнучкими до
індивідуальних потреб
клієнтів
Не потребують
спеціального ринку
Sciences of Europe # 82, (2021) 13
ково припинений. В цьому випадку компанія- імпо-
ртер може ухвалити рішення скерувати гривню
(експортер –– валюту) до ринку СПОТ та пролон-
гувати форвардний контракт;
2) валютні опціонні контракти. Дозволяє ком-
панії отримати право (але не зобов'язання) купити
або продати валюту на майбутню дату за фіксова-
ною на поточний момент ціною, яка інша сторона
зобов'язується задовольнити за премію. У цьому
випадку компанія зберігає за собою право не вико-
ристовувати опціон і отримати вигоду від сприят-
ливого руху валютного курсу.
3) валютний своп / свопціон. Дозволяє компа-
нії зафіксувати (у разі свопу) умови обміну в май-
бутньому платежами в різних валютах з іншою сто-
роною або отримати право провести такий обмін
при несприятливому вибачення валютних курсів (в
разі свопціони).
4) валютно-процентний своп. Цей інструмент
може бути актуальним, якщо у компанії, напри-
клад, є валютні зобов'язання з фіксованою або пла-
ваючою процентною ставкою. Тоді вона може всту-
пити в угоду з іншою стороною, згідно з яким в уз-
годжені терміни вона буде здійснювати платежі в
одній валюті (з встановленої% ставкою) і отриму-
вати процентні платежі у валюті, в якій вона має зо-
бов'язання (кредит).
За даними НБУ в Україні клієнти активно ви-
користовують угоди форвард для купівлі іноземної
валюти з різними строками, переважають коротко-
строкові угоди (від 1 до 3 місяців) до надкоротко-
строкових (до 1 тижня) (рис.3).
В умовах сильної чутливості вітчизняної еко-
номіки до зовнішніх факторів впливу, валютний ри-
зик залишається значним у структурі ринкових ри-
зиків банків та клієнтів. Активне використання ін-
струментів хеджування в Україні звужується за
рахунок: 1) відсутності розвинутої інфраструктури
ринку; 2) нездатності регулятивних механізмів ри-
нку капіталів забезпечити механізм захисту учасни-
ків відносин хеджування; 3) недостатньої кількісті
учасників ринкового середовища для забезпечення
ефективного механізму перерозподілу ризиків за
його допомогою; 4) обмеженої кількісті інструмен-
тів, що пропонується ринком, нездатної комплек-
сно забезпечити потреби хеджерів.
Рис 3. Інструменти хеджування валютного ризику
Джерело: складено авторами на основі [3]
Сьогодні можливості строкового ринку Укра-
їни не здатні в повній мірі задовольнити потреби у
хеджуванні власного економічного валютного ри-
зику. В умовах низьких процентних ставок, над-
лишку ліквідності, забезпечуючи власні потреби у
хеджуванні валютного ризику, банки орієнтуються
на внутрішнє хеджування, а саме технології
спотового ринку, неттінг, перехресне хеджування.
Вітчизняний строковий ринок є недостатньо
розвиненим (частка складає 0,22 трлн. грн. від
об’єму фондового ринку України). При цьому деякі
біржі все ж пропонують клієнтам строкові контра-
кти. Саме валютні ф’ючерси найбільш розповсю-
дженими інструментами вітчизняного біржового
ринку. Зокрема такі контракти пропонує Україн-
ська Біржа, а саме трьох місячні та піврічні
ф’ючерси на валютні пари гривня-долар США [4].
Українська міжбанківська валютна біржа пропонує
більш широкий набір безпоставочних ф’ючерсів на
валютні пари гривня-долар; гривня-євро; гривня-
Sciences of Europe # 82, (2021) 14
російський рубль [5]. Крім того, біржа «Перспек-
тива» може запропонувати шестимісячні ф’ючерси
на валютні пари гривня-долар та гривня-євро [6].
Активними учасниками біржового строкового
ринку є банки. (табл.1.)
Таблиця 1
Банки учасники строкового ринку бірж УМВБ та УБ
Тікер Назва учасника Доступ до торгів строковий ринок
Дата отримання
статусу члена фо-
ндової біржі
ALFAU АТ "АЛЬФА-БАНК" учасник торгів на строковому ринку УБ 07.06.2017
AVGDB АТ "БАНК АВАНГАРД" учасник торгів на строковому ринку УБ 20.01.2017
BOTPU АТ "ОТП БАНК" учасник торгів на строковому ринку УБ 06.01.2021
BVOST ПАТ "БАНК ВОСТОК" учасник торгів на строковому ринку УБ 18.03.2013
GLOBS АТ "КБ "ГЛОБУС" учасник торгів на строковому ринку УБ 10.03.2017
SKYBA АТ "СКАЙ БАНК" учасник торгів на строковому ринку УБ 06.08.2020
BOTPU АТ "ОТП БАНК" учасник торгів на строковому ринку УМВБ 08.10.2012
Джерело: складено автором на основі [4, 5]
Крім того, підлаштовуючись під потреби кліє-
нтів банк може застосовувати засоби позабіржо-
вого ринку (OTC). За результатами аналізу біржо-
вого строкового ринку, з’ясовано, що пропоновані
біржами ф’ючерси є безпоставочними. Натомість, в
залежності від цілей клієнта, банком може бути за-
пропонований, як поставочний, так і безпоставоч-
ний форвард (табл.2).
Таблиця 2
Типи валютних деривативів
Поставочний валютний фор-
вард / ф’ючерс
в рамках такого договору одна сторона зобов’язана в майбутньому в
визначений строк надати базовий актив за форвардним курсом іншій
стороні, котра зобов’язується сплатити та отримати такий актив.
Безпоставочний валютний фо-
рвард/ ф’ючерс NDF
(nondeliverable forward).
в рамках такого деривативу розрахунки між сторонами відбуваються
на основі різниці між форвардним курсом та курсом (СПОТ) на мо-
мент закриття контракту.
Джерело: складено автором
Втім, для цілей хеджування валютного ризику
клієнтів банку доцільно використовувати NDF. Ос-
новними характеристиками такого контракту є: 1)
прогнозний курс - розрахунки та очікування аналі-
тиків, дослідників, експертів щодо курсу в майбут-
ньому; 2) форвардний курс - курс майбутньої угоди,
розрахований на базі поточної різниці ставок по ва-
лютам. Він розраховується:
Форвардний курс (річний) = курс(СПОТ) ∗
(
1+% грн
1+% валюта
) (1.1)
Побудуємо дві схеми валютних форвардів: фо-
рварду на покупку валюти та форварду на продаж.
Для цілей хеджування використана валютна пара
гривня/долар (табл.3, табл. 4). Аналогічна схема
може бути застосована для будь-якої валютної пари
за наявності бажання здійснити операцію як зі сто-
рони покупця валютного контракту, так і зі сторони
продавця.
Таблиця 3
Валютний форвард на купівлю валюти
Вхідні дані: Розрахунок:
Курс СПОТ 25
грн/дол
Ринкова ціна грн
–14%річних
Ринкова ціна
дол–4%річних
Банк не бере на себе валютний ризик і позичає грн на ринку по 14%
На ці гривні він зараз купує валюту (по 25) і розміщує на депозит під 4%
Фактично банк несе витрати у розмірі: 4%-14%= -10% на рік, а за 6 місяців це буде
-5%
4.Банк закладає ці витрати в ціну для клієнта:25+5%=26,25 грн/дол
Але 26,25 це собівартість. Додамо послуги банку –нехай це буде 20 коп, отже ціна
купівлі валюти клієнтом –26,45 грн/дол
Джерело: складено автором на основі [3]
Таблиця 4
Валютний форвард на продаж валюти
Вхідні дані: Розрахунок:
Курс СПОТ 25
грн/дол
Ринкова ціна грн –
14%річних
Ринкова ціна дол–
4%річних
Банк не бере на себе валютний ризик і позичає валюту на ринку під 4%
Цю валюту він зараз продає (по 25) і розміщує гривні на депозит під 14%
Фактично банк отримує прибуток у розмірі: 14%-4%=10% на рік, а за 6 місяців
це буде 5%
Банк додає цей прибуток до ціни для клієнта:25+5%=26,25 грн/дол
Але 26,25 це собівартість. Треба врахувати інтерес банку –але оскільки він ку-
пує, то він віднімає 20 коп, отже ціна продажу валюти клієнтом –26,05 грн/дол
Джерело: складено автором на основі [3]
Sciences of Europe # 82, (2021) 15
Укладання форвардних угод з фізичними осо-
бами стало можливим завдяки подальшій лібералі-
зації валютного ринку та ухваленню постанови
НБУ №3 від 15 січня 2021 р. [7], яка дозволяє фізи-
чним особам дозволено здійснювати форвардні
операції за гривні. Національним Банком [7, 8] пе-
редбачено, що банкам дозволяється здійснювати
операції з продажу клієнтам іноземної валюти за
гривні на умовах «форвард» (з поставкою іноземної
валюти або без її поставки) для операцій з клієн-
тами (юридичними особами та фізичними особами-
підприємцями) для хеджування клієнтами ризику
зміни курсу іноземної валюти за операціями: з екс-
порту та імпорту товару (продукції, робіт, послуг,
прав інтелектуальної власності та інших немайно-
вих прав, призначених для продажу/оплатної пере-
дачі). У квітні 2021р. АТ "АЛЬФА-БАНК" запропо-
нував відповідний фінансовий продукт, та заявив
про першу угоду форвард з фізичною особою з ме-
тою хеджування валютних ризиків.
Висновки. Встановлено, що в умовах сильної
чутливості вітчизняної економіки до зовнішніх фа-
кторів впливу, валютний ризик залишається знач-
ним у структурі ринкових ризиків банків та клієн-
тів. Можливості строкового ринку України не зда-
тні в повній мірі задовольнити потреби у
хеджуванні власного економічного валютного ри-
зику. В умовах низьких процентних ставок, над-
лишку ліквідності, забезпечуючи власні потреби у
хеджуванні валютного ризику, банки орієнтуються
на внутрішнє хеджування, а саме технології
спотового ринку, неттінг, перехресне хеджування.
Запропоновано для хеджування валютного ри-
зику використовувати такі інструменти: 1) валютні
форвардні/ф'ючерсні контракти, що дозволяють за-
фіксувати валютний курс до моменту надходження
виручки або оплати заборгованості в іноземній ва-
люті в майбутньому періоді; 2) розрахунковий фо-
рвард, або NDF при експортно-імпортних розраху-
нках та валютних кредитах для динамічного хеджу-
вання; 3) валютні опціони, що надають компанії
отримати право купити або продати валюту на ви-
значену дату в майбутньому по зафіксованій ціні;
4) валютні свопи/свопціони, як інструменти стати-
чного хеджування, що дозволяє перерозподілити
валютну позицію в часі та передбачає обмін валю-
тою клієнтів з банком. Визначено доцільність хе-
джування валютного ризику здійснювати за допо-
могою короткострокових валютних деривативів (до
1 року).
Література
1. Shapiro, A., 2010, Multinational Financial
Management 9th edition, Hoboken, John Wiley & Sons
Pte Ltd.
2. Солодов А.К. Основы финансового риск-ме-
неджмента: учебник и учебное пособие: Издание
Александра К. Солодова, MasterPrint. 2017. 286 с.
3. Офіційний сайт Національного Банку Укра-
їни.URL: https://bank.gov.ua/ (дата звернення
10.03.2021 р.).
4. Офіційний сайт Української біржі. URL:
http://www.ux.ua/ua/contracts.aspx (дата звернення:
30.03.2021).
5. Офіційний ПрАТ «Українська міжбанків-
ська валютна біржа». URL:
https://infodisclosure.uice.com.ua/StockListFI.aspx
(дата звернення: 30.03.2021).
6. Офіційний сайт «Перспектива» . URL:
http://fbp.com.ua/AnnualReports.aspx (дата звер-
нення: 30.03.2021).
7. Про внесення змін до деяких нормативно-
правових актів Національного банку України. По-
станова Правління Національного Банку України
від 15.01.2021 № 3. URL:
https://zakon.rada.gov.ua/laws/show/v0003500-
21#Text (дата звернення: 19.02.2021).
8. Про затвердження Положення про
здійснення операцій із валютними цінностями. По-
станова Правління Національного Банку України
від 02.01.2019 № 2. URL:
https://zakon.rada.gov.ua/laws/show/v0002500-
19#n76. (дата звернення: 19.02.2021).
Sciences of Europe # 82, (2021) 16
PEDAGOGICAL SCIENCES
ADVANTAGES AND DISADVANTAGES OF DISTANCE LEARNING
Kismetova G.,
Candidate of Pedagogic Sciences,
Associate Professor WKITU
Republic of Kazakhstan. Uralsk
Abdrasilova N.
Master student of WKITU
DOI: 10.24412/3162-2364-2021-82-3-16-20
ABSTRACT
Distance learning is seen as an alternative form of education in a difficult epidemiological situation, which
has led to the separation of teachers and students. The distance education system has become extremely popular
due to its convenience and flexibility. The article presents the main forms of distance learning in secondary school,
highlights the most popular and well-organized platforms for their implementation, shows the advantages and
disadvantages of distance learning, highlights the problems on which are worth paying attention to when switching
to distance education.
Keywords: distance learning, forms of distance learning, web classes, chat classes, teleconferences.
Theoretical framework
In 2019 - 2020 the world was struck by another
epidemic of coronavirus infection, which led to various
transformations in all spheres of life. The consequences
of these changes have naturally affected education as
well. The introduction of quarantine measures led to an
emergency transition of the entire educational process
to distance learning. In this situation, teachers had to
develop both professionally and personally in order to
take new responsibilities, fulfill new roles to meet the
learning and development needs of their students and
society as a whole, since the teacher is the initiator and
conductor of development and transformation in soci-
ety. Essentially, distance education is learning that
takes place in a situation where the teacher and student
are separated by distance or time, or both. For the im-
plementation of distance education today, a variety of
technologies are used: video recordings, broadcast tel-
evision, interactive video, audio recordings and audio
conferencing, web courses (online). The development
and spread of the Internet and computer technology
have revolutionized the concepts of learning and pro-
fessional training. Already today, “virtual high
schools” are becoming a reality, in which the entire
school has access to online courses. But despite its pop-
ularity, online education has not been without prob-
lems. Distance education is not the same as face-to-face
learning. Administering distance learning programs re-
quires different experiences, and for learners, face-to-
face learning is very different from learning on the In-
ternet. Due to the growing demand for distance educa-
tion and the unique experience it creates, especially in
a pandemic, it is important for secondary schools to
know the advantages, disadvantages and challenges of
such online education. In the traditional teaching for-
mat, the teacher develops lessons and transfers their
content to students who study in a full-time environ-
ment . Since during a certain for a period of time, stu-
dents are often offered activities that require them to be
active, rather than passive listening or observation [1];
This educational approach contributes to the develop-
ment productive interaction between all class members.
However, the face-to-face approach has several disad-
vantages, namely:
1) it requires that the students and the teacher to be
physically in the same classroom;
2) information may be inconsistent;
3) lack of flexibility; and, of course, the main
problem is the different level of student learning in the
classroom.
Since each student comes to the office with differ-
ent goals, expectations, experiences and abilities within
a certain topic, the usual universal course does not give
effective results in this situation. It was the shortcom-
ings of this approach that opened up opportunities for
alternative learning paths in the form of web courses or
online education [1]. Distance education is a set of dis-
tance technologies used in within recognized forms of
education (full-time, part-time, part-time). The purpose
of creating distance learning is to reduce the teaching
load on the teacher, improve the quality of education.
The distance education system has become an ex-
tremely popular form of education due to its conven-
ience and flexibility. It removes the main obstacle -
eliminates the need to attendclasses according to the es-
tablished schedule, preventing contact of people in dif-
ficult epidemiological situations [2]. The distance
learning process is based mainly on the independent
cognitive activity of students [3], but this does not ne-
gate the importance of personal communication be-
tween children and the teacher. It is necessary to use
such forms of teaching that will motivate students to
study and at the same time compensate for the lack or
even lack of direct communication between the teacher
and the student. To date, the following forms of dis-
tance learning are being implemented for secondary
schools. Chat sessions that involve student-teacher
communication through online conversations. They can
be represented by text or audio messages, as a rule,
messengers What App, Telegram are used for this in
view of their ease of use, cheapness and prevalence, or
video chats, for which the Skype or other platforms are
used. Web-based classes, which are also implemented
via the Internet, but already in the form of webinars,
Sciences of Europe # 82, (2021) 17
distance lectures, and even ready-made online lessons.
A huge advantage of this form of education is that stu-
dents receive as specific material for study, and the op-
portunity to test your knowledge after passing it. At the
same time, parents and teachers can directly track the
progress of learning. Teleconferencing is a type of con-
ference in which communication is carried out at a dis-
tance fromhelp with special technical and computer fa-
cilities. A teleconference involves the communication
of a large number of participants, united by a common
topic or questions of interest at a distance. At the same
time, during the teleconference, all its participants can
exchange views, ask each other questions. The telecon-
ference allows you to post relevant and interesting mes-
sages on the network, which can be read, having previ-
ously selected the topic of interest. Further, it is possi-
ble to ask a question to the author of the message or
send your own opinion. Thus, a network discussion is
organized [4]. For the full implementation of the school
curriculum, it is necessary to combine all forms of ed-
ucation in order to compensate for the shortcomings of
each. Thus, in the event of a complete forced transition
to distance learning due to the epidemiological situa-
tion, students will be able to receive education without
having to attend school. Modern technologies make
visual information more colorful and dynamic, which
makes it easier and more effective to perceive the ma-
terial. Lack of established frames on conducting a les-
son will allow each student to master the program at
their own pace, paying more attention to more difficult
questions for him, to regulate the intensity of the lesson
themselves. But at the same time, to date, a full transi-
tion to online learning on an ongoing basis for children
of the school period is impossible, because requires
special responsibility and motivation from children and
parents. Group learning in a face-to-face environment
creates an atmosphere of competition and support,
which encourages children to learn, in addition, many
students require a "guardian" who will oversee their
learning process. In the context of distance learning,
this role will shift to parents, who, as a rule, are not
ready for it, not to mention the fact that most of them
work. Also, not every family has sufficient material and
technical support. “The basis of the educational process
in distance learning is the purposeful and controlled in-
tensive independent work of the student, who can study
at a convenient place for himself, according to an indi-
vidual schedule, having with him a set of special teach-
ing aids and an agreed opportunity to contact the
teacher by phone, e-mail and regular mail, as well as in
person” [3]. There are other interpretations of the con-
cepts of distance learning and education, reflecting the
variety of approaches to their understanding.
Thus, distance learning is understood as a set of
technologies that ensure the delivery of the bulk of the
studied material to the learners, the interactive interac-
tion of learners and teachers in the learning process,
providing learners with the opportunity to inde-
pendently work on mastering the material being stud-
ied, as well as in the learning process [4]. Distance
learning is a type of education based on educational in-
teraction between teachers and students who are distant
from each other, implemented using telecommunica-
tion technologies and Internet resources. Distance
learning is the interaction of a teacher and students with
each other at a distance, reflecting all the components
inherent in the educational process (goals, content,
methods, organizational forms, teaching aids) and im-
plemented by specific means of Internet technologies
or other means providing interactivity [5]. The emer-
gence of distance learning has led to the need for the
development and implementation of distance learning
technologies. “Distance learning technologies are un-
derstood as educational technologies, implemented
mainly with the use of information and telecommuni-
cation technologies with mediated (at a distance) or not
completely mediated interaction between a student and
a teacher”[6]. Distance learning has the following ad-
vantages:
• flexibility – students generally do not attend reg-
ular classes in the form of lectures, seminars. Everyone
can study as much as he personally needs to master the
course, discipline and obtain the necessary knowledge
in the chosen specialty;
• modularity – the basis of distance education pro-
grams is a modular principle. Each individual discipline
or row disciplines that are mastered by the student cre-
ate a holistic view of a certain subject area. This makes
it possible to form a training course from a set of inde-
pendent training courses suitable for individual or
group needs [7];
• parallelism - training can be carried out by com-
bining the main professional activity with study, ie. "On
the job";
• long-range action - the distance from the stu-
dent's location to the educational institution (subject to
high-quality communication) is not an obstacle to an
effective educational process;
• asynchrony - in the learning process, the teacher
and the learner can implement the technology of teach-
ing and learning independently in time, ie. according to
a convenient schedule for everyone and at a convenient
pace;
• coverage - "mass character" - the number of stu-
dents is not a critical parameter. They have access to
many sources of educational information (electronic li-
braries, databases), and can also communicate with
each other and with the teacher through communication
networks or using other means of information technol-
ogy [8];
• profitability - economic efficiency of distance
education;
• a new role of a teacher (in the distance learning
system - a tutor), when he is entrusted with such func-
tions as coordinating the cognitive process, adjusting
the taught course, consulting, managing educational
projects, etc. Interaction with learners is carried out
mainly asynchronously with using mail or communica-
tion systems. Allowed and face-to-face contacts are
also welcome;
• a student, in order to undergo distance learning,
must have exceptional self-organization, hard work and
a certain starting level of education;
Sciences of Europe # 82, (2021) 18
• new information technologies – in modern dis-
tance learning, mainly computers, audio-video equip-
ment, systems and means of telecommunications, etc.
are used. Interactive interaction is widely used in dis-
tance learning, which involves a dialogue of any sub-
jects with each other using the means and methods
available to them. At the same time, active participation
in the dialogue of both parties is assumed - exchange of
questions and answers, management of the course of
the dialogue, control over the implementation of deci-
sions made, etc.
teachers and students act, and the meansof engag-
ing in such interactions - email, newsgroups, real-time
dialogues, etc. [9]. Among the disadvantages of dis-
tance learning can be:
• lack of direct face-to-face communication be-
tween students and the teacher. When there is no person
nearby who could emotionally color knowledge, this is
a significant disadvantage for the learning process. It is
difficult to create a creative atmosphere in a group of
students;
• the need for a personal computer and Internet ac-
cess; the need for constant access to sources of infor-
mation, for good technical equipment, but not everyone
who wants to study has a computer and Internet access;
need for technical readiness to use distance learning
tools;
• high requirements for setting the task for train-
ing, administering the process, the complexity of moti-
vating students;
• the problem of user authentication when check-
ing knowledge. It is impossible to tell who is on the
other end of the line[10];
• the need for a whole range of individual psycho-
logical conditions;
• high cost of building a distance learning system
at the initial stage of creating a system, significant costs
for creating a distance learning system, distance learn-
ing courses themselves and the purchase of hardware;
• high labor intensity of the development of dis-
tance learning courses - the creation of 1 hour of truly
interactive multimedia interaction takes more than
1000 hours of professionals [11].
These days distance learning experiences has tem-
porary difficulties such as:
1) insufficient computer literacy of teachers and
trainees, lack of experience in distance learning; many
teachers and students are not yet ready for this teaching
method, preferring the classical education;
2) insufficient development of information and
communication infrastructures in Kazakhstan;
3) training programs and courses are not well de-
veloped due to the fact that there are not so many qual-
ified specialists capable of creating such training aids;
4) poor use of standards in distance learning;
5) the problem of finding specialists. High qualifi-
cation of developers is required; To create high-quality
multimedia courses, you need a team of subject matter
specialist, artist, programmer, etc.;
6) insufficient interactivity of modern distance
learning courses;
7) low percentage of completion of courses due to
insufficient experience in using distance learning sys-
tems and the complexity of motivating students [12].
Therefore, due to these reasons there arise follow-
ing disadvantages of distance learning:
A big disadvantage of this system is eye strain,
which is inevitable when working at a computer. This
is especially harmful to the health of elementary school
students, whose body is being formed. One of the main
shortcomings can be considered the lack of direct (face
to face) communication between students and the
teacher, the loss of emotional contact, emotional sup-
port, which in turn makes the educational process prob-
lematic, complicates the application of an individual
approach. The next disadvantage is the presence of a
number of individual psychological conditions. Dis-
tance learning requires strict self-discipline, and its re-
sult directly depends on independence and the consci-
entiousness of the student. In our opinion, only a small
part of students have a sufficient level of self-discipline
for successful learning in online format [13]. Based on
observations of primary school students, it is concluded
that primary school students lack awareness and inde-
pendence for this training format. For constant access
to information sources, you need good technical equip-
ment: a computer and Internet access. As a rule, stu-
dents feel a lack of practical training. Another signifi-
cant disadvantage is the lack of constant control over
students, which is a powerful tool for inclusion in the
educational process. Without control, the child is con-
stantly distracted by the influence of various external
factors and does not focus on studies. In distance edu-
cation, written assignments predominate, which nega-
tively affects the development of the child's speech and
in the future can lead to difficulties in oral presentation.
Distance teachers, first of all, lacked "live" contact with
students[14-15]. His absence was constraining: it was
more difficult for them to track presence and involve-
ment of students, it is more difficult to build discussions
and discussion of problematic issues. The volume of
pedagogical work has increased due to the preparation
of online lessons, distribution of educational materials
and homework checking. However, according to the
teachers' judgment, distance learning is a technology
that is applicable in schools. Over the past period,
teachers have significantly improved their computer
skills, with computer programs. Having considered the
positive and negative aspects of distance learning, we
can say that much in this process depends on the atti-
tude of teachers, students and parents towards it. If stu-
dents want to gain new knowledge and skills, and
teachers and parents want to help them inachieving this,
then distance learning in the current conditions will be-
come an instrument of comfortable conscious learning
and will not have a negative impact on the result. A year
ago, no one could have imagined that for almost a
whole year, pupils of schools in the Republic of Ka-
zakhstan would study in a distance format. In any case,
the current situation in the world has given us a lot of
experience. And now we can be sure that, despite and
under what circumstances, children will always be able
to receive a quality education, even at home.
Practical Experience
Sciences of Europe # 82, (2021) 19
In my own practice of distance learning, when I
had taught English Language school students up to 9th
gradein the secondary schools. Despite the fact that I
liked this format, I want to talk about the difficulties
that I had to face in teaching school students English
online, especially it was hard with juniors of primary
school.I really love working with groups and am used
to being surrounded by children who, with their spon-
taneity and love of life, charge me with energy. Work-
ing online, you to some extent deprive yourself of that
magical atmosphere that reigns in the classroom: cozy
gatherings in a circle, crafts, games, round dances,
hugs. In addition, it is quite difficult to recognize the
student's feelings and emotions on the other side of the
screen and it is almost impossible to support them in
difficult times. Moreover, in my practice I had a case
that not all children are equally get used to online ac-
tivities. Someone gets lost and embarrassed when meet-
ing a new person through the screen, or gets nervous
and worried if something went wrong. It is much more
difficult for the teacher to keep the situation under con-
trol from a distance.
Referring to the technical part, during my online
teaching experiencein connection with the difficult ep-
idemiological situation, I have used“Zoom” and
“Google Classroom”platforms, one of a number of plat-
forms for distance learning, online meetings and con-
ferences. We used it to conduct practical and lectures
on the lexical and grammatical partand in practical les-
sons when with students we have practiced speaking
abilities entirely with all grades. Having some experi-
ence with this platform, I would like to highlight the
following positive aspects of its use:
• ease of use;
• intuitive and simple interface;
• fast and easy connection to conferences.
Anyone with a link or conference ID can join the
video conference. An event can be scheduled in ad-
vance, as well as a repeating link, that is, for a regular
lesson at a specific time, you can make the same login
link. The listeners were connected both from a station-
ary computer, and from a phone or a tablet (but, accord-
ing to them, it is more convenient to work from a com-
puter). Zoom allows everyone to communicate in real
time, because the platform provides excellent commu-
nication.the possibility of video and audio communica-
tion with each participant. At the same time, both the
organizer and the participants have the ability to turn
off and on the microphone and video. Convenience of
demonstration of materials from the computer screen
(screensharing). Screen sharing is very useful for show-
ing a presentation during a lecture. During the practical
lesson, the teacher can also open one or another file for
demonstration the ability to record the lesson, both on
a computer and on the cloud (this is important for those
students who could not attend the lesson) chat where
you can write messages, transfer filesthe presence of a
breakout rooms function that allows students to be di-
vided into pairs and groups to work together, as is usu-
ally the case during offline classes."
Moreover, such there are a lot of tools and availa-
ble resources and digital tools in English as videos,
online materials, for me, as an English-teacher, it was
very convenient for me to conduct full-fledged distance
classes, using the demonstration of video and audio ma-
terial, presentations, text files, combining various
forms of work: pair, individual, group. The lesson takes
place in the mode of live communication, discussion of
the topic, and the implementation of practical tasks. In
addition I have used such electronic educational plat-
forms YaKlass, MetaShkola, UchiRu, Sky Eng, British
Council, FoxFord, to give a special advantage in the
implementation of distance learning. And, beside of
them I have applied Kahoot games, Quizzlets, Slides,
other game and entertainment platforms with the aim of
rising interest, and therefore the efficiency of studying
In general, my general feelings of distance work
as a teacher are positive. Of course, a big plus is that
everyone is in their own comfort zone - therefore, the
level of assimilation of information can be higher.
In the conclusion, there can be next deductions:
Distance teaching technology helps:
1. "Erase" territorial boundaries.
2. Provide a comfortable learning rhythm for
every student.
3. Automate routine educational processes.
4. To make training more accessible (although
there are controversial points: such training is available
from different parts of the world, it is cheaper than
classroom training, but distance learning necessarily re-
quires certain technical means, its organization is im-
possible "on the fingers").
5. Distance learning cannot be organized in a
hurry. If you think that just a smartphone and a ZOOM
installed on it are enough for an organization, this is a
mistake. A well-thought-out teaching methodology,
verified educational content has not been canceled. An-
other question is that if it is important to start distance
learning urgently (already "today"), for example, in
quarantine conditions, then specialized LCMS with
ready-made modules in a particular subject can help
out. True, alas, it is not possible to find suitable educa-
tional products for all subjects, and you still have to
carry out the difficult work of filling the "shell" with
educational materials.
6. When organizing distance learning, the age of
the students is very important. What is a minus for a
schoolchild, for an adult is absolutely irrelevant, and
vice versa [16].
Modern LCMS, video conferencing platforms can
become the most useful tools for quarantine, but all this
is only if the transition to remote control is made as
strategically competent as possible, which means that
the tasks are clearly defined and the needs and charac-
teristics of the target audience are taken into account.
In this situation, however, the distance learning
format may not only organically fit into the outline of
the future, but also become a priority in it. It is defi-
nitely impossible to exclude this. After all, there are re-
ally many advantages to the remote format. And the
correction of the minuses is in our hands.
Sciences of Europe # 82, (2021) 20
References
1. I.V. Abdrakhmanova, V.A. Balueva, I.V.
Lushchik, Physical education and sports training,
4(30), 119-125 (2019) [Google Scholar]
2. A.V. Ageyevets, V.Yu. Efimov-Komarov,
L.B. Efimova-Komarova, E.A. Nazarenko, M.V.
Puchkova, Scientific notes of the University named af-
ter P.F. Lesgaft, 4(182), 3-9 (2020) [Google Scholar]
3. A.S. Kuznetsov, Z.M. Kuznetsova, Russian
Journal of Physical Education and Sport, 14(4), 5-7
(2019). DOI: 10.14526/20704798-2019-14-4-5-7
[Google Scholar]
4. G.N. Germanov, L.A. Novikova, M.Yu.
Sekovanich, A.N. Korolkov, A.P. Strizhak, Scientific
notes of the University named after P.F. Lesgaft,
10(176), 82-91 (2019) [Google Scholar]
5. Hygienic requirements for personal electronic
computers and organization of work (SanPiN
2.2.2/2.4.1340-03) [Google Scholar]
6. O.U. Digtyar, World of science, culture, edu-
cation, 5(78), 342-344 (2019) [Google Scholar]
7. V.U. Ziambetov, D.V. Brovikov, Academic
journalism, 4, 455-459 (2020) [Google Scholar]
8. S. Kislitsyn, Professor: distance learning is a
profanation of education (URL: https://rossapri-
mavera.ru/article/3dabcedf) [Google Scholar]
9. S.V. Kochetova, International Journal of Hu-
manities and Natural Sciences, 9-1, 32-34 (2019)
[Google Scholar]
10. V.N. Kremneva, L.A. Nepovinnykh, E.M. So-
lodovnik, Questions of pedagogy, 6-1, 184-188 (2020)
[Google Scholar]
11. T.U. Krestyaninova, O.N. Malakh, Bulletin of
Omsk State Pedagogical University. Humanities
research, 1(22), 108-111 (2019) [Google Scholar]
12. O.V. Kuzhelnaya, A.M. Atayan, A.M.
Smirnov, D.G. Petrova, Scientific notes of the Univer-
sity named after Lesgaft P.F., 9(175), 151-153 (2019)
[Google Scholar]
13. T.L. Kuzmenkova, Scientific notes of the Uni-
versity named after Lesgaft P.F., 2(180), 191-195
(2020) [Google Scholar]
14. M.M. Milko, N.V. Guremina, Modern high-
tech technologies, 5, 195-200 (2020) [Google Scholar]
15. A.A. Popova, I.A. Nazarov, Sustainable de-
velopment of science and education, 4, 348-353 (2019)
[Google Scholar]
16. N.V. Popova, Current scientific research in the
modern world, 2-5(46), 144-148 (2019) [Google
Scholar]
ПРОФИЛАКТИКА ПОВРЕЖДЕНИЙ ПОЯСНИЧНО-КРЕСТЦОВОГО ОТДЕЛА
ПОЗВОНОЧНОГО СТОЛБА ПОСРЕДСТВОМ ГИМНАСТИЧЕСКИХ УПРАЖНЕНИЙ В
ПОДГОТОВИТЕЛЬНОЙ ЧАСТИ ЗАНЯТИЯ ДЛЯ ЗАНИМАЮЩИХСЯ СИЛОВЫМИ ВИДАМИ
СПОРТА
Баранхин О.В.
Аспирант
ORCID: 0000-0002-6329-0450
Тюменский Государственный Университет, Институт Физической Культуры,
Тюмень, Россия
LUMBAR-TRUNK INJURIES PREVENTION WITH GYMNASTICS EXERCISES IN WARM-UP
TRAINING SESSION FOR POWER SPORTS
Barankhin. O.
PhD student
Tyumen State University, Institute of physical education,
Tyumen, Russia
DOI: 10.24412/3162-2364-2021-82-3-20-27
АННОТАЦИЯ
В статье рассмотрена проблема недостаточности стабильности и контроля пояснично-крестцового от-
дела во время выполнения соревновательных движений в силовых видах спорта. Данная проблема высту-
пает ведущей среди часто описываемых в приведенной литературе среди большинства видов спорта.
ABSTRACT
At this paper show the main problems with deficit control and stability of lumbar-trunk region during com-
petitive movements in power sports. This issue is the leading one among those described in the literature for most
sports.
Goal of research: create a practical recommendation for lumbar-trunk injuries prevention with gymnastics
exercises in warm-up training session for power athletes. Materials and methods: analyzed a broad online library
sources (PubMed, Research Gate, Cochrane library, MedLine). To the analysis, was take researches with big
groups of participants. Results: The literature survey on the issue raised found the usefulness of the warm-up part
of the session as a way of avoiding injury, but at the same time the evidence base for the performance and effec-
tiveness of gymnastic exercises as prevention of lumbar spine for power sports is insufficient. We have developed
practical recommendations for both the warm-up part and the individual training session in an effort to increase
Sciences of Europe No 82 (2021) Vol. 3

More Related Content

Similar to Sciences of Europe No 82 (2021) Vol. 3

Sciences of Europe journal No 138 (2024)
Sciences of Europe journal No 138 (2024)Sciences of Europe journal No 138 (2024)
Sciences of Europe journal No 138 (2024)Sciences of Europe
 
The scientific heritage No 86 (86) (2022) Vol 3
The scientific heritage No 86 (86) (2022) Vol 3The scientific heritage No 86 (86) (2022) Vol 3
The scientific heritage No 86 (86) (2022) Vol 3The scientific heritage
 
The scientific heritage № 70 (70) (2021) vol 4
The scientific heritage № 70 (70) (2021) vol 4The scientific heritage № 70 (70) (2021) vol 4
The scientific heritage № 70 (70) (2021) vol 4The scientific heritage
 
The scientific heritage VOL 4, No 58 (58) (2021)
The scientific heritage VOL 4, No 58 (58) (2021)The scientific heritage VOL 4, No 58 (58) (2021)
The scientific heritage VOL 4, No 58 (58) (2021)The scientific heritage
 
Sciences of Europe No 84 (2021) Vol. 1
Sciences of Europe No 84 (2021) Vol. 1Sciences of Europe No 84 (2021) Vol. 1
Sciences of Europe No 84 (2021) Vol. 1Sciences of Europe
 
The scientific heritage No 84 (84) (2022) Vol 5
The scientific heritage No 84 (84) (2022) Vol 5The scientific heritage No 84 (84) (2022) Vol 5
The scientific heritage No 84 (84) (2022) Vol 5The scientific heritage
 
The scientific heritage No 68 (68) (2021) Vol 4
The scientific heritage No 68 (68) (2021) Vol 4The scientific heritage No 68 (68) (2021) Vol 4
The scientific heritage No 68 (68) (2021) Vol 4The scientific heritage
 

Similar to Sciences of Europe No 82 (2021) Vol. 3 (20)

Znanstvena misel journal №63 2022 Vol 2
Znanstvena misel journal №63 2022 Vol 2Znanstvena misel journal №63 2022 Vol 2
Znanstvena misel journal №63 2022 Vol 2
 
VOL 3, No 39 (39) (2019)
VOL 3, No 39 (39) (2019)VOL 3, No 39 (39) (2019)
VOL 3, No 39 (39) (2019)
 
VOL 3, No 58 (2020)
VOL 3, No 58 (2020)VOL 3, No 58 (2020)
VOL 3, No 58 (2020)
 
Sciences of Europe journal No 138 (2024)
Sciences of Europe journal No 138 (2024)Sciences of Europe journal No 138 (2024)
Sciences of Europe journal No 138 (2024)
 
Vol 2-no-19-19-2018
Vol 2-no-19-19-2018Vol 2-no-19-19-2018
Vol 2-no-19-19-2018
 
The scientific heritage No 86 (86) (2022) Vol 3
The scientific heritage No 86 (86) (2022) Vol 3The scientific heritage No 86 (86) (2022) Vol 3
The scientific heritage No 86 (86) (2022) Vol 3
 
The scientific heritage № 70 (70) (2021) vol 4
The scientific heritage № 70 (70) (2021) vol 4The scientific heritage № 70 (70) (2021) vol 4
The scientific heritage № 70 (70) (2021) vol 4
 
POLISH-JOURNAL-OF-SCIENCE-№36-2021-VOL.-2
POLISH-JOURNAL-OF-SCIENCE-№36-2021-VOL.-2POLISH-JOURNAL-OF-SCIENCE-№36-2021-VOL.-2
POLISH-JOURNAL-OF-SCIENCE-№36-2021-VOL.-2
 
The scientific heritage VOL 4, No 58 (58) (2021)
The scientific heritage VOL 4, No 58 (58) (2021)The scientific heritage VOL 4, No 58 (58) (2021)
The scientific heritage VOL 4, No 58 (58) (2021)
 
Sciences of Europe No 84 (2021) Vol. 1
Sciences of Europe No 84 (2021) Vol. 1Sciences of Europe No 84 (2021) Vol. 1
Sciences of Europe No 84 (2021) Vol. 1
 
Vol 2, № 41 (2019)
Vol 2, № 41 (2019)Vol 2, № 41 (2019)
Vol 2, № 41 (2019)
 
Norwegian Journal of development of the International Science №8 part 3
Norwegian Journal of development of the International Science №8 part 3Norwegian Journal of development of the International Science №8 part 3
Norwegian Journal of development of the International Science №8 part 3
 
The scientific heritage No 84 (84) (2022) Vol 5
The scientific heritage No 84 (84) (2022) Vol 5The scientific heritage No 84 (84) (2022) Vol 5
The scientific heritage No 84 (84) (2022) Vol 5
 
Vol 2-no-12-12-2017
Vol 2-no-12-12-2017Vol 2-no-12-12-2017
Vol 2-no-12-12-2017
 
VOL 4, No 60 (2020)
VOL 4, No 60 (2020)VOL 4, No 60 (2020)
VOL 4, No 60 (2020)
 
VOL 7, No 54 (54) (2020)
VOL 7, No 54 (54) (2020)VOL 7, No 54 (54) (2020)
VOL 7, No 54 (54) (2020)
 
The scientific heritage No 68 (68) (2021) Vol 4
The scientific heritage No 68 (68) (2021) Vol 4The scientific heritage No 68 (68) (2021) Vol 4
The scientific heritage No 68 (68) (2021) Vol 4
 
VOL 1, No 56 (56) (2020)
VOL 1, No 56 (56) (2020)VOL 1, No 56 (56) (2020)
VOL 1, No 56 (56) (2020)
 
Vol 2-no-23-23-2018
Vol 2-no-23-23-2018Vol 2-no-23-23-2018
Vol 2-no-23-23-2018
 
POLISH-JOURNAL-OF-SCIENCE-№30-2020-VOL.-2
POLISH-JOURNAL-OF-SCIENCE-№30-2020-VOL.-2POLISH-JOURNAL-OF-SCIENCE-№30-2020-VOL.-2
POLISH-JOURNAL-OF-SCIENCE-№30-2020-VOL.-2
 

More from Sciences of Europe

Sciences of Europe jounal No 140 (2024)
Sciences of Europe jounal  No 140 (2024)Sciences of Europe jounal  No 140 (2024)
Sciences of Europe jounal No 140 (2024)Sciences of Europe
 
Sciences of Europe journal No 139 (2024).pdf
Sciences of Europe journal No 139 (2024).pdfSciences of Europe journal No 139 (2024).pdf
Sciences of Europe journal No 139 (2024).pdfSciences of Europe
 
Sciences of Europe journal No 137 (2024)
Sciences of Europe journal No 137 (2024)Sciences of Europe journal No 137 (2024)
Sciences of Europe journal No 137 (2024)Sciences of Europe
 
Sciences of Europe journal No 136 (2024)
Sciences of Europe journal No 136 (2024)Sciences of Europe journal No 136 (2024)
Sciences of Europe journal No 136 (2024)Sciences of Europe
 
"Sciences of Europe" journal No 135 (2024)
"Sciences of Europe" journal No 135 (2024)"Sciences of Europe" journal No 135 (2024)
"Sciences of Europe" journal No 135 (2024)Sciences of Europe
 
Sciences of Europe No 134 (2024)
Sciences of Europe No 134 (2024)Sciences of Europe No 134 (2024)
Sciences of Europe No 134 (2024)Sciences of Europe
 
Sciences of Europe No 133 (2024)
Sciences of Europe No 133 (2024)Sciences of Europe No 133 (2024)
Sciences of Europe No 133 (2024)Sciences of Europe
 
Sciences of Europe No 132 (2023)
Sciences of Europe No 132 (2023)Sciences of Europe No 132 (2023)
Sciences of Europe No 132 (2023)Sciences of Europe
 
Sciences of Europe No 131 (2023)
Sciences of Europe No 131 (2023)Sciences of Europe No 131 (2023)
Sciences of Europe No 131 (2023)Sciences of Europe
 
Sciences of Europe No 130 (2023)
Sciences of Europe No 130 (2023)Sciences of Europe No 130 (2023)
Sciences of Europe No 130 (2023)Sciences of Europe
 
Sciences of Europe No 129 (2023)
Sciences of Europe No 129 (2023)Sciences of Europe No 129 (2023)
Sciences of Europe No 129 (2023)Sciences of Europe
 
Sciences of Europe No 128 (2023)
Sciences of Europe No 128 (2023)Sciences of Europe No 128 (2023)
Sciences of Europe No 128 (2023)Sciences of Europe
 
Sciences of Europe No 127 (2023)
Sciences of Europe No 127 (2023)Sciences of Europe No 127 (2023)
Sciences of Europe No 127 (2023)Sciences of Europe
 
Sciences of Europe No 126 (2023)
Sciences of Europe No 126 (2023)Sciences of Europe No 126 (2023)
Sciences of Europe No 126 (2023)Sciences of Europe
 
Sciences of Europe No 125 (2023)
Sciences of Europe No 125 (2023)Sciences of Europe No 125 (2023)
Sciences of Europe No 125 (2023)Sciences of Europe
 
Sciences of Europe No 124 (2023)
Sciences of Europe No 124 (2023)Sciences of Europe No 124 (2023)
Sciences of Europe No 124 (2023)Sciences of Europe
 
Sciences of Europe No 123 (2023)
Sciences of Europe No 123 (2023)Sciences of Europe No 123 (2023)
Sciences of Europe No 123 (2023)Sciences of Europe
 
Sciences of Europe No 122 (2023)
Sciences of Europe No 122 (2023)Sciences of Europe No 122 (2023)
Sciences of Europe No 122 (2023)Sciences of Europe
 
Sciences of Europe No 121 (2023)
Sciences of Europe No 121 (2023)Sciences of Europe No 121 (2023)
Sciences of Europe No 121 (2023)Sciences of Europe
 
Sciences of Europe No 120 (2023)
Sciences of Europe No 120 (2023)Sciences of Europe No 120 (2023)
Sciences of Europe No 120 (2023)Sciences of Europe
 

More from Sciences of Europe (20)

Sciences of Europe jounal No 140 (2024)
Sciences of Europe jounal  No 140 (2024)Sciences of Europe jounal  No 140 (2024)
Sciences of Europe jounal No 140 (2024)
 
Sciences of Europe journal No 139 (2024).pdf
Sciences of Europe journal No 139 (2024).pdfSciences of Europe journal No 139 (2024).pdf
Sciences of Europe journal No 139 (2024).pdf
 
Sciences of Europe journal No 137 (2024)
Sciences of Europe journal No 137 (2024)Sciences of Europe journal No 137 (2024)
Sciences of Europe journal No 137 (2024)
 
Sciences of Europe journal No 136 (2024)
Sciences of Europe journal No 136 (2024)Sciences of Europe journal No 136 (2024)
Sciences of Europe journal No 136 (2024)
 
"Sciences of Europe" journal No 135 (2024)
"Sciences of Europe" journal No 135 (2024)"Sciences of Europe" journal No 135 (2024)
"Sciences of Europe" journal No 135 (2024)
 
Sciences of Europe No 134 (2024)
Sciences of Europe No 134 (2024)Sciences of Europe No 134 (2024)
Sciences of Europe No 134 (2024)
 
Sciences of Europe No 133 (2024)
Sciences of Europe No 133 (2024)Sciences of Europe No 133 (2024)
Sciences of Europe No 133 (2024)
 
Sciences of Europe No 132 (2023)
Sciences of Europe No 132 (2023)Sciences of Europe No 132 (2023)
Sciences of Europe No 132 (2023)
 
Sciences of Europe No 131 (2023)
Sciences of Europe No 131 (2023)Sciences of Europe No 131 (2023)
Sciences of Europe No 131 (2023)
 
Sciences of Europe No 130 (2023)
Sciences of Europe No 130 (2023)Sciences of Europe No 130 (2023)
Sciences of Europe No 130 (2023)
 
Sciences of Europe No 129 (2023)
Sciences of Europe No 129 (2023)Sciences of Europe No 129 (2023)
Sciences of Europe No 129 (2023)
 
Sciences of Europe No 128 (2023)
Sciences of Europe No 128 (2023)Sciences of Europe No 128 (2023)
Sciences of Europe No 128 (2023)
 
Sciences of Europe No 127 (2023)
Sciences of Europe No 127 (2023)Sciences of Europe No 127 (2023)
Sciences of Europe No 127 (2023)
 
Sciences of Europe No 126 (2023)
Sciences of Europe No 126 (2023)Sciences of Europe No 126 (2023)
Sciences of Europe No 126 (2023)
 
Sciences of Europe No 125 (2023)
Sciences of Europe No 125 (2023)Sciences of Europe No 125 (2023)
Sciences of Europe No 125 (2023)
 
Sciences of Europe No 124 (2023)
Sciences of Europe No 124 (2023)Sciences of Europe No 124 (2023)
Sciences of Europe No 124 (2023)
 
Sciences of Europe No 123 (2023)
Sciences of Europe No 123 (2023)Sciences of Europe No 123 (2023)
Sciences of Europe No 123 (2023)
 
Sciences of Europe No 122 (2023)
Sciences of Europe No 122 (2023)Sciences of Europe No 122 (2023)
Sciences of Europe No 122 (2023)
 
Sciences of Europe No 121 (2023)
Sciences of Europe No 121 (2023)Sciences of Europe No 121 (2023)
Sciences of Europe No 121 (2023)
 
Sciences of Europe No 120 (2023)
Sciences of Europe No 120 (2023)Sciences of Europe No 120 (2023)
Sciences of Europe No 120 (2023)
 

Sciences of Europe No 82 (2021) Vol. 3

  • 1. No 82 (2021) Vol. 3 Sciences of Europe (Praha, Czech Republic) ISSN 3162-2364 The journal is registered and published in Czech Republic. Articles in all spheres of sciences are published in the journal. Journal is published in Czech, English, Polish, Russian, Chinese, German and French, Ukrainian. Articles are accepted each month. Frequency: 24 issues per year. Format - A4 All articles are reviewed Free access to the electronic version of journal Edition of journal does not carry responsibility for the materials published in a journal. Sending the article to the editorial the author confirms it’s uniqueness and takes full responsibility for possible consequences for breaking copyright laws. Chief editor: Petr Bohacek Managing editor: Michal Hudecek • Jiří Pospíšil (Organic and Medicinal Chemistry) Zentiva • Jaroslav Fähnrich (Organic Chemistry) Institute of Organic Chemistry and Biochemistry Academy of Sciences of the Czech Republic • Smirnova Oksana K., Doctor of Pedagogical Sciences, Professor, Department of History (Moscow, Russia); • Rasa Boháček – Ph.D. člen Česká zemědělská univerzita v Praze • Naumov Jaroslav S., MD, Ph.D., assistant professor of history of medicine and the social sciences and humanities. (Kiev, Ukraine) • Viktor Pour – Ph.D. člen Univerzita Pardubice • Petrenko Svyatoslav, PhD in geography, lecturer in social and economic geography. (Kharkov, Ukraine) • Karel Schwaninger – Ph.D. člen Vysoká škola báňská – Technická univerzita Ostrava • Kozachenko Artem Leonidovich, Doctor of Pedagogical Sciences, Professor, Department of History (Moscow, Russia); • Václav Pittner -Ph.D. člen Technická univerzita v Liberci • Dudnik Oleg Arturovich, Doctor of Physical and Mathematical Sciences, Professor, De- partment of Physical and Mathematical management methods. (Chernivtsi, Ukraine) • Konovalov Artem Nikolaevich, Doctor of Psychology, Professor, Chair of General Psy- chology and Pedagogy. (Minsk, Belarus) «Sciences of Europe» - Editorial office: Křižíkova 384/101 Karlín, 186 00 Praha E-mail: info@european-science.org Web: www.european-science.org
  • 2. CONTENT ECONOMIC SCIENCES Avagyan G., Vardanyan Q., Petrosyan G., Navasardyan M., Margaryan A. THE MALMQUIST PRODUCTIVITY INDEX AND ITS ANALYSIS ON THE EXAMPLE OF THE RA .....................3 Krasnova І., Shevaldina V. METHODS OF HEDGING CURRENCY RISK BY BANKS .10 PEDAGOGICAL SCIENCES Kismetova G., Abdrasilova N. ADVANTAGES AND DISADVANTAGES OF DISTANCE LEARNING..................................................................16 Barankhin. O. LUMBAR-TRUNK INJURIES PREVENTION WITH GYMNASTICS EXERCISES IN WARM-UP TRAINING SESSION FOR POWER SPORTS...................................20 Antonova N., Karaeva A. THE MAIN CONDITIONS FOR THE SUCCESSFUL ADAPTATION OF YOUNG CHILDREN TO KINDERGARTEN CONDITIONS ...................................28 Kramarenko L. THE PRINCIPLE OF OPERATION OF ELECTRONIC CONSULTING TERMINALS ON THE EXAMPLE OF THE PROVISION OF SOCIAL AND LEGAL SERVICES ...........30 Matiienko O. MODERN METHODOLOGICAL APPROACHES TO TRAINING OF FUTURE FOREIGN LANGUAGE TEACHERS IN MODULE SYSTEM ................................32 Tolkacheva G., Gaidukova K. PEER EDUCATION OF PRESCHOOL CHILDREN IN THE FAMILY: PROBLEMS AND PROSPECTS .......................36 Kulmagambetova S., Tolegen A. DEVELOPMENT OF ORAL SPEECH SKILLS IN ENGLISH LESSONS AT GENERAL EDUCATIONAL SCHOOL.........42 Khamitova D., Nurusheva T. DISCUSSION AS A METHOD OF FORMATION OF COMMUNICATION SKILLS IN HIGH SCHOOL .............44 PHILOLOGICAL SCIENCES Gorzhaya A., Bogdanov L. THE SPECIFICITY AND METHODS OF TRANSLATION OF ATTRIBUTIVE COMBINATIONS BASED ON THE MATERIAL OF POPULAR SCIENCE TEXTS ...................47 Kozhemyakina V. DISTINCTIVE FEATURES OF THE DEMOLINGUISTIC SITUATION IN THE REPUBLIC OF BASHKORTOSTAN..50 PSYCHOLOGICAL SCIENCES Kosykh G. ACMEOLOGICAL UNDERSTANDING OF PERSONALITY AND ITS DEVELOPMENT............................................55
  • 3. Sciences of Europe # 82, (2021) 3 ECONOMIC SCIENCES THE MALMQUIST PRODUCTIVITY INDEX AND ITS ANALYSIS ON THE EXAMPLE OF THE RA Avagyan G., Associate Professor, PhD in Economics Armenian State University of Economics (ASUE) https://orcid.org/0000-0003-3395-2473 Vardanyan Q., Associate Professor, PhD in Economics Armenian State University of Economics (ASUE) https://orcid.org/0000-0002-7198-3740 Petrosyan G., Armenian State University of Economics (ASUE) https://orcid.org/0000-0002-4711-7615 Navasardyan M., PhD Student Armenian State University of Economics (ASUE) https://orcid.org/0000-0002-5474-6401 Margaryan A. PhD Student Armenian State University of Economics (ASUE) DOI: 10.24412/3162-2364-2021-82-3-3-10 ABSTRACT One of the pillars of assessing the competitiveness of the country's economy is the degree of efficiency of its output, which mostly depends on the productivity of factors used in the production process, as well as on the effectiveness of production, organization and control. The professional literature has repeatedly referred to the evaluation of competitiveness and effectiveness. In this context, the Malmquist index is one of the most commonly used and comprehensive indicators for measuring productivity and efficiency. The contribution of this paper is the Malmquist index application in calculation of gross domestic production efficiency for a group of more than hun- dred countries, which will let us to reveal the trends in the dynamics of the country's competitiveness. Besides, that will help to identify the underlying issues that hinder the economic productivity of the observing country, in particular, the Republic of Armenia, and, consequently, its competitiveness. The explorations showed that the index in the context of economic efficiency is capable of detecting competitive advantage and disadvantage of any decision-making unit over other ones: in the RA they are pure efficiency change and scale efficiency change ac- cordingly. Besides, the results indicated oscillatory nature of Armenia GDP efficiency change of production pro- cess and stable nature of production frontier shift. Keywords: competitiveness, Malmquist index, total factor productivity, technical efficiency, scale efficiency JEL classification: O47 Introduction Many researchers put the efficiency of the produc- tion and the productivity of the resources used in this process among the pillars that form the competitiveness of the country's economy, or at the basis of the assess- ment of competitiveness. The "iceberg" model of com- petition (Peneder, 2017) offers a vertical classification of competitiveness targets and engines, the starting point of which is productivity. On the other hand, all the economic agents in the world are struggling to man- age the allocation of resources, thus, in this study, the terms "competitiveness” and “efficiency" are intercon- nected with each other. The current geopolitical and socio-economic situ- ation in the Republic of Armenia contains great risks of a negative impact on the country's production potential. The consequences of a further decline in the country's attractiveness for labor emigration and investment could lead to a long-term decline in the country's eco- nomic resources. Therefore, it is generally very im- portant to find out and keep issues of resources and pro- duction efficiency in the center of attention on an ongo- ing basis. Determining the level of efficiency of the output produced in a country provides a valuable insight into economic behavior and provides an opportunity to compare it with other economies. If countries do not use their resources properly, it is definitely an indica- tion of the need of making adjustments in the measures of production organization and improvement of its ef- ficiency. Normally, the growth rate of the output for a cer- tain period of time differs from the growth rate of the labour force and the capital participation in that process in the same period of time. This can be explained by change in total factor productivity (TFP), that is, the ability to use and combine factors more efficiently over time. This may be due to changes in certain qualities (more relevant skills or new technologies introduced) or to more optimal methods of enterprise production management. TFP is directly associated with the real driving force behind product growth, which is related
  • 4. Sciences of Europe # 82, (2021) 4 to technological innovation and efficiency improve- ment. It can be achieved by improving labor skills and capital management. TFP plays a critical role on eco- nomic fluctuations, economic growth and cross-coun- try per capita income differences. At business cycle fre- quencies, TFP strongly correlates with output and hours worked (Comin, 2006). It plays a significant role in im- proving the country's competitiveness, especially in the current context of severe resource constraints. The economic literature has repeatedly referred to the assessment of the efficiency. Different authors have developed and have even separated several components in the nature of this concept in order to analyze it in more detail. Hawdon (2003) attributed efficiency to three main properties: technical, economic, and distri- butional. Melecky and Stanickova (2012) analyzed ef- ficiency by the example of European countries, describ- ing it as a reflection of the level of potential competi- tiveness. The original idea of the Malmquist index proposed Swedish economist-statistician Stan Malmquist in 1953. He suggested comparing the input of a firm at two different points of time in terms of the maximum factor by which the input in one period could be de- creased such that the firm could still produce the same output level of the other period. Later, this idea of in- put-reducing ratio expanded and became Malmquist Productivity Index (Caves et al., 1982). There was a re- surgence of interest in its application in 1994, when the Malmquist index of improvement of output was calcu- lated on the panel data basis, assuming a stable return on production. The calculated index was the average geometric mean of the two TFP indices. For example, Dai and Liu (2009) estimated the ef- ficiency and productivity growth of 16 major high-tech companies in China in 2002-2007. Sharma and Thomas (2008) calculated the same index for 20 OECD member countries, the Russian Federation and China. Lu and Liu (2010) employed the Malmquist index, to decom- pose productivity growth into technical efficiency and technological change. The results indicate that the in- crease in R&D productivity is mainly attributed to the increase in technical change, and the efficiency gain found is largely the result of improvements in scale ef- ficiency։ Park (2014) analyzed the efficiency and productivity change within government subsidy recipi- ents of a national technology innovation research and development (R&D) program. Another attempt to calculate the Malmquist index revealed the trends in productivity growth of OECD member countries in 1981-2006. The assessment was carried out for each 5 years period, calculating the av- erage of total factor productivity. The results show that the annual growth of TFP varies considerably, as sig- nificant fluctuations have been observed over time in the member countries. In most of them, the annual TFP has significantly deteriorated. In particular, the decline in productivity has been more perceptible since 2001. During 2001-2006, the average annual change in the TFP in the OECD area was negative. Only Germany and Japan from the Group of the Seven recorded a pos- itive change of the TFP during that period. The results did not provide strong evidence that huge investments in information technology, particularly in the second half of the 1990s, clearly boosted the productivity of large industrialized countries. In fact, in many of the surveyed countries the growth of TFP has slowed sig- nificantly during the 1990s compared to the 1980s. Of the Scandinavian countries, only Finland, Norway and Sweden have been able to record leading productivity growth in this comparison. Australia and New Zealand also experienced relatively higher productivity growth, but mainly in the early 1990s. With the exception of these countries, GDP growth was relatively weak in most of the OECD area in the 1990s, including the G7 countries. As mentioned above, such a weak increase in productivity continued and sometimes even became negative after 2000. Another interesting example of the application of the Malmquist index is the assessment of the produc- tivity of the construction sector in eight Australian states in 1990-2007. As input factors of construction were used the construction work and the number of people working in that field. The first of these is a com- posite indicator, which includes payments for the sup- ply of raw materials, labor prices and speculative con- tracts. As an output of the production, the value added in the construction sector in the respective state was used. The results of the research describe how the tech- nology of this field, the net technical efficiency and the scale of the economy affect the change of construction productivity. The analysis is carried out not only at the state level, but also at the national level. The study shows how the technology, technological efficiency and scale of economy affect on the change of overall productivity. Although the growth rates of construction productivity in the Australian states did not show obvi- ous differences, the growth factors were to some extent different (Li & Liu, 2010). Thus, one of the theoretically substantiated and the most common indicators measuring total factor produc- tivity and the quality of production organization is the Malmquist productivity index, which stands out for its unique and meaningful nature among other estimates. During the calculation and interpretation of the in- dex, the keyword "change" is not stressed accidentally. The point is that the calculated index is obtained for each period by comparing the end and beginning of the period, or that it is the same, through change. The Malmquist index for the period is the ratio of two distance functions that, under stable conditions of production technology, measure the maximum propor- tional change in factors-output combination from the previous (t-1) to the observed (t) period. The Malmquist TFP index is a geometric mean of two Malmquist indices (Karmann & Roesel, 2016). The dif- ference between them lies in the production technolo- gies: in one case, it refers to the previous period, and in the other to the observed one. M(yt, xt, yt−1, xt−1) = √[ Dt−1 (xt, yt) Dt−1 (xt−1, yt−1) × Dt (xt, yt) Dt (xt−1, yt−1) ] (1) The index introduces TFP of current DMU at point (xt, yt) in comparision with (xt−1, yt−1) point. If the
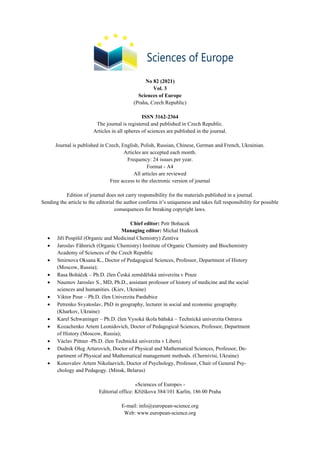
  • 5. Sciences of Europe # 82, (2021) 5 value of the index is greater than, less or equal to 1, then the TFP has either progressed (increased productivity) or experienced a decline (decreased productivity), or the TFP change, respectively has missed. Thus, to cal- culate the index describing the change in TFP for each DMU, four distance functions must be calculated to measure the TFP change between two periods, t and t+1. This requires solving four LP problems (Li, 2009). After some mathematical modifications the Malmquist TFP index can be divided into two compo- nents, which are meaningful in context of economic logic: efficiency change (ECH) and technological effi- ciency change (TECH). The first refers to the change in the efficiency of the factors and the change in the opti- mal operation of the existing factors. The second de- scribes the change in production frontier, in other words, technological progress. It should be noted that now in the professional literature such a decomposition of the Malmquist TFP index appears as a generally agreed approach. M(yt, xt, yt−1, xt−1) = Dt (xt, yt) Dt−1 (xt−1, yt−1) × √( Dt−1 (xt, yt) Dt(xt−1, yt−1) × Dt−1 (xt, yt) Dt (xt−1, yt−1) ) (2) The discussed TFP evaluation criterion includes another stage of separation, which follows in the “foot- steps” of the primary sources of the efficiency of re- sources involved in the production process: the change in factor efficiency is explained by two circumstances: a pure change in efficiency (PECH) and a change in ef- ficiency from scale (SECH). Malmquist TFP index = PECH × TECH = PECH × SECH × TECH (3) Malmquist TFP indices calculations research for the period 1995-2019 covers 123 countries and groups of countries, including the whole world, as one DMU. The calculations are based on GDP (World Bank, 2020a) as an output, gross fixed capital formation (World Bank, 2020b) and labor force (International La- bor Organization, 2021) as factors of production. The research carried out within the framework of the “Comprehensive and Enhanced Partnership Agree- ment” involves the development and maintenance of a number of trendy statistical software packages. The technical solutions for Malmquist index study were provided through one of those programs (CEPA, 1996), which allows to calculate the indicators presented in Equation 2. Figure 1․ The scatter of efficiency and technical efficiency changes means of observed 123 DMUs In Figure 1, there are introduced the average val- ues of the first-degree decomposition of the studied countries’ Malmquist index, which are the geometric means of each DMU. The highlighted numbers repre- sent the average of the corresponding type of efficiency for the whole world as one DMU (more than 200 coun- tries). It should be noted that the change in technical efficiency level in the world has generally declined, de- creasing by 0.4 percent in the observed period, while the ECH has been positive by the same amount as TECH. As a counterargument to this, more unstable na- ture of the ECH variance is determined, while the TECH mainly fluctuates in the range much closer to unit. The highest level of TECH was registered in 2009 (Figure 2), increasing by 11․4 percent, and the lowest in 2018 (-14.5 percent). It is interesting that the Malmquist TFP index also showed its highest level in 2009 (7.7 percent) and the lowest in 2019 (-7.3 per- cent). On the other hand, the highest level of ECH was in 2018 (16.6 percent), and the lowest in 2000 (-9.2 per- cent). Armenia; 1,017 World; 1,004 Armenia; 0,995 World; 0,996 0,96 0,98 1 1,02 1,04 Efficiency change Technical efficiency change
  • 6. Sciences of Europe # 82, (2021) 6 Figure 2․ Average Total factor productivity and scale efficiency changes in the world during 1996-2019 The dynamics of production process efficiency and technical efficiency changes illustrates some inter- esting facts about the nature and the causes of produc- tion efficiency in the world during last two decades. At first, it is noticable that almost every year during the observed period, trends of two main characteristics de- scribing TFP are opposite. That is, for example, in case of efficiency positive change, technical efficiency de- clines. Although it is an expected scenario (as if efforts are aimed to improve production process efficiency and productivity of factors, may lead the DMU to lag be- hind the global trends of research and technological de- velopment), it is possible for DMU to simultaneously improve both types of efficiency (as in 2009). Օther- wise, such a contraindication can occur due to the lag between achievements of scientific and technical pro- gress with production process efficiency. This means, that when technical efficiency increases (TECH), that is production frontier shifts, current level of organiza- tional efficiency of production process does not react to it simultaneusly. Therefore, that opposite thrends have to be handled by synchronizing two main types of effi- ciency changes. An interesting behaviour of efficiency indicators is noticable In Figure 2: there are large amplitude fluc- tuations of Malmquist index first level components no- ticed after 2008, which is probably caused by the global financial and economic crisis and its consequences. Figure 3․ Dynamics of Malmquist TFP indices of members of Eurasian Economic Union (EAEU) 0,8 0,9 1 1,1 1,2 2000 2001 2002 2003 2004 2005 2006 2007 2008 2009 2010 2011 2012 2013 2014 2015 2016 2017 2018 2019 Efficiency change Technical efficiency change Total factor productivity 0,7 0,8 0,9 1 1,1 1,2 1,3 2000 2001 2002 2003 2004 2005 2006 2007 2008 2009 2010 2011 2012 2013 2014 2015 2016 2017 2018 2019 Armenia Belarus Kazakhstan Kyrgyzstan Russia
  • 7. Sciences of Europe # 82, (2021) 7 Let us make a transition to the indicators of spe- cific countries, in particular, further analysis will be on the example of the Republic of Armenia (RA), though the calculations allow to do the same for all of the ob- served DMUs (Authours’ calculations, 2021).1 Taking into account the economic and mathematical nature of the index, in the professional literature it is accepted to analyze indices in some comparison edges. Therefore, before getting acquainted with all the index compo- nents of the Republic of Armenia separately, let us make some comparative analysis of Armenia and other DMUs. Thus, from the presented Figure 3, we can first no- tice that in the observed period, according to the change of the TFP, there are no highlighted leaders among EAEU members. The sharp fluctuations of the change in TFP of RA in 2002 and 2011 are noticeable: in the first case the negative change was more than 20 per- cent, but in the second case the difference was positive (25.2 percent). Note that not only for those years the trends of the EAEU member states coincide to some extent, but also for the years after the founding of the union (2015). In recent years, the changes in their TFP are almost identical, though in the case of the last ob- servation only Armenia registered a positive result in the list of those DMUs, with a 4.6 percent change. In addition, the Malmquist TFP index of RA was the best among the members of the union in 2007, 2009, 2011, as we have already mentioned, in 2019, and the lowest only in 2002. The main reason for that decline was 33․ 2 percent increase in investment (a slight increase in la- bor force), which significantly exceeded the economic growth based on it (13․2 percent). Figure 4․ Dynamics of Malmquist TFP indices of Armenia and countries comparable to it In Figure 4 there are represented discussing index of Armenia and other comparable by GDP per capita countries. In this group of countries, too, according to the assessed index, there is no emphasized leader. Only Ukraine has obvious fluctuations: more than 30 per- cent, and this can be seen in several year indicators. As for the position of the Republic of Armenia in such a framework of monitoring the index, it should be noted 1 Authours’ calculations. (2021). Malmquist TFP indices and their components [database]. Available in that it was the lowest not only in 2002, as in the previ- ous group of countries, but also in 2004, 2005 and 2015. The noticeable negative shift in 2015 (0.984) was mainly due not to the low level of that year's compo- nents decline, but to the high ranks of ECH and TECH in 2014, as a result of which the index in 2015 was the lowest among negative and comparable countries. It should also be noted that Armenia was the leader in this list in 2007, 2011, 2017 and 2018. https://docs.google.com/spreadsheets/d/1mi- hYj2rV5lWWYA54BvfTFaad-upUNajl8cF5s-KcIZk 0,7 0,9 1,1 1,3 1,5 1,7 2000 2001 2002 2003 2004 2005 2006 2007 2008 2009 2010 2011 2012 2013 2014 2015 2016 2017 2018 2019 Armenia Moldova Ukraine Iran Lebanon
  • 8. Sciences of Europe # 82, (2021) 8 Figure 5․ Malmquist TFP index and its components dynamics of Armenia In order to explain the dynamics of the Malmquist TFP index of the RA and to justify its movement objec- tively, we have also observed the components of the in- dex. Looking at Figure 5 we can notice the shift in the index of Armenia is generally caused by the ECH, that is, the change in resources and their management effi- ciency. Its change, in its turn, is due to more PECH, which fluctuates in the range 0․788-1․255, while SECH, which is the other component of ECH, is in the narrow range 0․983-1․068 during the observed period. Such a small difference of efficiency gained from pro- duction scale change in Armenia hints about the need to enter new markets, especially outside, as satisfaction of internal demand is already quite saturated. The maximum value that Armenia scored in the period under review is 1.172 in 2011, which means that the country has improved its TFP by 17.2 percent com- pared to 2010, while the TFP change of the whole world for the same year was negative (-11․3 percent). There is also a significant difference with the index calculated for the world - in the case of the lowest index registered in the last 20 years of the Republic of Armenia (in 2002 was 0.896), the rather deep negative index of our coun- try is opposed to the positive tendency of the same in- dex in the world (1.027). Thus, Malmquist TFP index provides extensive information about DMU’s effectiveness, as well as competitiveness. It allows to explain the fluctuations of the TFP dynamics and the obstacles to improving com- petitiveness. Thanks to index decomposition into inter- pretable in macroeconomic context indicators it is pos- sible to separate efficiency types observed during pro- duction process. Malmquist TFP index in the world has been gen- erally close to 1 during the years 1996-2019, that is the change in TFP has been missing. The reasing are the contradictory tendencies of the two components of the index, which represent the change in the shift in pro- duction frontier (TECH) and in change of efficiency of production factors or production organization process (ECH). In particular, TECH has decreased, but a posi- tive shift has been recorded in ECH, and both to the same extent. 0,7 0,8 0,9 1 1,1 1,2 1,3 2000 2001 2002 2003 2004 2005 2006 2007 2008 2009 2010 2011 2012 2013 2014 2015 2016 2017 2018 2019 Efficiency change Technical efficiency change Pure efficiency change Scale efficiency change Total factor productivity
  • 9. Sciences of Europe # 82, (2021) 9 Figure 6․ Average Total factor productivity and scale efficiency changes of compared countries during 1996-2019 As the analysis of the observed period showed, the TFP of the RA increased by an average of 1․2 percent- age. The change in the TFP of the country was mainly because of the change in factor efficiency, which was largely motivated by a change in net efficiency change. Main barriers of the competitiveness shift of Armenia are TECH and SECH: change in scale efficiency is al- most zero, averaging only 0․2 percentage. Expanding export opportunities and entering foreign markets will ensure improved efficiency from scale. Finally, the calculated components and compara- tive analysis of EAEU members and countries compa- rable with Armenia confirm that competitive advantage of the RA in the context of production efficiency is the production process efficiency. On the contrary, the main obstacle to the increasing its TFP is the low level of scale efficiency. That indicates Figure 6. where are introduced TFPCH and SECH of all the countries com- pared with Armenia in this paper, as well as the same changes in the world in average. Here we can find the RA to be the lowest after Moldova and Lebanon in the ranking by scale efficiency change. That is scale effi- ciency changes in Armenia are not only almost static, but also its level is less than the average in the world. On the other hand, only in Armenia and Lebanon the SECH is inferior to TFPCH. This fact threatens the TFP positive dynamics of Armenia, because at such an al- most constant pace of SECH theoretically once the country will exhaust its potential of improving pure ef- ficiency, and in that case, it can only increase its pro- duction efficiency only due to TECH, which is too ex- pensive to be always applied to improve TFP. The nature of scale efficiency can describe how expedient the expansion of production will be, from the point of view of efficiency. That indicator therefore is one of the most important indicators figuring the com- petitiveness of the country. References 1. Centre for Efficiency and Productivity Analy- sis (CEPA). (1996). DEAP Version 2.1 [Computer soft- ware]. Retrieved from https://econom- ics.uq.edu.au/cepa/software 2. Caves, D. W., Christensen, L. R., Diewert, E. W. (1982). The economic theory of index numbers and the measurement of input, output, and productivity. Econometrica, 50(6), 1393-1414. https://doi.org/10.2307/1913388 3. Comin, D․ (2006). Total Factor Productivity. New York University and NBER, 1. https://www.re- searchgate.net/publication/228665597 4. Dai, F., & Liu G. (2009). R&D efficiency and productivity growth: A Malmquist index analysis of High-Tech industries in China. International Confer- ence on Management Science and Engineering, 1866- 1872. https://doi.org/10.1109/icmse.2009.5317726 5. Hawdon, D. (2003). Efficiency, performance and regulation of the international gas industry - a boot- strap DEA approach. Energy Policy, 31(11), 1167- 1178. https://doi.org/10.1016/s0301-4215(02)00218-5 6. International Labour Organization. (2021). ILOSTAT database [database]. Available from https://ilostat.ilo.org/data/ 7. Karmann, A., & Roesel, F. (2016). Hospital policy and productivity, Evidence from German states. CEPIE Working Paper, 07(16), 6. https://doi.org/10.1002/hec.3447 8. Li, Y. (2009). A firm-level panel-data ap- proach to efficiency, total factor productivity, catchup and innovation and mobile telecommunications reform (1995-2007). CCP Working Paper, 09(6), 14. http://competitionpolicy.ac.uk/docu- ments/107435/107587/1.114399!ccp09-6.pdf 9. Li, Y., & Liu, Ch. (2010). Malmquist indices of total factor productivity changes in the Australian construction industry. Construction Management and 0,95 0,96 0,97 0,98 0,99 1 1,01 1,02 Ukraine Russia Iran Kazakhstan Belarus World Kyrgyzstan Armenia Moldova Lebanon Total factor productivity change Scale efficiency change
  • 10. Sciences of Europe # 82, (2021) 10 Economics, 8(9), 937. https://doi.org/10.1080/01446191003762231 10. Lu, W. CH., & Liu, T. K․ (2010). Malmquist indices of R&D productivity growth in taiwanese ic- design industry. Global journal of business research, 4(1). https://ssrn.com/abstract=1633104 11. Melecky, L., & Stanickova M. (2012). Na- tional Efficiency Evaluation of Visegrad Countries in Comparison with Austria and Germany by Selected DEA Models. International Conference on Mathemati- cal Methods in Economics, 575-580. http://doi.org/10.7441/joc.2012.03.05 12. Park, S. (2014). Evaluating the efficiency and productivity change within government subsidy recipi- ents of a national technology innovation research and development program. R&D Management, 45(5), 549- 568. https://doi.org/10.1111/radm.12097 13. Peneder, M. (2017). Competitiveness and in- dustrial policy: from rationalities of failure towards the ability to evolve. Cambridge Journal of Economics, 41, 829-858. https://doi.org/10.1093/cje/bew025 14. Sharma, S., and Thomas V. (2008). Inter- country R&D efficiency analysis: An application of data envelopment analysis. Scientometrics, 76(3), 483- 501. https://doi.org/10.1007/s11192-007-1896-4 15. World Bank, World Bank national accounts data, and OECD National Accounts data files. (2020a). GDP (constant 2010 US$) [Data file]. Retrieved from https://data.worldbank.org/indica- tor/NY.GDP.MKTP.KD 16. World Bank, World Bank national accounts data, and OECD National Accounts data files. (2020b). Gross fixed capital formation (constant 2010 US$) [Data file]. Retrieved from https://data.worldbank.org/indica- tor/NE.GDI.FTOT.KD МЕТОДИ ХЕДЖУВАННЯ ВАЛЮТНОГО РИЗИКУ БАНКАМИ Краснова І.В., д.е.н., професор, професор кафедри банківської справи та страхування КНЕУ ім. В.Гетьмана Шевалдіна В.Г. к.е.н., доцент, доцент кафедри банківської справи та страхування КНЕУ ім. В.Гетьмана METHODS OF HEDGING CURRENCY RISK BY BANKS Krasnova І., Doctor of Economics, Professor, Professor Department of Banking and Insurance Kyiv National Economic University named after Vadym Hetman Kyiv, Ukraine Shevaldina V. Ph. D. in Economics, Associate Professor of the Department of Banking and Insurance Kyiv National Economic University named after Vadym Hetman Kyiv, Ukraine DOI: 10.24412/3162-2364-2021-82-3-10-15 АНОТАЦІЯ Не зважаючи на велику кількість робіт присвячених питанням валютного ризику та методам його хе- джування, деякі питання залишаються не визначеними. Не має сталої класифікації методів та стратегій хеджування. У статті розглянуто концептуальні підходи до класифікації видів валютного ризику. Запро- поновано авторський підхід до структуризації методів хеджування валютного ризику та виокремлено ін- струменти хеджування валютного ризику банками клієнтів. Проаналізовано вітчизняну практику хеджу- вання валютного ризику та визначено можливості застосування форвардних контрактів в сучасних умовах. ABSTRACT Despite the large number of papers on currency risk and methods of it’s hedging, some issues remain unre- solved. There is no permanent classification of hedging methods and strategies. The article considers conceptual approaches to the classification of currency risk types. The author's approach to the structuring of currency risk hedging methods is proposed and the tools of currency risk hedging by clients' banks are singled out. The domestic practice of currency risk hedging is analyzed and the possibilities of using forward contracts in modern conditions are determined. Ключові слова: валютний ризик, банк, хеджування, класифікація, метод, деривативи, форвард. Keywords: currency risk, bank, hedging, classification, method, derivatives, forward. Актуальність. Валютний ризик є частиною ландшафту ризиків банківської установи. Він пов'- язаний з глобалізацією та інтеграцією, інтернаціо- налізацією ринку банківських послуг, створенням транснаціональних компаній та банківських уста- нов, диверсифікацією їх діяльності, і представляє ситуацію, яка допускає потенційні грошові втрати
  • 11. Sciences of Europe # 82, (2021) 11 в результаті коливань валютних курсів. За економі- чним змістом цей ризик є ризиком невизначеності майбутніх грошових потоків банку унаслідок змін курсів валют. При цьому зміна валютного курсу ві- дбувається через: 1) зміну внутрішніх витрат ва- люти; 2) посилення транснаціональної мобільності грошових потоків; 3) спекуляції на міжбанківсь- кому ринку. Тим самим, валютний ризик – це наяв- ний чи потенційний ризик який виникає через не- визначеність майбутніх грошових потоків в наслі- док несприятливих коливань курсів валют і цін на банківські метали, що відбиваються на скорочені (іноді зростанні) надходжень і капіталу. Чутливість банку до валютного ризику вимі- рюється відкритою валютною позицією за окре- мими валютами та банківськими металами, динамі- кою валютних курсів, а також кваліфікацією і коре- ктністю дилерів (трейдерів). Цей ризик притаманний всім фінансовим операціям банку в іноземній валюті і фактично є валютно-курсовим ризиком. Ця діяльність включає біржову торгівлю, управління портфелем позик в іноземній валюті, ва- лютні депозитні рахунки, залишки в іноземній ва- люті (зобов'язання або активи), платежі з рахунків та інші витрати в іноземній валюті. Валютний ри- зик є дуже складним (виділяють багато критерії його класифікації), за характером виникнення ва- лютний ризик поділяється на трансакційний (опе- раційний), трансляційний (бухгалтерський) та еко- номічний (рис.1). Транзакційний ризик, або експозиція до опе- рацій є результатом зміни значень операційних на- дходжень та відтоку готівки у період між момен- том, коли укладається операція, і коли здійсню- ються платежі з переказу валюти за операцією. Трансляційний ризик, або експозиція, пов’язана з переказами, або бухгалтерська, виникає, коли є не- обхідність конвертувати валюти. Економічний вплив виникає, коли коливання валют змінюють майбутні доходи компанії та витрати і тим самим впливає на капітал банку. Коли валютний курс змі- нюється, це може мати значення для цінової конку- рентоспроможності [1]. Рис. 1. Форми валютно-курсового ризику банку Джерело: складено авторами Щодо економічної форми валютного ризику, то серед науковців не існує єдиного погляду щодо її розуміння. Окремі автори пропонують виділяти стратегічний валютний ризик. На наш погляд, до економічного валютного ризику відносяться усі види валютного ризику, які пов’язані з коливанням валютних курсів та їх впливом саме на реальні гро- шові потоки, а, відповідно, й на економічну вар- тість банку. Трасляційний ризик, навпаки, пов'яза- ний зі змінами у балансовій вартості. З точки зору А.К. Солодова, якщо менеджмент банку не визнає трансляційний ризик суттєвим, не- має необхідності його хеджувати. Автор зазначає, що відображення в балансовому звіті змін активів і пасивів при їх оцінці в базовій валюті є всього лише бухгалтерською процедурою, яка не має істотного значення. Той факт, що вартість активів в іноземній валюті, коливається разом з рухом обмінного курсу національної валюти до іноземної, може ніяк не вплинути на основну діяльність або прибутковість портфелем деномінованим в іноземній, витрати на хеджування трансляційного ризику можуть вважа- тися недоцільними, так як фактично не існує ризику втрат від коливань курсу. Визнаємо таку точку зору доцільною за умови, якщо зміна курсу розгляда- ються як відхилення від відносно стабільного курсу
  • 12. Sciences of Europe # 82, (2021) 12 [2, 208-209]. З нашої точки зору, при існуванні пев- ної тенденції зміни курсу, сама ця тенденція вважа- ється суттєвим фактором впливу, хоча відхилення від курсу в ту або іншу сторону можуть бути несут- тєвими. Укладаючи зовнішньоекономічні угоди з від- строчкою платежів провідні компанії різних країн неодмінно використовують хеджування, щоб убез- печити себе від небажаного руху валютного курсу у майбутньому. Статистика свідчить, що обсяг угод спот (тобто з розрахунками день в день) на світо- вому валютному ринку значно поступається обсягу угод з використанням інструментів хеджування. Ґрунтуючись на аналізі світової теорії й практиці виділяємо наступні методи, які банк може застосо- вувати для хеджування валютного ризику: 1) методи зовнішнього хеджування – операції з валютними деривативами, у т.ч.: валютні операції “форвард”, операції “своп”, опціонні угоди, валю- тні ф’ючерсні контракти; 2) методи внутрішнього хеджування: структу- рне збалансування активів (matching), пасивів, кре- диторської та дебіторської заборгованості; страте- гія випереджень та запізнювань (leads&lags), кре- дитування та інвестування в іноземній валюті, паралельні позички (cash pooling), структурування зустрічних валютних потоків (netting), валютні “по- душки”; 3) контрактні методи: валютні застереження, вбудовані похідні інструменти, угода про поділ ри- зиків; 4) інші: створення реінвойсингових центрів; дисконтування вимог в іноземній валюті (фор- фейтинг); самострахування тощо. Суть хеджування валютного ризику полягає у використанні інструментів строкових і спот-угод з іноземною валютою, а також похідних фінансових інструментів, базисним активом за якими виступає валюта, позиції за якими протилежні відкритими валютними позиціями банку. Рис 2. Методи хеджування валютного ризику Джерело: складено авторами Всі ці інструменти банки можуть застосову- вати як для хеджування валютного ризику клієнтів, так і ризику банку. Банки найчастіше хеджують трансакційний ризик клієнта та ризик позикового капіталу. Співпраця з багатьма зарубіжними парт- нерами обумовлює значний вплив ризику коливань обмінних курсів валют на діяльність підприємств- експортерів. Крім того внаслідок значного часового лагу між моментом підписання зовнішньоекономі- чного контракту і моментом отримання чи перера- хування коштів за ним в компанії виникає транзак- ційний валютний ризик. Такий ризик є короткотри- валим. Валютний ризик позикового капіталу виникає в компанії в період повернення позикових коштів. Такий ризик є середньотривалим. Для хеджування транзакційного ризику клієн- тів банки можуть пропонувати наступні інструме- нти: 1) валютні форвардні / ф'ючерсні контракти. Дозволяє зафіксувати обмінний валютний курс до моменту надходження виручки або оплати заборго- ваності в іноземній валюті в майбутньому. Це зобо- в'язання купити / продати валюту за встановленим курсом на майбутню дату. Є ймовірність упущеної вигоди при сприятливій зміні цін на об'єкт хеджу- вання. Якщо ринок СПОТ рухається в несприят- ливу сторону (для імпортера девальвація, для екс- портера - зміцнення гривні) то форвардний договір (з поставкою) може бути пролонгований чи достро- Зовнішнє хеджування (використання похідних інструментів) Дозволяють здійснювати розрахунки в певний період часу у майбутньому, що сприяє перерозподілу грошових потоків Передбачають існування спеціального ринку (організований ринок та ринок OTC) Внутрішнє хеджування (угоди на готівковому ринку) Виключають ризик зміни ціни в майбутньому за рахунок завчасного характеру операції Викликають значні матеріальні витрати через необхідність розрахунків за всією сумою угоди в один момент. Не потребують спеціального ринку Контрактне хеджування (додаткові умови, які вносяться в контракт) Є результатом домовленостей контрагентів Є гнучкими до індивідуальних потреб клієнтів Не потребують спеціального ринку
  • 13. Sciences of Europe # 82, (2021) 13 ково припинений. В цьому випадку компанія- імпо- ртер може ухвалити рішення скерувати гривню (експортер –– валюту) до ринку СПОТ та пролон- гувати форвардний контракт; 2) валютні опціонні контракти. Дозволяє ком- панії отримати право (але не зобов'язання) купити або продати валюту на майбутню дату за фіксова- ною на поточний момент ціною, яка інша сторона зобов'язується задовольнити за премію. У цьому випадку компанія зберігає за собою право не вико- ристовувати опціон і отримати вигоду від сприят- ливого руху валютного курсу. 3) валютний своп / свопціон. Дозволяє компа- нії зафіксувати (у разі свопу) умови обміну в май- бутньому платежами в різних валютах з іншою сто- роною або отримати право провести такий обмін при несприятливому вибачення валютних курсів (в разі свопціони). 4) валютно-процентний своп. Цей інструмент може бути актуальним, якщо у компанії, напри- клад, є валютні зобов'язання з фіксованою або пла- ваючою процентною ставкою. Тоді вона може всту- пити в угоду з іншою стороною, згідно з яким в уз- годжені терміни вона буде здійснювати платежі в одній валюті (з встановленої% ставкою) і отриму- вати процентні платежі у валюті, в якій вона має зо- бов'язання (кредит). За даними НБУ в Україні клієнти активно ви- користовують угоди форвард для купівлі іноземної валюти з різними строками, переважають коротко- строкові угоди (від 1 до 3 місяців) до надкоротко- строкових (до 1 тижня) (рис.3). В умовах сильної чутливості вітчизняної еко- номіки до зовнішніх факторів впливу, валютний ри- зик залишається значним у структурі ринкових ри- зиків банків та клієнтів. Активне використання ін- струментів хеджування в Україні звужується за рахунок: 1) відсутності розвинутої інфраструктури ринку; 2) нездатності регулятивних механізмів ри- нку капіталів забезпечити механізм захисту учасни- ків відносин хеджування; 3) недостатньої кількісті учасників ринкового середовища для забезпечення ефективного механізму перерозподілу ризиків за його допомогою; 4) обмеженої кількісті інструмен- тів, що пропонується ринком, нездатної комплек- сно забезпечити потреби хеджерів. Рис 3. Інструменти хеджування валютного ризику Джерело: складено авторами на основі [3] Сьогодні можливості строкового ринку Укра- їни не здатні в повній мірі задовольнити потреби у хеджуванні власного економічного валютного ри- зику. В умовах низьких процентних ставок, над- лишку ліквідності, забезпечуючи власні потреби у хеджуванні валютного ризику, банки орієнтуються на внутрішнє хеджування, а саме технології спотового ринку, неттінг, перехресне хеджування. Вітчизняний строковий ринок є недостатньо розвиненим (частка складає 0,22 трлн. грн. від об’єму фондового ринку України). При цьому деякі біржі все ж пропонують клієнтам строкові контра- кти. Саме валютні ф’ючерси найбільш розповсю- дженими інструментами вітчизняного біржового ринку. Зокрема такі контракти пропонує Україн- ська Біржа, а саме трьох місячні та піврічні ф’ючерси на валютні пари гривня-долар США [4]. Українська міжбанківська валютна біржа пропонує більш широкий набір безпоставочних ф’ючерсів на валютні пари гривня-долар; гривня-євро; гривня-
  • 14. Sciences of Europe # 82, (2021) 14 російський рубль [5]. Крім того, біржа «Перспек- тива» може запропонувати шестимісячні ф’ючерси на валютні пари гривня-долар та гривня-євро [6]. Активними учасниками біржового строкового ринку є банки. (табл.1.) Таблиця 1 Банки учасники строкового ринку бірж УМВБ та УБ Тікер Назва учасника Доступ до торгів строковий ринок Дата отримання статусу члена фо- ндової біржі ALFAU АТ "АЛЬФА-БАНК" учасник торгів на строковому ринку УБ 07.06.2017 AVGDB АТ "БАНК АВАНГАРД" учасник торгів на строковому ринку УБ 20.01.2017 BOTPU АТ "ОТП БАНК" учасник торгів на строковому ринку УБ 06.01.2021 BVOST ПАТ "БАНК ВОСТОК" учасник торгів на строковому ринку УБ 18.03.2013 GLOBS АТ "КБ "ГЛОБУС" учасник торгів на строковому ринку УБ 10.03.2017 SKYBA АТ "СКАЙ БАНК" учасник торгів на строковому ринку УБ 06.08.2020 BOTPU АТ "ОТП БАНК" учасник торгів на строковому ринку УМВБ 08.10.2012 Джерело: складено автором на основі [4, 5] Крім того, підлаштовуючись під потреби кліє- нтів банк може застосовувати засоби позабіржо- вого ринку (OTC). За результатами аналізу біржо- вого строкового ринку, з’ясовано, що пропоновані біржами ф’ючерси є безпоставочними. Натомість, в залежності від цілей клієнта, банком може бути за- пропонований, як поставочний, так і безпоставоч- ний форвард (табл.2). Таблиця 2 Типи валютних деривативів Поставочний валютний фор- вард / ф’ючерс в рамках такого договору одна сторона зобов’язана в майбутньому в визначений строк надати базовий актив за форвардним курсом іншій стороні, котра зобов’язується сплатити та отримати такий актив. Безпоставочний валютний фо- рвард/ ф’ючерс NDF (nondeliverable forward). в рамках такого деривативу розрахунки між сторонами відбуваються на основі різниці між форвардним курсом та курсом (СПОТ) на мо- мент закриття контракту. Джерело: складено автором Втім, для цілей хеджування валютного ризику клієнтів банку доцільно використовувати NDF. Ос- новними характеристиками такого контракту є: 1) прогнозний курс - розрахунки та очікування аналі- тиків, дослідників, експертів щодо курсу в майбут- ньому; 2) форвардний курс - курс майбутньої угоди, розрахований на базі поточної різниці ставок по ва- лютам. Він розраховується: Форвардний курс (річний) = курс(СПОТ) ∗ ( 1+% грн 1+% валюта ) (1.1) Побудуємо дві схеми валютних форвардів: фо- рварду на покупку валюти та форварду на продаж. Для цілей хеджування використана валютна пара гривня/долар (табл.3, табл. 4). Аналогічна схема може бути застосована для будь-якої валютної пари за наявності бажання здійснити операцію як зі сто- рони покупця валютного контракту, так і зі сторони продавця. Таблиця 3 Валютний форвард на купівлю валюти Вхідні дані: Розрахунок: Курс СПОТ 25 грн/дол Ринкова ціна грн –14%річних Ринкова ціна дол–4%річних Банк не бере на себе валютний ризик і позичає грн на ринку по 14% На ці гривні він зараз купує валюту (по 25) і розміщує на депозит під 4% Фактично банк несе витрати у розмірі: 4%-14%= -10% на рік, а за 6 місяців це буде -5% 4.Банк закладає ці витрати в ціну для клієнта:25+5%=26,25 грн/дол Але 26,25 це собівартість. Додамо послуги банку –нехай це буде 20 коп, отже ціна купівлі валюти клієнтом –26,45 грн/дол Джерело: складено автором на основі [3] Таблиця 4 Валютний форвард на продаж валюти Вхідні дані: Розрахунок: Курс СПОТ 25 грн/дол Ринкова ціна грн – 14%річних Ринкова ціна дол– 4%річних Банк не бере на себе валютний ризик і позичає валюту на ринку під 4% Цю валюту він зараз продає (по 25) і розміщує гривні на депозит під 14% Фактично банк отримує прибуток у розмірі: 14%-4%=10% на рік, а за 6 місяців це буде 5% Банк додає цей прибуток до ціни для клієнта:25+5%=26,25 грн/дол Але 26,25 це собівартість. Треба врахувати інтерес банку –але оскільки він ку- пує, то він віднімає 20 коп, отже ціна продажу валюти клієнтом –26,05 грн/дол Джерело: складено автором на основі [3]
  • 15. Sciences of Europe # 82, (2021) 15 Укладання форвардних угод з фізичними осо- бами стало можливим завдяки подальшій лібералі- зації валютного ринку та ухваленню постанови НБУ №3 від 15 січня 2021 р. [7], яка дозволяє фізи- чним особам дозволено здійснювати форвардні операції за гривні. Національним Банком [7, 8] пе- редбачено, що банкам дозволяється здійснювати операції з продажу клієнтам іноземної валюти за гривні на умовах «форвард» (з поставкою іноземної валюти або без її поставки) для операцій з клієн- тами (юридичними особами та фізичними особами- підприємцями) для хеджування клієнтами ризику зміни курсу іноземної валюти за операціями: з екс- порту та імпорту товару (продукції, робіт, послуг, прав інтелектуальної власності та інших немайно- вих прав, призначених для продажу/оплатної пере- дачі). У квітні 2021р. АТ "АЛЬФА-БАНК" запропо- нував відповідний фінансовий продукт, та заявив про першу угоду форвард з фізичною особою з ме- тою хеджування валютних ризиків. Висновки. Встановлено, що в умовах сильної чутливості вітчизняної економіки до зовнішніх фа- кторів впливу, валютний ризик залишається знач- ним у структурі ринкових ризиків банків та клієн- тів. Можливості строкового ринку України не зда- тні в повній мірі задовольнити потреби у хеджуванні власного економічного валютного ри- зику. В умовах низьких процентних ставок, над- лишку ліквідності, забезпечуючи власні потреби у хеджуванні валютного ризику, банки орієнтуються на внутрішнє хеджування, а саме технології спотового ринку, неттінг, перехресне хеджування. Запропоновано для хеджування валютного ри- зику використовувати такі інструменти: 1) валютні форвардні/ф'ючерсні контракти, що дозволяють за- фіксувати валютний курс до моменту надходження виручки або оплати заборгованості в іноземній ва- люті в майбутньому періоді; 2) розрахунковий фо- рвард, або NDF при експортно-імпортних розраху- нках та валютних кредитах для динамічного хеджу- вання; 3) валютні опціони, що надають компанії отримати право купити або продати валюту на ви- значену дату в майбутньому по зафіксованій ціні; 4) валютні свопи/свопціони, як інструменти стати- чного хеджування, що дозволяє перерозподілити валютну позицію в часі та передбачає обмін валю- тою клієнтів з банком. Визначено доцільність хе- джування валютного ризику здійснювати за допо- могою короткострокових валютних деривативів (до 1 року). Література 1. Shapiro, A., 2010, Multinational Financial Management 9th edition, Hoboken, John Wiley & Sons Pte Ltd. 2. Солодов А.К. Основы финансового риск-ме- неджмента: учебник и учебное пособие: Издание Александра К. Солодова, MasterPrint. 2017. 286 с. 3. Офіційний сайт Національного Банку Укра- їни.URL: https://bank.gov.ua/ (дата звернення 10.03.2021 р.). 4. Офіційний сайт Української біржі. URL: http://www.ux.ua/ua/contracts.aspx (дата звернення: 30.03.2021). 5. Офіційний ПрАТ «Українська міжбанків- ська валютна біржа». URL: https://infodisclosure.uice.com.ua/StockListFI.aspx (дата звернення: 30.03.2021). 6. Офіційний сайт «Перспектива» . URL: http://fbp.com.ua/AnnualReports.aspx (дата звер- нення: 30.03.2021). 7. Про внесення змін до деяких нормативно- правових актів Національного банку України. По- станова Правління Національного Банку України від 15.01.2021 № 3. URL: https://zakon.rada.gov.ua/laws/show/v0003500- 21#Text (дата звернення: 19.02.2021). 8. Про затвердження Положення про здійснення операцій із валютними цінностями. По- станова Правління Національного Банку України від 02.01.2019 № 2. URL: https://zakon.rada.gov.ua/laws/show/v0002500- 19#n76. (дата звернення: 19.02.2021).
  • 16. Sciences of Europe # 82, (2021) 16 PEDAGOGICAL SCIENCES ADVANTAGES AND DISADVANTAGES OF DISTANCE LEARNING Kismetova G., Candidate of Pedagogic Sciences, Associate Professor WKITU Republic of Kazakhstan. Uralsk Abdrasilova N. Master student of WKITU DOI: 10.24412/3162-2364-2021-82-3-16-20 ABSTRACT Distance learning is seen as an alternative form of education in a difficult epidemiological situation, which has led to the separation of teachers and students. The distance education system has become extremely popular due to its convenience and flexibility. The article presents the main forms of distance learning in secondary school, highlights the most popular and well-organized platforms for their implementation, shows the advantages and disadvantages of distance learning, highlights the problems on which are worth paying attention to when switching to distance education. Keywords: distance learning, forms of distance learning, web classes, chat classes, teleconferences. Theoretical framework In 2019 - 2020 the world was struck by another epidemic of coronavirus infection, which led to various transformations in all spheres of life. The consequences of these changes have naturally affected education as well. The introduction of quarantine measures led to an emergency transition of the entire educational process to distance learning. In this situation, teachers had to develop both professionally and personally in order to take new responsibilities, fulfill new roles to meet the learning and development needs of their students and society as a whole, since the teacher is the initiator and conductor of development and transformation in soci- ety. Essentially, distance education is learning that takes place in a situation where the teacher and student are separated by distance or time, or both. For the im- plementation of distance education today, a variety of technologies are used: video recordings, broadcast tel- evision, interactive video, audio recordings and audio conferencing, web courses (online). The development and spread of the Internet and computer technology have revolutionized the concepts of learning and pro- fessional training. Already today, “virtual high schools” are becoming a reality, in which the entire school has access to online courses. But despite its pop- ularity, online education has not been without prob- lems. Distance education is not the same as face-to-face learning. Administering distance learning programs re- quires different experiences, and for learners, face-to- face learning is very different from learning on the In- ternet. Due to the growing demand for distance educa- tion and the unique experience it creates, especially in a pandemic, it is important for secondary schools to know the advantages, disadvantages and challenges of such online education. In the traditional teaching for- mat, the teacher develops lessons and transfers their content to students who study in a full-time environ- ment . Since during a certain for a period of time, stu- dents are often offered activities that require them to be active, rather than passive listening or observation [1]; This educational approach contributes to the develop- ment productive interaction between all class members. However, the face-to-face approach has several disad- vantages, namely: 1) it requires that the students and the teacher to be physically in the same classroom; 2) information may be inconsistent; 3) lack of flexibility; and, of course, the main problem is the different level of student learning in the classroom. Since each student comes to the office with differ- ent goals, expectations, experiences and abilities within a certain topic, the usual universal course does not give effective results in this situation. It was the shortcom- ings of this approach that opened up opportunities for alternative learning paths in the form of web courses or online education [1]. Distance education is a set of dis- tance technologies used in within recognized forms of education (full-time, part-time, part-time). The purpose of creating distance learning is to reduce the teaching load on the teacher, improve the quality of education. The distance education system has become an ex- tremely popular form of education due to its conven- ience and flexibility. It removes the main obstacle - eliminates the need to attendclasses according to the es- tablished schedule, preventing contact of people in dif- ficult epidemiological situations [2]. The distance learning process is based mainly on the independent cognitive activity of students [3], but this does not ne- gate the importance of personal communication be- tween children and the teacher. It is necessary to use such forms of teaching that will motivate students to study and at the same time compensate for the lack or even lack of direct communication between the teacher and the student. To date, the following forms of dis- tance learning are being implemented for secondary schools. Chat sessions that involve student-teacher communication through online conversations. They can be represented by text or audio messages, as a rule, messengers What App, Telegram are used for this in view of their ease of use, cheapness and prevalence, or video chats, for which the Skype or other platforms are used. Web-based classes, which are also implemented via the Internet, but already in the form of webinars,
  • 17. Sciences of Europe # 82, (2021) 17 distance lectures, and even ready-made online lessons. A huge advantage of this form of education is that stu- dents receive as specific material for study, and the op- portunity to test your knowledge after passing it. At the same time, parents and teachers can directly track the progress of learning. Teleconferencing is a type of con- ference in which communication is carried out at a dis- tance fromhelp with special technical and computer fa- cilities. A teleconference involves the communication of a large number of participants, united by a common topic or questions of interest at a distance. At the same time, during the teleconference, all its participants can exchange views, ask each other questions. The telecon- ference allows you to post relevant and interesting mes- sages on the network, which can be read, having previ- ously selected the topic of interest. Further, it is possi- ble to ask a question to the author of the message or send your own opinion. Thus, a network discussion is organized [4]. For the full implementation of the school curriculum, it is necessary to combine all forms of ed- ucation in order to compensate for the shortcomings of each. Thus, in the event of a complete forced transition to distance learning due to the epidemiological situa- tion, students will be able to receive education without having to attend school. Modern technologies make visual information more colorful and dynamic, which makes it easier and more effective to perceive the ma- terial. Lack of established frames on conducting a les- son will allow each student to master the program at their own pace, paying more attention to more difficult questions for him, to regulate the intensity of the lesson themselves. But at the same time, to date, a full transi- tion to online learning on an ongoing basis for children of the school period is impossible, because requires special responsibility and motivation from children and parents. Group learning in a face-to-face environment creates an atmosphere of competition and support, which encourages children to learn, in addition, many students require a "guardian" who will oversee their learning process. In the context of distance learning, this role will shift to parents, who, as a rule, are not ready for it, not to mention the fact that most of them work. Also, not every family has sufficient material and technical support. “The basis of the educational process in distance learning is the purposeful and controlled in- tensive independent work of the student, who can study at a convenient place for himself, according to an indi- vidual schedule, having with him a set of special teach- ing aids and an agreed opportunity to contact the teacher by phone, e-mail and regular mail, as well as in person” [3]. There are other interpretations of the con- cepts of distance learning and education, reflecting the variety of approaches to their understanding. Thus, distance learning is understood as a set of technologies that ensure the delivery of the bulk of the studied material to the learners, the interactive interac- tion of learners and teachers in the learning process, providing learners with the opportunity to inde- pendently work on mastering the material being stud- ied, as well as in the learning process [4]. Distance learning is a type of education based on educational in- teraction between teachers and students who are distant from each other, implemented using telecommunica- tion technologies and Internet resources. Distance learning is the interaction of a teacher and students with each other at a distance, reflecting all the components inherent in the educational process (goals, content, methods, organizational forms, teaching aids) and im- plemented by specific means of Internet technologies or other means providing interactivity [5]. The emer- gence of distance learning has led to the need for the development and implementation of distance learning technologies. “Distance learning technologies are un- derstood as educational technologies, implemented mainly with the use of information and telecommuni- cation technologies with mediated (at a distance) or not completely mediated interaction between a student and a teacher”[6]. Distance learning has the following ad- vantages: • flexibility – students generally do not attend reg- ular classes in the form of lectures, seminars. Everyone can study as much as he personally needs to master the course, discipline and obtain the necessary knowledge in the chosen specialty; • modularity – the basis of distance education pro- grams is a modular principle. Each individual discipline or row disciplines that are mastered by the student cre- ate a holistic view of a certain subject area. This makes it possible to form a training course from a set of inde- pendent training courses suitable for individual or group needs [7]; • parallelism - training can be carried out by com- bining the main professional activity with study, ie. "On the job"; • long-range action - the distance from the stu- dent's location to the educational institution (subject to high-quality communication) is not an obstacle to an effective educational process; • asynchrony - in the learning process, the teacher and the learner can implement the technology of teach- ing and learning independently in time, ie. according to a convenient schedule for everyone and at a convenient pace; • coverage - "mass character" - the number of stu- dents is not a critical parameter. They have access to many sources of educational information (electronic li- braries, databases), and can also communicate with each other and with the teacher through communication networks or using other means of information technol- ogy [8]; • profitability - economic efficiency of distance education; • a new role of a teacher (in the distance learning system - a tutor), when he is entrusted with such func- tions as coordinating the cognitive process, adjusting the taught course, consulting, managing educational projects, etc. Interaction with learners is carried out mainly asynchronously with using mail or communica- tion systems. Allowed and face-to-face contacts are also welcome; • a student, in order to undergo distance learning, must have exceptional self-organization, hard work and a certain starting level of education;
  • 18. Sciences of Europe # 82, (2021) 18 • new information technologies – in modern dis- tance learning, mainly computers, audio-video equip- ment, systems and means of telecommunications, etc. are used. Interactive interaction is widely used in dis- tance learning, which involves a dialogue of any sub- jects with each other using the means and methods available to them. At the same time, active participation in the dialogue of both parties is assumed - exchange of questions and answers, management of the course of the dialogue, control over the implementation of deci- sions made, etc. teachers and students act, and the meansof engag- ing in such interactions - email, newsgroups, real-time dialogues, etc. [9]. Among the disadvantages of dis- tance learning can be: • lack of direct face-to-face communication be- tween students and the teacher. When there is no person nearby who could emotionally color knowledge, this is a significant disadvantage for the learning process. It is difficult to create a creative atmosphere in a group of students; • the need for a personal computer and Internet ac- cess; the need for constant access to sources of infor- mation, for good technical equipment, but not everyone who wants to study has a computer and Internet access; need for technical readiness to use distance learning tools; • high requirements for setting the task for train- ing, administering the process, the complexity of moti- vating students; • the problem of user authentication when check- ing knowledge. It is impossible to tell who is on the other end of the line[10]; • the need for a whole range of individual psycho- logical conditions; • high cost of building a distance learning system at the initial stage of creating a system, significant costs for creating a distance learning system, distance learn- ing courses themselves and the purchase of hardware; • high labor intensity of the development of dis- tance learning courses - the creation of 1 hour of truly interactive multimedia interaction takes more than 1000 hours of professionals [11]. These days distance learning experiences has tem- porary difficulties such as: 1) insufficient computer literacy of teachers and trainees, lack of experience in distance learning; many teachers and students are not yet ready for this teaching method, preferring the classical education; 2) insufficient development of information and communication infrastructures in Kazakhstan; 3) training programs and courses are not well de- veloped due to the fact that there are not so many qual- ified specialists capable of creating such training aids; 4) poor use of standards in distance learning; 5) the problem of finding specialists. High qualifi- cation of developers is required; To create high-quality multimedia courses, you need a team of subject matter specialist, artist, programmer, etc.; 6) insufficient interactivity of modern distance learning courses; 7) low percentage of completion of courses due to insufficient experience in using distance learning sys- tems and the complexity of motivating students [12]. Therefore, due to these reasons there arise follow- ing disadvantages of distance learning: A big disadvantage of this system is eye strain, which is inevitable when working at a computer. This is especially harmful to the health of elementary school students, whose body is being formed. One of the main shortcomings can be considered the lack of direct (face to face) communication between students and the teacher, the loss of emotional contact, emotional sup- port, which in turn makes the educational process prob- lematic, complicates the application of an individual approach. The next disadvantage is the presence of a number of individual psychological conditions. Dis- tance learning requires strict self-discipline, and its re- sult directly depends on independence and the consci- entiousness of the student. In our opinion, only a small part of students have a sufficient level of self-discipline for successful learning in online format [13]. Based on observations of primary school students, it is concluded that primary school students lack awareness and inde- pendence for this training format. For constant access to information sources, you need good technical equip- ment: a computer and Internet access. As a rule, stu- dents feel a lack of practical training. Another signifi- cant disadvantage is the lack of constant control over students, which is a powerful tool for inclusion in the educational process. Without control, the child is con- stantly distracted by the influence of various external factors and does not focus on studies. In distance edu- cation, written assignments predominate, which nega- tively affects the development of the child's speech and in the future can lead to difficulties in oral presentation. Distance teachers, first of all, lacked "live" contact with students[14-15]. His absence was constraining: it was more difficult for them to track presence and involve- ment of students, it is more difficult to build discussions and discussion of problematic issues. The volume of pedagogical work has increased due to the preparation of online lessons, distribution of educational materials and homework checking. However, according to the teachers' judgment, distance learning is a technology that is applicable in schools. Over the past period, teachers have significantly improved their computer skills, with computer programs. Having considered the positive and negative aspects of distance learning, we can say that much in this process depends on the atti- tude of teachers, students and parents towards it. If stu- dents want to gain new knowledge and skills, and teachers and parents want to help them inachieving this, then distance learning in the current conditions will be- come an instrument of comfortable conscious learning and will not have a negative impact on the result. A year ago, no one could have imagined that for almost a whole year, pupils of schools in the Republic of Ka- zakhstan would study in a distance format. In any case, the current situation in the world has given us a lot of experience. And now we can be sure that, despite and under what circumstances, children will always be able to receive a quality education, even at home. Practical Experience
  • 19. Sciences of Europe # 82, (2021) 19 In my own practice of distance learning, when I had taught English Language school students up to 9th gradein the secondary schools. Despite the fact that I liked this format, I want to talk about the difficulties that I had to face in teaching school students English online, especially it was hard with juniors of primary school.I really love working with groups and am used to being surrounded by children who, with their spon- taneity and love of life, charge me with energy. Work- ing online, you to some extent deprive yourself of that magical atmosphere that reigns in the classroom: cozy gatherings in a circle, crafts, games, round dances, hugs. In addition, it is quite difficult to recognize the student's feelings and emotions on the other side of the screen and it is almost impossible to support them in difficult times. Moreover, in my practice I had a case that not all children are equally get used to online ac- tivities. Someone gets lost and embarrassed when meet- ing a new person through the screen, or gets nervous and worried if something went wrong. It is much more difficult for the teacher to keep the situation under con- trol from a distance. Referring to the technical part, during my online teaching experiencein connection with the difficult ep- idemiological situation, I have used“Zoom” and “Google Classroom”platforms, one of a number of plat- forms for distance learning, online meetings and con- ferences. We used it to conduct practical and lectures on the lexical and grammatical partand in practical les- sons when with students we have practiced speaking abilities entirely with all grades. Having some experi- ence with this platform, I would like to highlight the following positive aspects of its use: • ease of use; • intuitive and simple interface; • fast and easy connection to conferences. Anyone with a link or conference ID can join the video conference. An event can be scheduled in ad- vance, as well as a repeating link, that is, for a regular lesson at a specific time, you can make the same login link. The listeners were connected both from a station- ary computer, and from a phone or a tablet (but, accord- ing to them, it is more convenient to work from a com- puter). Zoom allows everyone to communicate in real time, because the platform provides excellent commu- nication.the possibility of video and audio communica- tion with each participant. At the same time, both the organizer and the participants have the ability to turn off and on the microphone and video. Convenience of demonstration of materials from the computer screen (screensharing). Screen sharing is very useful for show- ing a presentation during a lecture. During the practical lesson, the teacher can also open one or another file for demonstration the ability to record the lesson, both on a computer and on the cloud (this is important for those students who could not attend the lesson) chat where you can write messages, transfer filesthe presence of a breakout rooms function that allows students to be di- vided into pairs and groups to work together, as is usu- ally the case during offline classes." Moreover, such there are a lot of tools and availa- ble resources and digital tools in English as videos, online materials, for me, as an English-teacher, it was very convenient for me to conduct full-fledged distance classes, using the demonstration of video and audio ma- terial, presentations, text files, combining various forms of work: pair, individual, group. The lesson takes place in the mode of live communication, discussion of the topic, and the implementation of practical tasks. In addition I have used such electronic educational plat- forms YaKlass, MetaShkola, UchiRu, Sky Eng, British Council, FoxFord, to give a special advantage in the implementation of distance learning. And, beside of them I have applied Kahoot games, Quizzlets, Slides, other game and entertainment platforms with the aim of rising interest, and therefore the efficiency of studying In general, my general feelings of distance work as a teacher are positive. Of course, a big plus is that everyone is in their own comfort zone - therefore, the level of assimilation of information can be higher. In the conclusion, there can be next deductions: Distance teaching technology helps: 1. "Erase" territorial boundaries. 2. Provide a comfortable learning rhythm for every student. 3. Automate routine educational processes. 4. To make training more accessible (although there are controversial points: such training is available from different parts of the world, it is cheaper than classroom training, but distance learning necessarily re- quires certain technical means, its organization is im- possible "on the fingers"). 5. Distance learning cannot be organized in a hurry. If you think that just a smartphone and a ZOOM installed on it are enough for an organization, this is a mistake. A well-thought-out teaching methodology, verified educational content has not been canceled. An- other question is that if it is important to start distance learning urgently (already "today"), for example, in quarantine conditions, then specialized LCMS with ready-made modules in a particular subject can help out. True, alas, it is not possible to find suitable educa- tional products for all subjects, and you still have to carry out the difficult work of filling the "shell" with educational materials. 6. When organizing distance learning, the age of the students is very important. What is a minus for a schoolchild, for an adult is absolutely irrelevant, and vice versa [16]. Modern LCMS, video conferencing platforms can become the most useful tools for quarantine, but all this is only if the transition to remote control is made as strategically competent as possible, which means that the tasks are clearly defined and the needs and charac- teristics of the target audience are taken into account. In this situation, however, the distance learning format may not only organically fit into the outline of the future, but also become a priority in it. It is defi- nitely impossible to exclude this. After all, there are re- ally many advantages to the remote format. And the correction of the minuses is in our hands.
  • 20. Sciences of Europe # 82, (2021) 20 References 1. I.V. Abdrakhmanova, V.A. Balueva, I.V. Lushchik, Physical education and sports training, 4(30), 119-125 (2019) [Google Scholar] 2. A.V. Ageyevets, V.Yu. Efimov-Komarov, L.B. Efimova-Komarova, E.A. Nazarenko, M.V. Puchkova, Scientific notes of the University named af- ter P.F. Lesgaft, 4(182), 3-9 (2020) [Google Scholar] 3. A.S. Kuznetsov, Z.M. Kuznetsova, Russian Journal of Physical Education and Sport, 14(4), 5-7 (2019). DOI: 10.14526/20704798-2019-14-4-5-7 [Google Scholar] 4. G.N. Germanov, L.A. Novikova, M.Yu. Sekovanich, A.N. Korolkov, A.P. Strizhak, Scientific notes of the University named after P.F. Lesgaft, 10(176), 82-91 (2019) [Google Scholar] 5. Hygienic requirements for personal electronic computers and organization of work (SanPiN 2.2.2/2.4.1340-03) [Google Scholar] 6. O.U. Digtyar, World of science, culture, edu- cation, 5(78), 342-344 (2019) [Google Scholar] 7. V.U. Ziambetov, D.V. Brovikov, Academic journalism, 4, 455-459 (2020) [Google Scholar] 8. S. Kislitsyn, Professor: distance learning is a profanation of education (URL: https://rossapri- mavera.ru/article/3dabcedf) [Google Scholar] 9. S.V. Kochetova, International Journal of Hu- manities and Natural Sciences, 9-1, 32-34 (2019) [Google Scholar] 10. V.N. Kremneva, L.A. Nepovinnykh, E.M. So- lodovnik, Questions of pedagogy, 6-1, 184-188 (2020) [Google Scholar] 11. T.U. Krestyaninova, O.N. Malakh, Bulletin of Omsk State Pedagogical University. Humanities research, 1(22), 108-111 (2019) [Google Scholar] 12. O.V. Kuzhelnaya, A.M. Atayan, A.M. Smirnov, D.G. Petrova, Scientific notes of the Univer- sity named after Lesgaft P.F., 9(175), 151-153 (2019) [Google Scholar] 13. T.L. Kuzmenkova, Scientific notes of the Uni- versity named after Lesgaft P.F., 2(180), 191-195 (2020) [Google Scholar] 14. M.M. Milko, N.V. Guremina, Modern high- tech technologies, 5, 195-200 (2020) [Google Scholar] 15. A.A. Popova, I.A. Nazarov, Sustainable de- velopment of science and education, 4, 348-353 (2019) [Google Scholar] 16. N.V. Popova, Current scientific research in the modern world, 2-5(46), 144-148 (2019) [Google Scholar] ПРОФИЛАКТИКА ПОВРЕЖДЕНИЙ ПОЯСНИЧНО-КРЕСТЦОВОГО ОТДЕЛА ПОЗВОНОЧНОГО СТОЛБА ПОСРЕДСТВОМ ГИМНАСТИЧЕСКИХ УПРАЖНЕНИЙ В ПОДГОТОВИТЕЛЬНОЙ ЧАСТИ ЗАНЯТИЯ ДЛЯ ЗАНИМАЮЩИХСЯ СИЛОВЫМИ ВИДАМИ СПОРТА Баранхин О.В. Аспирант ORCID: 0000-0002-6329-0450 Тюменский Государственный Университет, Институт Физической Культуры, Тюмень, Россия LUMBAR-TRUNK INJURIES PREVENTION WITH GYMNASTICS EXERCISES IN WARM-UP TRAINING SESSION FOR POWER SPORTS Barankhin. O. PhD student Tyumen State University, Institute of physical education, Tyumen, Russia DOI: 10.24412/3162-2364-2021-82-3-20-27 АННОТАЦИЯ В статье рассмотрена проблема недостаточности стабильности и контроля пояснично-крестцового от- дела во время выполнения соревновательных движений в силовых видах спорта. Данная проблема высту- пает ведущей среди часто описываемых в приведенной литературе среди большинства видов спорта. ABSTRACT At this paper show the main problems with deficit control and stability of lumbar-trunk region during com- petitive movements in power sports. This issue is the leading one among those described in the literature for most sports. Goal of research: create a practical recommendation for lumbar-trunk injuries prevention with gymnastics exercises in warm-up training session for power athletes. Materials and methods: analyzed a broad online library sources (PubMed, Research Gate, Cochrane library, MedLine). To the analysis, was take researches with big groups of participants. Results: The literature survey on the issue raised found the usefulness of the warm-up part of the session as a way of avoiding injury, but at the same time the evidence base for the performance and effec- tiveness of gymnastic exercises as prevention of lumbar spine for power sports is insufficient. We have developed practical recommendations for both the warm-up part and the individual training session in an effort to increase