SlideShare a Scribd company logo
1 of 176
117
LEARNING OBJECTIVES
Nature of Data, Statistical
Modeling, and Visualization
■■ Understand the nature of data as they relate to
business intelligence (BI) and analytics
■■ Learn the methods used to make real-world data
analytics ready
■■ Describe statistical modeling and its relationship to
business analytics
■■ Learn about descriptive and inferential statistics
■■ Define business reporting and understand its
historical evolution
■■ Understand the importance of data/information
visualization
■■ Learn different types of visualization techniques
■■ Appreciate the value that visual analytics brings
to business analytics
■■ Know the capabilities and limitations of
dashboards
I n the age of Big Data and business analytics in which we are
living, the importance of data is undeniable. Newly coined
phrases such as “data are the oil,” “data are the new bacon,”
“data are the new currency,” and “data are the king” are further
stress-
ing the renewed importance of data. But the type of data we are
talking about is obvi-
ously not just any data. The “garbage in garbage out—GIGO”
concept/principle applies
to today’s Big Data phenomenon more so than any data
definition that we have had in
the past. To live up to their promise, value proposition, and
ability to turn into insight,
data have to be carefully created/identified, collected,
integrated, cleaned, transformed,
and properly contextualized for use in accurate and timely
decision making.
Data are the main theme of this chapter. Accordingly, the
chapter starts with a de-
scription of the nature of data: what they are, what different
types and forms they can
come in, and how they can be preprocessed and made ready for
analytics. The first few
sections of the chapter are dedicated to a deep yet necessary
understanding and process-
ing of data. The next few sections describe the statistical
methods used to prepare data
as input to produce both descriptive and inferential measures.
Following the statistics
sections are sections on reporting and visualization. A report is
a communication artifact
3
C H A P T E R
118 Part I • Introduction to Analytics and AI
prepared with the specific intention of converting data into
information and knowledge
and relaying that information in an easily
understandable/digestible format. Today, these
reports are visually oriented, often using colors and graphical
icons that collectively look
like a dashboard to enhance the information content. Therefore,
the latter part of the
chapter is dedicated to subsections that present the design,
implementation, and best
practices regarding information visualization, storytelling, and
information dashboards.
This chapter has the following sections:
3.1 Opening Vignette: SiriusXM Attracts and Engages a New
Generation of Radio
Consumers with Data-Driven Marketing 118
3.2 Nature of Data 121
3.3 Simple Taxonomy of Data 125
3.4 Art and Science of Data Preprocessing 129
3.5 Statistical Modeling for Business Analytics 139
3.6 Regression Modeling for Inferential Statistics 151
3.7 Business Reporting 163
3.8 Data Visualization 166
3.9 Different Types of Charts and Graphs 171
3.10 Emergence of Visual Analytics 176
3.11 Information Dashboards 182
3.1 OPENING VIGNETTE: SiriusXM Attracts and Engages
a New Generation of Radio Consumers with
Data-Driven Marketing
SiriusXM Radio is a satellite radio powerhouse, the largest
radio company in the world
with $3.8 billion in annual revenues and a wide range of hugely
popular music, sports,
news, talk, and entertainment stations. The company, which
began broadcasting in 2001
with 50,000 subscribers, had 18.8 million subscribers in 2009,
and today has nearly 29
million.
Much of SiriusXM’s growth to date is rooted in creative
arrangements with automo-
bile manufacturers; today, nearly 70 percent of new cars are
SiriusXM enabled. Yet the
company’s reach extends far beyond car radios in the United
States to a worldwide pres-
ence on the Internet, on smartphones, and through other services
and distribution chan-
nels, including SONOS, JetBlue, and Dish.
BUSINESS CHALLENGE
Despite these remarkable successes, changes in customer
demographics, technology, and
a competitive landscape over the past few years have posed a
new series of business
challenges and opportunities for SiriusXM. Here are some
notable ones:
• As its market penetration among new cars increased, the
demographics of its buy-
ers changed, skewing toward younger people with less
discretionary income. How
could SiriusXM reach this new demographic?
• As new cars become used cars and change hands, how could
SiriusXM identify,
engage, and convert second owners to paying customers?
• With its acquisition of the connected vehicle business from
Agero—the leading pro-
vider of telematics in the U.S. car market—SiriusXM gained the
ability to deliver its
service via satellite and wireless networks. How could it
successfully use this acqui-
sition to capture new revenue streams?
Chapter 3 • Nature of Data, Statistical Modeling, and
Visualization 119
PROPOSED SOLUTION: SHIFTING THE VISION TOWARD
DATA-DRIVEN MARKETING
SiriusXM recognized that to address these challenges, it would
need to become a high-
performance, data-driven marketing organization. The company
began making that shift
by establishing three fundamental tenets. First, personalized
interactions—not mass
marketing—would rule the day. The company quickly
understood that to conduct more
personalized marketing, it would have to draw on past history
and interactions as well as
on a keen understanding of the consumer’s place in the
subscription life cycle.
Second, to gain that understanding, information technology (IT)
and its external tech-
nology partners would need the ability to deliver integrated
data, advanced analytics,
integrated marketing platforms, and multichannel delivery
systems.
And third, the company could not achieve its business goals
without an integrated
and consistent point of view across the company. Most
important, the technology and
business sides of SiriusXM would have to become true partners
to best address the chal-
lenges involved in becoming a high-performance marketing
organization that draws on
data-driven insights to speak directly with consumers in
strikingly relevant ways.
Those data-driven insights, for example, would enable the
company to differentiate
between consumers, owners, drivers, listeners, and account
holders. The insights would help
SiriusXM to understand what other vehicles and services are
part of each household and cre-
ate new opportunities for engagement. In addition, by
constructing a coherent and reliable
360-degree view of all its consumers, SiriusXM could ensure
that all messaging in all cam-
paigns and interactions would be tailored, relevant, and
consistent across all channels. The
important bonus is that a more tailored and effective marketing
is typically more cost-efficient.
IMPLEMENTATION: CREATING AND FOLLOWING THE
PATH TO
HIGH-PERFORMANCE MARKETING
At the time of its decision to become a high-performance
marketing company, SiriusXM
was working with a third-party marketing platform that did not
have the capacity to
support SiriusXM’s ambitions. The company then made an
important, forward-thinking
decision to bring its marketing capabilities in-house—and then
carefully plotted what it
would need to do to make the transition successfully.
1. Improve data cleanliness through improved master data
management and governance.
Although the company was understandably impatient to put
ideas into action, data
hygiene was a necessary first step to create a reliable window
into consumer behavior.
2. Bring marketing analytics in-house and expand the data
warehouse to enable scale
and fully support integrated marketing analytics.
3. Develop new segmentation and scoring models to run in
databases, eliminating la-
tency and data duplication.
4. Extend the integrated data warehouse to include marketing
data and scoring, lever-
aging in-database analytics.
5. Adopt a marketing platform for campaign development.
6. Bring all of its capability together to deliver real-time offer
management across all
marketing channels: call center, mobile, Web, and in-app.
Completing those steps meant finding the right technology
partner. SiriusXM chose
Teradata because its strengths were a powerful match for the
project and company.
Teradata offered the ability to:
• Consolidate data sources with an integrated data warehouse
(IDW), advanced ana-
lytics, and powerful marketing applications.
• Solve data-latency issues.
120 Part I • Introduction to Analytics and AI
• Significantly reduce data movement across multiple databases
and applications.
• Seamlessly interact with applications and modules for all
marketing areas.
• Scale and perform at very high levels for running campaigns
and analytics in-database.
• Conduct real-time communications with customers.
• Provide operational support, either via the cloud or on
premise.
This partnership has enabled SiriusXM to move smoothly and
swiftly along its road
map, and the company is now in the midst of a transformational,
five-year process.
After establishing its strong data governance process, SiriusXM
began by implementing its
IDW, which allowed the company to quickly and reliably
operationalize insights through-
out the organization.
Next, the company implemented Customer Interaction
Manager—part of the Teradata
Integrated Marketing Cloud, which enables real-time, dialog-
based customer interaction
across the full spectrum of digital and traditional
communication channels. SiriusXM also
will incorporate the Teradata Digital Messaging Center.
Together, the suite of capabilities allows SiriusXM to handle
direct communications
across multiple channels. This evolution will enable real -time
offers, marketing messages,
and recommendations based on previous behavior.
In addition to streamlining the way it executes and optimizes
outbound marketing
activities, SiriusXM is also taking control of its internal
marketing operations with the
implementation of Marketing Resource Management, also part
of the Teradata Integrated
Marketing Cloud. The solution will allow SiriusXM to
streamline workflow, optimize mar-
keting resources, and drive efficiency through every penny of
its marketing budget.
RESULTS: REAPING THE BENEFITS
As SiriusXM continues its evolution into a high-performance
marketing organization, it already
is benefiting from its thoughtfully executed strategy.
Household-level consumer insights and
a complete view of marketing touch strategy with each
consumer enable SiriusXM to create
more targeted offers at the household, consumer, and device
levels. By bringing the data
and marketing analytics capabilities in-house, SiriusXM
achieved the following:
• Campaign results in near real time rather than four days,
resulting in massive reduc-
tions in cycle times for campaigns and the analysts who support
them.
• Closed-loop visibility, allowing the analysts to support
multistage dialogs and
in-campaign modifications to increase campaign effectiveness.
• Real-time modeling and scoring to increase marketing
intelligence and sharpen cam-
paign offers and responses at the speed of their business.
Finally, SiriusXM’s experience has reinforced the idea that
high-performance market-
ing is a constantly evolving concept. The company has
implemented both processes and
the technology that give it the capacity for continued and
flexible growth.
u QUESTIONS FOR THE OPENING VIGNETTE
1. What does SiriusXM do? In what type of market does it
conduct its business?
2. What were its challenges? Comment on both technology and
data-related
challenges.
3. What were the proposed solutions?
4. How did the company implement the proposed solutions? Did
it face any
implementation challenges?
5. What were the results and benefits? Were they worth the
effort/investment?
6. Can you think of other companies facing similar challenges
that can potentially
benefit from similar data-driven marketing solutions?
Chapter 3 • Nature of Data, Statistical Modeling, and
Visualization 121
WHAT WE CAN LEARN FROM THIS VIGNETTE
Striving to thrive in a fast-changing competitive industry,
SiriusXM realized the need
for a new and improved marketing infrastructure (one that relies
on data and analytics)
to effectively communicate its value proposition to its existing
and potential custom-
ers. As is the case in any industry, success or mere survival in
entertainment depends
on intelligently sensing the changing trends (likes and dislikes)
and putting together
the right messages and policies to win new customers while
retaining the existing
ones. The key is to create and manage successful marketing
campaigns that resonate
with the target population of customers and have a close
feedback loop to adjust and
modify the message to optimize the outcome. At the end, it was
all about the preci-
sion in the way that SiriusXM conducted business: being
proactive about the changing
nature of the clientele and creating and transmitting the right
products and services
in a timely manner using a fact-based/data-driven holistic
marketing strategy. Source
identification, source creation, access and collection,
integration, cleaning, transforma-
tion, storage, and processing of relevant data played a critical
role in SiriusXM’s suc-
cess in designing and implementing a marketing analytics
strategy as is the case in any
analytically savvy successful company today, regardless of the
industry in which they
are participating.
Sources: C. Quinn, “Data-Driven Marketing at SiriusXM,”
Teradata Articles & News, 2016. http://bigdata.
teradata.com/US/Articles-News/Data-Driven-Marketing-At-
SiriusXM/ (accessed August 2016); “SiriusXM
Attracts and Engages a New Generation of Radio Consumers.”
http://assets.teradata.com/resourceCenter/
downloads/CaseStudies/EB8597.pdf?processed=1.
3.2 NATURE OF DATA
Data are the main ingredient for any BI, data science, and
business analytics initiative.
In fact, they can be viewed as the raw material for what popular
decision technolo-
gies produce—information, insight, and knowledge. Without
data, none of these tech-
nologies could exist and be popularized—although traditionally
we have built analytics
models using expert knowledge and experience coupled with
very little or no data at all;
however, those were the old days, and now data are of the
essence. Once perceived as a
big challenge to collect, store, and manage, data today are
widely considered among the
most valuable assets of an organization with the potential to
create invaluable insight to
better understand customers, competitors, and the business
processes.
Data can be small or very large. They can be structured (nicely
organized for
computers to process), or they can be unstructured (e.g., text
that is created for humans
and hence not readily understandable/consumable by
computers). Data can come in
small batches continuously or can pour in all at once as a large
batch. These are some
of the characteristics that define the inherent nature of today’s
data, which we often
call Big Data. Even though these characteristics of data make
them more challenging to
process and consume, they also make the data more valuable
because the character-
istics enrich them beyond their conventional limits, allowing for
the discovery of new
and novel knowledge. Traditional ways to manually collect data
(via either surveys
or human-entered business transactions) mostly left their places
to modern-day data
collection mechanisms that use Internet and/or sensor/radio
frequency identification
(RFID)–based computerized networks. These automated data
collection systems are not
only enabling us to collect more volumes of data but also
enhancing the data quality
and integrity. Figure 3.1 illustrates a typical analytics
continuum—data to analytics to
actionable information.
http://bigdata.teradata.com/US/Articles-News/Data-Driven-
Marketing-At-SiriusXM
http://bigdata.teradata.com/US/Articles-News/Data-Driven-
Marketing-At-SiriusXM
http://assets.teradata.com/resourceCenter/downloads/CaseStudie
s/EB8597.pdf?processed=1
http://assets.teradata.com/resourceCenter/downloads/CaseStudie
s/EB8597.pdf?processed=1
122 Part I • Introduction to Analytics and AI
Although their value proposition is undeniable, to live up their
promise, data must
comply with some basic usability and quality metrics. Not all
data are useful for all tasks,
obviously. That is, data must match with (have the coverage of
the specifics for) the task
for which they are intended to be used. Even for a specific task,
the relevant data on
hand need to comply with the quality and quantity requirements.
Essentially, data have
to be analytics ready. So what does it mean to make data
analytics ready? In addition to
its relevancy to the problem at hand and the quality/quantity
requirements, it also has to
have a certain structure in place with key fields/variables with
properly normalized val-
ues. Furthermore, there must be an organization-wide agreed-on
definition for common
variables and subject matters (sometimes also called master data
management), such as
how to define a customer (what characteristics of customers are
used to produce a holis-
tic enough representation to analytics) and where in the
business process the customer-
related information is captured, validated, stored, and updated.
Sometimes the representation of the data depends on the type of
analytics being
employed. Predictive algorithms generally require a flat file
with a target variable, so mak-
ing data analytics ready for prediction means that data sets must
be transformed into
a flat-file format and made ready for ingestion into those
predictive algorithms. It is also
imperative to match the data to the needs and wants of a
specific predictive algorithm
and/or a software tool. For instance, neural network algorithms
require all input variables
UOB
1.0
X
UOB
2.2
UOB
2.1
UOB
3.0
ERP CRM SCM
Business Process
Facebook
Google+
Linked In
YouTube
Twitter
Tumblr
Flicker
Instagram
Pinterest
Snapchat
Reddit
Foursquare
Internet/Social Media
Machines/Internet of Things
Data
Storage Analytics
Data Protection
Cloud Storage and
Computing
Pa
tte
rn
s
Trends
Knowledge
Applications
End Users
Validate
Built
Test
X
FIGURE 3.1 A Data to Knowledge Continuum.
Chapter 3 • Nature of Data, Statistical Modeling, and
Visualization 123
to be numerically represented (even the nominal variables need
to be converted into
pseudo binary numeric variables), whereas decision tree
algorithms do not require such
numerical transformation—they can easily and natively handle a
mix of nominal and nu-
meric variables.
Analytics projects that overlook data-related tasks (some of the
most critical steps)
often end up with the wrong answer for the right problem, and
these unintentionally cre-
ated, seemingly good answers could lead to inaccurate and
untimely decisions. Following
are some of the characteristics (metrics) that define the
readiness level of data for an ana-
lytics study (Delen, 2015; Kock, McQueen, & Corner, 1997).
• Data source reliability. This term refers to the originality and
appropriateness of
the storage medium where the data are obtained—answering the
question of “Do
we have the right confidence and belief in this data source?” If
at all possible, one
should always look for the original source/creator of the data to
eliminate/mitigate
the possibilities of data misrepresentation and data
transformation caused by the
mishandling of the data as they moved from the source to
destination through one
or more steps and stops along the way. Every move of the data
creates a chance to
unintentionally drop or reformat data items, which limits the
integrity and perhaps
true accuracy of the data set.
• Data content accuracy. This means that data are correct and
are a good match
for the analytics problem—answering the question of “Do we
have the right data for
the job?” The data should represent what was intended or
defined by the original
source of the data. For example, the customer’s contact
information recorded within
a database should be the same as what the customer said it was.
Data accuracy will
be covered in more detail in the following subsection.
• Data accessibility. This term means that the data are easily
and readily obtainable—
answering the question of “Can we easily get to the data when
we need to?” Access to
data can be tricky, especially if they are stored in more than one
location and storage
medium and need to be merged/transformed while accessing and
obtaining them. As
the traditional relational database management systems leave
their place (or coexist
with a new generation of data storage mediums such as data
lakes and Hadoop infra-
structure), the importance/criticality of data accessibility is also
increasing.
• Data security and data privacy. Data security means that the
data are secured
to allow only those people who have the authority and the need
to access them and
to prevent anyone else from reaching them. Increasing
popularity in educational
degrees and certificate programs for Information Assurance is
evidence of the criti-
cality and the increasing urgency of this data quality metric.
Any organization that
maintains health records for individual patients must have
systems in place that not
only safeguard the data from unauthorized access (which is
mandated by federal
laws such as the Health Insurance Portability and
Accountability Act [HIPAA]) but
also accurately identify each patient to allow proper and timely
access to records by
authorized users (Annas, 2003).
• Data richness. This means that all required data elements are
included in the data
set. In essence, richness (or comprehensiveness) means that the
available variables
portray a rich enough dimensionality of the underlying subject
matter for an accurate
and worthy analytics study. It also means that the information
content is complete
(or near complete) to build a predictive and/or prescriptive
analytics model.
• Data consistency. This means that the data are accurately
collected and com-
bined/merged. Consistent data represent the dimensional
information (variables of
interest) coming from potentially disparate sources but
pertaining to the same sub-
ject. If the data integration/merging is not done properly, some
of the variables of
different subjects could appear in the same record—having two
different patient
124 Part I • Introduction to Analytics and AI
records mixed up; for instance, this could happen while merging
the demographic
and clinical test result data records.
• Data currency/data timeliness. This means that the data should
be up-to-date
(or as recent/new as they need to be) for a given analytics
model. It also means
that the data are recorded at or near the time of the event or
observation so that the
time delay–related misrepresentation (incorrectly remembering
and encoding) of
the data is prevented. Because accurate analytics relies on
accurate and timely data,
an essential characteristic of analytics-ready data is the
timeliness of the creation
and access to data elements.
• Data granularity. This requires that the variables and data
values be defined at
the lowest (or as low as required) level of detail for the
intended use of the data.
If the data are aggregated, they might not contain the level of
detail needed for
an analytics algorithm to learn how to discern different
records/cases from one
another. For example, in a medical setting, numerical values for
laboratory results
should be recorded to the appropriate decimal place as required
for the meaning-
ful interpretation of test results and proper use of those values
within an analytics
algorithm. Similarly, in the collection of demographic data, data
elements should be
defined at a granular level to determine the differences in
outcomes of care among
various subpopulations. One thing to remember is that the data
that are aggregated
cannot be disaggregated (without access to the original source),
but they can easily
be aggregated from its granular representation.
• Data validity. This is the term used to describe a
match/mismatch between the
actual and expected data values of a given variable. As part of
data definition,
the acceptable values or value ranges for each data element
must be defined. For
example, a valid data definition related to gender would include
three values: male,
female, and unknown.
• Data relevancy. This means that the variables in the data set
are all relevant to
the study being conducted. Relevancy is not a dichotomous
measure (whether a
variable is relevant or not); rather, it has a spectrum of
relevancy from least relevant
to most relevant. Based on the analytics algorithms being used,
one can choose to
include only the most relevant information (i.e., variables) or, if
the algorithm is
capable enough to sort them out, can choose to include all the
relevant ones regard-
less of their levels. One thing that analytics studies should
avoid is including totally
irrelevant data into the model building because this could
contaminate the informa-
tion for the algorithm, resulting in inaccurate and misleading
results.
The above-listed characteristics are perhaps the most prevailing
metrics to keep up
with; the true data quality and excellent analytics readiness for
a specific application do-
main would require different levels of emphasis to be placed on
these metric dimensions
and perhaps add more specific ones to this collection. The
following section will delve
into the nature of data from a taxonomical perspective to list
and define different data
types as they relate to different analytics projects.
u SECTION 3.2 REVIEW QUESTIONS
1. How do you describe the importance of data in analyti cs? Can
we think of analytics
without data?
2. Considering the new and broad definition of business
analytics, what are the main
inputs and outputs to the analytics continuum?
3. Where do the data for business analytics come from?
4. In your opinion, what are the top three data-related
challenges for better analytics?
5. What are the most common metrics that make for analytics-
ready data?
Chapter 3 • Nature of Data, Statistical Modeling, and
Visualization 125
3.3 SIMPLE TAXONOMY OF DATA
The term data (datum in singular form) refers to a collection of
facts usually obtained
as the result of experiments, observations, transactions, or
experiences. Data can consist
of numbers, letters, words, images, voice recordings, and so on,
as measurements of a
set of variables (characteristics of the subject or event that we
are interested in studying).
Data are often viewed as the lowest level of abstraction from
which information and then
knowledge is derived.
At the highest level of abstraction, one can classify data as
structured and unstruc-
tured (or semistructured). Unstructured data/semistructured data
are composed of
any combination of textual, imagery, voice, and Web content.
Unstructured/semistruc-
tured data will be covered in more detail in the text mining and
Web mining chapter.
Structured data are what data mining algorithms use and can be
classified as categori-
cal or numeric. The categorical data can be subdivided into
nominal or ordinal data,
whereas numeric data can be subdivided into intervals or ratios.
Figure 3.2 shows a
simple data taxonomy.
• Categorical data. These represent the labels of multiple classes
used to divide
a variable into specific groups. Examples of categorical
variables include race, sex,
age group, and educational level. Although the latter two
variables can also be
considered in a numerical manner by using exact values for age
and highest grade
completed, for example, it is often more informative to
categorize such variables
into a relatively small number of ordered classes. The
categorical data can also be
called discrete data, implying that they represent a finite
number of values with no
continuum between them. Even if the values used for the
categorical (or discrete)
variables are numeric, these numbers are nothing more than
symbols and do not
imply the possibility of calculating fractional values.
• Nominal data. These contain measurements of simple codes
assigned to objects
as labels, which are not measurements. For example, the
variable marital status
can be generally categorized as (1) single, (2) married, and (3)
divorced. Nominal
Data in Analytics
Structured Data Unstructured or Semi-Structured Data
Nominal
Ordinal
Textual
Multimedia
XML/JSON
Categorical Numerical
Interval
Ratio
Image
Audio
Video
FIGURE 3.2 A Simple Taxonomy of Data.
126 Part I • Introduction to Analytics and AI
data can be represented with binomial values having two
possible values (e.g.,
yes/no, true/false, good/bad) or multinomial values having three
or more pos-
sible values (e.g., brown/green/blue, white/black/Latino/Asian,
single/married/
divorced).
• Ordinal data. These contain codes assigned to objects or
events as labels that
also represent the rank order among them. For example, the
variable credit score
can be generally categorized as (1) low, (2) medium, or (3)
high. Similar ordered
relationships can be seen in variables such as age group (i.e.,
child, young,
middle-aged, elderly) and educational level (i.e., high school,
college, graduate
school). Some predictive analytic algorithms, such as ordinal
multiple logistic
regression, take into account this additional rank-order
information to build a
better classification model.
• Numeric data. These represent the numeric values of specific
variables.
Examples of numerically valued variables include age, number
of children, total
household income (in U.S. dollars), travel distance (in miles),
and temperature (in
Fahrenheit degrees). Numeric values representing a variable can
be integers (only
whole numbers) or real (also fractional numbers). The numeric
data can also be
called continuous data, implying that the variable contains
continuous measures
on a specific scale that allows insertion of interim values.
Unlike a discrete vari-
able, which represents finite, countable data, a continuous
variable represents scal-
able measurements, and it is possible for the data to contain an
infinite number of
fractional values.
• Interval data. These are variables that can be measured on
interval scales. A
common example of interval scale measurement is temperature
on the Celsius scale.
In this particular scale, the unit of measurement is 1/100 of the
difference between
the melting temperature and the boiling temperature of water in
atmospheric pres-
sure; that is, there is not an absolute zero value.
• Ratio data. These include measurement variables commonly
found in the physical
sciences and engineering. Mass, length, time, plane angle,
energy, and electric charge
are examples of physical measures that are ratio scales. The
scale type takes its name
from the fact that measurement is the estimation of the ratio
between a magnitude
of a continuous quantity and a unit magnitude of the same kind.
Informally, the dis-
tinguishing feature of a ratio scale is the possession of a
nonarbitrary zero value. For
example, the Kelvin temperature scale has a nonarbitrary zero
point of absolute zero,
which is equal to –273.15 degrees Celsius. This zero point is
nonarbitrary because
the particles that comprise matter at this temperature have zero
kinetic energy.
Other data types, including textual, spatial, imagery, video, and
voice, need to be
converted into some form of categorical or numeric
representation before they can be pro-
cessed by analytics methods (data mining algorithms; Delen,
2015). Data can also be classi-
fied as static or dynamic (i.e., temporal or time series).
Some predictive analytics (i.e., data mining) methods and
machine-learning
algorithms are very selective about the type of data that they
can handle. Providing them
with incompatible data types can lead to incorrect models or
(more often) halt the model
development process. For example, some data mining methods
need all the variables
(both input and output) represented as numerically valued
variables (e.g., neural net-
works, support vector machines, logistic regression). The
nominal or ordinal variables are
converted into numeric representations using some type of 1-of-
N pseudo variables (e.g.,
a categorical variable with three unique values can be
transformed into three pseudo
variables with binary values—1 or 0). Because this process
could increase the number of
variables, one should be cautious about the effect of such
representations, especially for
the categorical variables that have large numbers of unique
values.
Chapter 3 • Nature of Data, Statistical Modeling, and
Visualization 127
Similarly, some predictive analytics methods, such as ID3 (a
classic decision tree
algorithm) and rough sets (a relatively new rule induction
algorithm), need all the vari-
ables represented as categorically valued variables. Early
versions of these methods re-
quired the user to discretize numeric variables into categorical
representations before
they could be processed by the algorithm. The good news is that
most implementa-
tions of these algorithms in widely available software tools
accept a mix of numeric
and nominal variables and internally make the necessary
conversions before process-
ing the data.
Data come in many different variable types and representation
schemas. Business
analytics tools are continuously improving in their ability to
help data scientists in the
daunting task of data transformation and data representation so
that the data require-
ments of specific predictive models and algorithms can be
properly executed. Application
Case 3.1 illustrates a business scenario in which one of the
largest telecommunication
companies streamlined and used a wide variety of rich data
sources to generate customers
insight to prevent churn and to create new revenue sources.
The Problem
In the ultra-competitive telecommunications indus-
try, staying relevant to consumers while finding new
sources of revenue is critical, especially since cur-
rent revenue sources are in decline.
For Fortune 13 powerhouse Verizon, the
secret weapon that catapulted the company into the
nation’s largest and most reliable network provider
is also guiding the business toward future success
(see the following figure for some numbers about
Verizon). The secret weapon? Data and analytics.
Because telecommunication companies are typically
rich in data, having the right analytics solution and
personnel in place can uncover critical insights that
benefit every area of the business.
The Backbone of the Company
Since its inception in 2000, Verizon has partnered
with Teradata to create a data and analytics archi-
tecture that drives innovation and science-based
decision making. The goal is to stay relevant to cus-
tomers while also identifying new business oppor-
tunities and making adjustments that result in more
cost-effective operations.
“With business intelligence, we help the
business identify new business opportunities or
make course corrections to operate the business
in a more cost-effective way,” said Grace Hwang,
executive director of Financial Performance &
Analytics, BI, for Verizon. “We support decision
makers with the most relevant information to
improve the competitive advantage of Verizon.”
By leveraging data and analytics, Verizon is
able to offer a reliable network, ensure customer
satisfaction, and develop products and services that
consumers want to buy.
“Our incubator of new products and services will
help bring the future to our customers,” Hwang said.
“We’re using our network to make breakthroughs in
Application Case 3.1 Verizon Answers the Call for Innovation:
The Nation’s
Largest Network Provider uses Advanced Analytics to
Bring the Future to its Customers
Verizon by the Numbers
The top ranked wireless carrier in the U.S. has:
$131.6B
177K
1,700
112.1M
106.5M
13M
retail locations
retail connections
postpaid customers
TV and internet subscribers
in revenue
employees
$
(Continued )
128 Part I • Introduction to Analytics and AI
interactive entertainment, digital media, the Internet
of Things, and broadband services.”
Data Insights across Three Business Units
Verizon relies on advanced analytics that are exe-
cuted on the Teradata® Unified Data Architecture™
to support its business units. The analytics enable
Verizon to deliver on its promise to help customers
innovate their lifestyles and provide key insights to
support these three areas:
• Identify new revenue sources. Research and
development teams use data, analytics, and
strategic partnerships to test and develop
with the Internet of Things (IoT). The new
frontier in data is IoT, which will lead to new
revenues that in turn generate opportunities
for top-line growth. Smart cars, smart agricul-
ture, and smart IoT will all be part of this new
growth.
• Predict churn in the core mobile business.
Verizon has multiple use cases that demonstrate
how its advanced analytics enable laser-accurate
churn prediction—within a one to two percent
margin—in the mobile space. For a $131 billion
company, predicting churn with such precision
is significant. By recognizing specific patterns
in tablet data usage, Verizon can identify which
customers most often access their tablets, then
engage those who do not.
• Forecast mobile phone plans. Customer behav-
ioral analytics allow finance to better predict
earnings in fast-changing market conditions. The
U.S. wireless industry is moving from monthly
payments for both the phone and the service to
paying for the phone independently. This opens
up a new opportunity for Verizon to gain busi-
ness. The analytic environment helps Verizon
better predict churn with new plans and forecast
the impact of changes to pricing plans.
The analytics deliver what Verizon refers to as “hon-
est data” that inform various business units. “Our
mission is to be the honest voice and the indepen-
dent third-party opinion on the success or oppor-
tunities for improvement to the business,” Hwang
explains. “So my unit is viewed as the golden
source of information, and we come across with the
honest voice, and a lot of the business decisions are
through various rungs of course correction.”
Hwang adds that oftentimes, what forces a
company to react is competitors affecting change
in the marketplace, rather than the company
making the wrong decisions. “So we try to guide
the business through the best course of correc-
tion, wherever applicable, timely, so that we can
continue to deliver record-breaking results year
after year,” she said. “I have no doubt that the
business intelligence had led to such success in
the past.”
Disrupt and Innovate
Verizon leverages advanced analytics to optimize
marketing by sending the most relevant offers to
customers. At the same time, the company relies on
analytics to ensure they have the financial acumen
to stay number one in the U.S. mobile market. By
continuing to disrupt the industry with innovative
products and solutions, Verizon is positioned to
remain the wireless standard for the industry.
“We need the marketing vision and the sales
rigor to produce the most relevant offer to our
customers, and then at the same time we need
to have the finance rigor to ensure that whatever
we offer to the customer is also profitable to the
business so that we’re responsible to our share-
holders,” Hwang says.
In Summary—Executing the Seven Ps of
Modern Marketing
Telecommunications giant Verizon uses seven Ps
to drive its modern-day marketing efforts. The Ps,
when used in unison, help Verizon penetrate the
market in the way it predicted.
1. People: Understanding customers and their
needs to create the product.
2. Place: Where customers shop.
3. Product: The item that’s been manufactured
and is for sale.
Application Case 3.1 (Continued)
Chapter 3 • Nature of Data, Statistical Modeling, and
Visualization 129
u SECTION 3.3 REVIEW QUESTIONS
1. What are data? How do data differ from information and
knowledge?
2. What are the main categories of data? What types of data can
we use for BI and
analytics?
3. Can we use the same data representation for all analytics
models? Why, or
why not?
4. What is a 1-of-N data representation? Why and where is it
used in analytics?
3.4 ART AND SCIENCE OF DATA PREPROCESSING
Data in their original form (i.e., the real-world data) are not
usually ready to be used in
analytics tasks. They are often dirty, misaligned, overly
complex, and inaccurate. A te-
dious and time-demanding process (so-called data
preprocessing) is necessary to con-
vert the raw real-world data into a well-refined form for
analytics algorithms (Kotsiantis,
Kanellopoulos, & Pintelas, 2006). Many analytics professionals
would testify that the time
spent on data preprocessing (which is perhaps the least
enjoyable phase in the whole
process) is significantly longer than the time spent on the rest
of the analytics tasks
(the fun of analytics model building and assessment). Figure 3.3
shows the main steps in
the data preprocessing endeavor.
In the first step of data preprocessing, the relevant data are
collected from the iden-
tified sources, the necessary records and variables are selected
(based on an intimate
understanding of the data, the unnecessary information is
filtered out), and the records
coming from multiple data sources are integrated/merged
(again, using the intimate un-
derstanding of the data, the synonyms and homonyms are able
to be handled properly).
In the second step of data preprocessing, the data are cleaned
(this step is also
known as data scrubbing). Data in their original/raw/real-world
form are usually
dirty (Hernández & Stolfo, 1998; Kim et al., 2003). In this
phase, the values in the
data set are identified and dealt with. In some cases, missing
values are an anomaly
in the data set, in which case they need to be imputed (filled
with a most probable
value) or ignored; in other cases, the missing values are a
natural part of the data set
4. Process: How customers get to the shop or
place to buy the product.
5. Pricing: Working with promotions to get cus-
tomers’ attention.
6. Promo: Working with pricing to get customers’
attention.
7. Physical evidence: The business intelligence
that gives insights.
“The Aster and Hadoop environment allows us
to explore things we suspect could be the rea-
sons for breakdown in the seven Ps,” says Grace
Hwang, executive director of Financial Performance
& Analytics, BI, for Verizon. “This goes back to
providing the business value to our decision-
makers. With each step in the seven Ps, we ought
to be able to tell them where there are opportunities
for improvement.”
Questions for Case 3.1
1. What was the challenge Verizon was facing?
2. What was the data-driven solution proposed for
Verizon’s business units?
3. What were the results?
Source: Teradata Case Study “Verizon Answers the Call for
Innovation” https://www.teradata.com/Resources/Case-Studies/
Verizon-answers-the-call-for-innovation (accessed July 2018).
https://www.teradata.com/Resources/Case-Studies/Verizon-
answers-the-call-for-innovation
https://www.teradata.com/Resources/Case-Studies/Verizon-
answers-the-call-for-innovation
130 Part I • Introduction to Analytics and AI
(e.g., the household income field is often left unanswered by
people who are in the
top income tier). In this step, the analyst should also identify
noisy values in the data
(i.e., the outliers) and smooth them out. In addition,
inconsistencies (unusual values
within a variable) in the data should be handled using domain
knowledge and/or
expert opinion.
In the third step of data preprocessing, the data are transformed
for better process-
ing. For instance, in many cases, the data are normalized
between a certain minimum
and maximum for all variables to mitigate the potential bias of
one variable having
DW
Well-Formed
Data
Social Data
Legacy DBWeb Data
Data Consolidation
Collect data
Select data
Integrate data
Data Cleaning
Impute values
Reduce noise
Eliminate duplicates
Data Transformation
Normalize data
Discretize data
Create attributes
Data Reduction
Reduce dimension
Reduce volume
Balance data
OLTP
Raw Data
Sources
F
e
e
d
b
a
c
k
FIGURE 3.3 Data Preprocessing Steps.
Chapter 3 • Nature of Data, Statistical Modeling, and
Visualization 131
large numeric values (such as household income) dominating
other variables (such
as number of dependents or years in service, which could be
more important) having
smaller values. Another transformation that takes place is
discretization and/or aggrega-
tion. In some cases, the numeric variables are converted to
categorical values (e.g., low,
medium, high); in other cases, a nominal variable’s unique
value range is reduced to
a smaller set using concept hierarchies (e.g., as opposed to
using the individual states
with 50 different values, one could choose to use several
regions for a variable that
shows location) to have a data set that is more amenable to
computer processing. Still,
in other cases, one might choose to create new variables based
on the existing ones to
magnify the information found in a collection of variables in the
data set. For instance,
in an organ transplantation data set, one might choose to use a
single variable show-
ing the blood-type match (1: match, 0: no match) as opposed to
separate multinominal
values for the blood type of both the donor and the recipient.
Such simplification could
increase the information content while reducing the complexity
of the relationships in
the data.
The final phase of data preprocessing is data reduction. Even
though data scientists
(i.e., analytics professionals) like to have large data sets, too
much data can also be a
problem. In the simplest sense, one can visualize the data
commonly used in predictive
analytics projects as a flat file consisting of two dimensions:
variables (the number of
columns) and cases/records (the number of rows). In some cases
(e.g., image process-
ing and genome projects with complex microarray data), the
number of variables can be
rather large, and the analyst must reduce the number to a
manageable size. Because the
variables are treated as different dimensions that describe the
phenomenon from differ-
ent perspectives, in predictive analytics and data mining, this
process is commonly called
dimensional reduction (or variable selection). Even though there
is not a single best
way to accomplish this task, one can use the findings from
previously published litera-
ture; consult domain experts; run appropriate statistical tests
(e.g., principal component
analysis or independent component analysis); and, more
preferably, use a combination of
these techniques to successfully reduce the dimensions in the
data into a more manage-
able and most relevant subset.
With respect to the other dimension (i.e., the number of cases),
some data sets can
include millions or billions of records. Even though computing
power is increasing ex-
ponentially, processing such a large number of records cannot
be practical or feasible. In
such cases, one might need to sample a subset of the data for
analysis. The underlying
assumption of sampling is that the subset of the data will
contain all relevant patterns of
the complete data set. In a homogeneous data set, such an
assumption could hold well,
but real-world data are hardly ever homogeneous. The analyst
should be extremely careful
in selecting a subset of the data that reflects the essence of the
complete data set and is
not specific to a subgroup or subcategory. The data are usually
sorted on some variable,
and taking a section of the data from the top or bottom could
lead to a biased data set
on specific values of the indexed variable; therefore, always try
to randomly select the
records on the sample set. For skewed data, straightforward
random sampling might not
be sufficient, and stratified sampling (a proportional
representation of different subgroups
in the data is represented in the sample data set) might be
required. Speaking of skewed
data, it is a good practice to balance the highly skewed data by
either oversampling the
less represented or undersampling the more represented classes.
Research has shown
that balanced data sets tend to produce better prediction models
than unbalanced ones
(Thammasiri et al., 2014).
The essence of data preprocessing is summarized in Table 3.1,
which maps the
main phases (along with their problem descriptions) to a
representative list of tasks and
algorithms.
132 Part I • Introduction to Analytics and AI
TABLE 3.1 A Summary of Data Preprocessing Tasks and
Potential Methods
Main Task Subtasks Popular Methods
Data consolidation Access and collect the data
Select and filter the data
Integrate and unify the data
SQL queries, software agents, Web services.
Domain expertise, SQL queries, statistical tests.
SQL queries, domain expertise, ontology-driven data
mapping.
Data cleaning Handle missing values in the
data
Fill in missing values (imputations) with most appropriate val -
ues (mean, median, min/max, mode, etc.); recode the missing
values with a constant such as “ML”; remove the record of the
missing value; do nothing.
Identify and reduce noise in
the data
Identify the outliers in data with simple statistical techniques
(such as averages and standard deviations) or with cluster
analysis; once identified, either remove the outliers or smooth
them by using binning, regression, or simple averages.
Find and eliminate erroneous
data
Identify the erroneous values in data (other than outliers),
such as odd values, inconsistent class labels, odd distributions;
once identified, use domain expertise to correct the values or
remove the records holding the erroneous values.
Data transformation Normalize the data Reduce the range of
values in each numerically valued variable
to a standard range (e.g., 0 to 1 or -1 to +1) by using a vari-
ety of normalization or scaling techniques.
Discretize or aggregate the
data
If needed, convert the numeric variables into discrete represen-
tations using range- or frequency-based binning techniques;
for categorical variables, reduce the number of values by
applying proper concept hierarchies.
Construct new attributes Derive new and more informative
variables from the existing
ones using a wide range of mathematical functions (as simple
as addition and multiplication or as complex as a hybrid combi -
nation of log transformations).
Data reduction Reduce number of attributes Use principal
component analysis, independent component
analysis, chi-square testing, correlation analysis, and decision
tree induction.
Reduce number of records Perform random sampling, stratified
sampling, expert-
knowledge-driven purposeful sampling.
Balance skewed data Oversample the less represented or
undersample the more
represented classes.
It is almost impossible to underestimate the value proposition of
data preprocess-
ing. It is one of those time-demanding activities in which
investment of time and effort
pays off without a perceivable limit for diminishing returns.
That is, the more resources
you invest in it, the more you will gain at the end. Application
Case 3.2 illustrates an
interesting study that used raw, readily available academic data
within an educational
organization to develop predictive models to better understand
attrition and improve
freshman student retention in a large higher education
institution. As the application case
clearly states, each and every data preprocessing task described
in Table 3.1 was criti-
cal to a successful execution of the underlying analytics project,
especially the task that
related to the balancing of the data set.
Chapter 3 • Nature of Data, Statistical Modeling, and
Visualization 133
Student attrition has become one of the most chal-
lenging problems for decision makers in academic
institutions. Despite all the programs and services
that are put in place to help retain students, accord-
ing to the U.S. Department of Education’s Center for
Educational Statistics (nces.ed.gov), only about half
of those who enter higher education actually earn
a bachelor’s degree. Enrollment management and
the retention of students have become a top priority
for administrators of colleges and universities in the
United States and other countries around the world.
High dropout of students usually results in overall
financial loss, lower graduation rates, and an inferior
school reputation in the eyes of all stakeholders. The
legislators and policy makers who oversee higher
education and allocate funds, the parents who pay
for their children’s education to prepare them for a
better future, and the students who make college
choices look for evidence of institutional quality and
reputation to guide their decision-making processes.
The Proposed
Solution
To improve student retention, one should try to
understand the nontrivial reasons behind the attrition.
To be successful, one should also be able to accu-
rately identify those students who are at risk of drop-
ping out. So far, the vast majority of student attrition
research has been devoted to understanding this com-
plex, yet crucial, social phenomenon. Even though
these qualitative, behavioral, and survey-based stud-
ies revealed invaluable insight by developing and
testing a wide range of theories, they do not pro-
vide the much-needed instruments to accurately pre-
dict (and potentially improve) student attrition. The
project summarized in this case study proposed a
quantitative research approach in which the histori-
cal institutional data from student databases could
be used to develop models that are capable of pre-
dicting as well as explaining the institution-specific
nature of the attrition problem. The proposed analyt-
ics approach is shown in Figure 3.4.
Although the concept is relatively new to
higher education, for more than a decade now,
similar problems in the field of marketing man-
agement have been studied using predictive data
analytics techniques under the name of “churn
analysis” where the purpose has been to identify
a sample among current customers to answer the
question, “Who among our current customers are
more likely to stop buying our products or services?”
so that some kind of mediation or intervention pro-
cess can be executed to retain them. Retaining exist-
ing customers is crucial because, as we all know
and as the related research has shown time and time
again, acquiring a new customer costs on an order
of magnitude more effort, time, and money than try-
ing to keep the one that you already have.
Data Are of the Essence
The data for this research project came from a sin-
gle institution (a comprehensive public university
located in the Midwest region of the United States)
with an average enrollment of 23,000 students, of
which roughly 80 percent are the residents of the
same state and roughly 19 percent of the students
are listed under some minority classification. There
is no significant difference between the two genders
in the enrollment numbers. The average freshman
student retention rate for the institution was about
80 percent, and the average six-year graduation rate
was about 60 percent.
The study used five years of institutional data,
which entailed 16,000+ students enrolled as fresh-
men, consolidated from various and diverse univer-
sity student databases. The data contained variables
related to students’ academic, financial, and demo-
graphic characteristics. After merging and convert-
ing the multidimensional student data into a single
flat file (a file with columns representing the vari-
ables and rows representing the student records),
the resultant file was assessed and preprocessed to
identify and remedy anomalies and unusable val-
ues. As an example, the study removed all inter-
national student records from the data set because
they did not contain information about some of the
most reputed predictors (e.g., high school GPA, SAT
scores). In the data transformation phase, some of
the variables were aggregated (e.g., “Major” and
“Concentration” variables aggregated to binary vari-
ables MajorDeclared and ConcentrationSpecified)
Application Case 3.2 Improving Student Retention with Data-
Driven Analytics
(Continued )
134 Part I • Introduction to Analytics and AI
FIGURE 3.4 An Analytics Approach to Predicting Student
Attrition.
Application Case 3.2 (Continued)
Chapter 3 • Nature of Data, Statistical Modeling, and
Visualization 135
for better interpretation for the predictive model-
ing. In addition, some of the variables were used to
derive new variables (e.g., Earned/Registered ratio
and YearsAfterHighSchool).
Earned>Registered = EarnedHours>
RegisteredHours
YearsAfterHigh = FreshmenEnrollmentYear -
School HighSchoolGraduationYear
The Earned/Registered ratio was created to have
a better representation of the students’ resiliency and
determination in their first semester of the freshman
year. Intuitively, one would expect greater values for
this variable to have a positive impact on retention/
persistence. The YearsAfterHighSchool was created
to measure the impact of the time taken between
high school graduation and initial college enrollment.
Intuitively, one would expect this variable to be a
contributor to the prediction of attrition. These aggre-
gations and derived variables are determined based
on a number of experiments conducted for a number
of logical hypotheses. The ones that made more com-
mon sense and the ones that led to better prediction
accuracy were kept in the final variable set. Reflecting
the true nature of the subpopulation (i.e., the fresh-
men students), the dependent variable (i.e., “Second
Fall Registered”) contained many more yes records
(~80%) than no records (~20%; see Figure 3.5).
Research shows that having such imbalanced
data has a negative impact on model performance.
Therefore, the study experimented with the options of
using and comparing the results of the same type of
models built with the original imbalanced data (biased
for the yes records) and the well-balanced data.
Modeling and Assessment
The study employed four popular classification meth-
ods (i.e., artificial neural networks, decision trees, sup-
port vector machines, and logistic regression) along
with three model ensemble techniques (i.e., bagging,
busting, and information fusion). The results obtained
from all model types were then compared to each
other using regular classification model assessment
methods (e.g., overall predictive accuracy, sensitivity,
specificity) on the holdout samples.
In machine-learning algorithms (some of which
will be covered in Chapter 4), sensitivity analysis
is a method for identifying the “cause-and-effect”
relationship between the inputs and outputs of
a given prediction model. The fundamental idea
behind sensitivity analysis is that it measures the
importance of predictor variables based on the
change in modeling performance that occurs if
a predictor variable is not included in the model.
This modeling and experimentation practice is also
called a leave-one-out assessment. Hence, the mea-
sure of sensitivity of a specific predictor variable is
the ratio of the error of the trained model without
the predictor variable to the error of the model that
includes this predictor variable. The more sensitive
50% No
50% No
B
a
la
n
c
e
d
D
a
ta
Model Building, Testing,
and Validating
Model Assessment
TP FP
FN TN
Yes No
Yes
No
(80%, 80%, 80%)
(90%, 100%, 50%)
Which one
is better?
Input Data
80% No
20% Yes
*Yes: dropped out, No: persisted.
(accuracy, precision+, precision–)
Validate
Built
Test
Im
b
a
la
n
c
e
d
D
a
ta
FIGURE 3.5 A Graphical Depiction of the Class Imbalance
Problem.
(Continued )
136 Part I • Introduction to Analytics and AI
the network is to a particular variable, the greater
the performance decrease would be in the absence
of that variable and therefore the greater the ratio of
importance. In addition to the predictive power of
the models, the study also conducted sensitivity
analyses to determine the relative importance of the
input variables.
The Results
In the first set of experiments, the study used the
original imbalanced data set. Based on the 10-fold
cross-validation assessment results, the support vector
machines produced the best accuracy with an overall
prediction rate of 87.23 percent, and the decision tree
was the runner-up with an overall prediction rate of
87.16 percent, followed by artificial neural networks
and logistic regression with overall prediction rates
of 86.45 percent and 86.12 percent, respectively (see
Table 3.2). A careful examination of these results
reveals that the prediction accuracy for the “Yes” class
is significantly higher than the prediction accuracy of
the “No” class. In fact, all four model types predicted
the students who are likely to return for the second
year with better than 90 percent accuracy, but the
types did poorly on predicting the students who are
likely to drop out after the freshman year with less
than 50 percent accuracy. Because the prediction of
the “No” class is the main purpose of this study, less
than 50 percent accuracy for this class was deemed
not acceptable. Such a difference in prediction accu-
racy of the two classes can (and should) be attributed
to the imbalanced nature of the training data set (i.e.,
~80% “Yes” and ~20% “No” samples).
The next round of experiments used a well-
balanced data set in which the two classes are
represented nearly equally in counts. In realizing
this approach, the study took all samples from the
minority class (i.e., the “No” class herein), randomly
selected an equal number of samples from the major-
ity class (i.e., the “Yes” class herein), and repeated this
process 10 times to reduce potential bias of random
sampling. Each of these sampling processes resulted
in a data set of 7,000+ records, of which both class
labels (“Yes” and “No”) were equally represented.
Again, using a 10-fold cross-validation methodology,
the study developed and tested prediction models
for all four model types. The results of these experi -
ments are shown in Table 3.3. Based on the hold-
out sample results, support vector machines once
again generated the best overall prediction accuracy
with 81.18 percent followed by decision trees, artifi -
cial neural networks, and logistic regression with an
overall prediction accuracy of 80.65 percent, 79.85
percent, and 74.26 percent, respectively. As can be
seen in the per-class accuracy figures, the prediction
models did significantly better on predicting the “No”
class with the well-balanced data than they did with
the unbalanced data. Overall, the three machine-
learning techniques performed significantly better
than their statistical counterpart, logistic regression.
Next, another set of experiments was con-
ducted to assess the predictive ability of the three
ensemble models. Based on the 10-fold cross-
validation methodology, the information fusion–
type ensemble model produced the best results with
an overall prediction rate of 82.10 percent, followed
by the bagging-type ensembles and boosting-type
TABLE 3.2 Prediction Results for the Original/Unbalanced Data
Set
ANN(MLP) DT(C5) SVM LR
No Yes No Yes No Yes No Yes
No 1,494 384 1,518 304 1,478 255 1,438 376
Yes 1,596 11,142 1,572 11,222 1,612 11,271 1,652 11,150
SUM 3,090 11,526 3,090 11,526 3,090 11,526 3,090 11,526
Per-class accuracy 48.35% 96.67% 49.13% 97.36% 47.83%
97.79% 46.54% 96.74%
Overall accuracy 86.45% 87.16% 87.23% 86.12%
*ANN: Artificial Neural Network; MLP: Multi-Layer
Perceptron; DT: Decision Tree; SVM: Support Vector Machine;
LR: Logistic Regression
Application Case 3.2 (Continued)
Chapter 3 • Nature of Data, Statistical Modeling, and
Visualization 137
ensembles with overall prediction rates of 81.80 per-
cent and 80.21 percent, respectively (see Table 3.4).
Even though the prediction results are slightly better
than those of the individual models, ensembles are
known to produce more robust prediction systems
compared to a single-best prediction model (more
on this can be found in Chapter 4).
In addition to assessing the prediction accu-
racy for each model type, a sensitivity analysis was
also conducted using the developed prediction
models to identify the relative importance of the
independent variables (i.e., the predictors). In real -
izing the overall sensitivity analysis results, each of
the four individual model types generated its own
sensitivity measures, ranking all independent vari-
ables in a prioritized list. As expected, each model
type generated slightly different sensitivity rank-
ings of the independent variables. After collecting
all four sets of sensitivity numbers, the sensitivity
numbers are normalized and aggregated and plot-
ted in a horizontal bar chart (see Figure 3.6).
The Conclusions
The study showed that, given sufficient data with
the proper variables, data mining methods are
capable of predicting freshmen student attrition
with approximately 80 percent accuracy. Results
also showed that, regardless of the prediction
model employed, the balanced data set (compared
to unbalanced/original data set) produced better
prediction models for identifying the students who
are likely to drop out of the college prior to their
sophomore year. Among the four individual pre-
diction models used in this study, support vector
machines performed the best, followed by deci-
sion trees, neural networks, and logistic regres-
sion. From the usability standpoint, despite the
fact that support vector machines showed better
prediction results, one might choose to use deci-
sion trees, because compared to support vector
machines and neural networks, they portray a
more transparent model structure. Decision trees
TABLE 3.3 Prediction Results for the Balanced Data Set
Confusion
Matrix
ANN(MLP) DT(C5) SVM LR
No Yes No Yes No Yes No Yes
No 2,309 464 2311 417 2,313 386 2,125 626
Yes 781 2,626 779 2,673 777 2,704 965 2,464
SUM 3,090 3,090 3,090 3,090 3,090 3,090 3,090 3,090
Per-class accuracy 74.72% 84.98% 74.79% 86.50% 74.85%
87.51% 68.77% 79.74%
Overall accuracy 79.85% 80.65% 81.18% 74.26%
TABLE 3.4 Prediction Results for the Three Ensemble Models
Boosting Bagging Information Fusion
(boosted trees) (random forest) (weighted average)
No Yes No Yes No Yes
No 2,242 375 2,327 362 2,335 351
Yes 848 2,715 763 2,728 755 2,739
SUM 3,090 3,090 3,090 3,090 3,090 3,090
Per-class accuracy 72.56% 87.86% 75.31% 88.28% 75.57%
88.64%
Overall accuracy 80.21% 81.80% 82.10%
(Continued )
138 Part I • Introduction to Analytics and AI
explicitly show the reasoning process of different
predictions, providing a justification for a specific
outcome, whereas support vector machines and
artificial neural networks are mathematical models
that do not provide such a transparent view of
“how they do what they do.”
Questions for Case 3.2
1. What is student attrition, and why is it an impor-
tant problem in higher education?
2. What were the traditional methods to deal with
the attrition problem?
3. List and discuss the data-related challenges
within the context of this case study.
4. What was the proposed solution? What were the
results?
Sources: D. Thammasiri, D. Delen, P. Meesad, & N. Kasap, “A
Critical Assessment of Imbalanced Class Distribution Problem:
The
Case of Predicting Freshmen Student Attrition,” Expert Systems
with
Applications, 41(2), 2014, pp. 321–330; D. Delen, “A
Comparative
Analysis of Machine Learning Techniques for Student Retention
Management,” Decision Support Systems, 49(4), 2010, pp. 498–
506,
and “Predicting Student Attrition with Data Mining Methods,”
Journal of College Student Retention 13(1), 2011, pp. 17–35.
EarnedByRegistered
SpringStudentLoan
FallGPA
SpringGrantTuitionWaiverScholarship
FallRegisteredHours
FallStudentLoan
MaritalStatus
AdmissionType
Ethnicity
SATHighMath
SATHighEnglish
FallFederalWorkStudy
SpringFederalWorkStudy
FallGrantTuitionWaiverScholarship
PermanentAddressState
SATHighScience
SATHighComprehensive
SATHighReading
TransferredHours
ReceivedFallAid
MajorDeclared
ConcentrationSpecified
StartingTerm
HighSchoolGraduationMonth
HighSchoolGPA
YearsAfterHS
Age
0.00 0.20 0.40 0.60 1.000.80 1.20
Sex
CLEPHours
FIGURE 3.6 Sensitivity-Analysis-Based Variable Importance
Results.
Application Case 3.2 (Continued)
Chapter 3 • Nature of Data, Statistical Modeling, and
Visualization 139
u SECTION 3.4 REVIEW QUESTIONS
1. Why are the original/raw data not readily usable by analytics
tasks?
2. What are the main data preprocessing steps?
3. What does it mean to clean/scrub the data? What activities
are performed in this
phase?
4. Why do we need data transformation? What are the
commonly used data transforma-
tion tasks?
5. Data reduction can be applied to rows (sampling) and/or
columns (variable selec-
tion). Which is more challenging?
3.5 STATISTICAL MODELING FOR BUSINESS ANALYTICS
Because of the increasing popularity of business analytics, the
traditional statistical meth-
ods and underlying techniques are also regaining their
attractiveness as enabling tools to
support evidence-based managerial decision making. Not only
are they regaining atten-
tion and admiration, but this time, they are attracting business
users in addition to statisti-
cians and analytics professionals.
Statistics (statistical methods and underlying techniques) is
usually considered as
part of descriptive analytics (see Figure 3.7). Some of the
statistical methods can also be
considered as part of predictive analytics, such as discriminant
analysis, multiple regres-
sion, logistic regression, and k-means clustering. As shown in
Figure 3.7, descriptive ana-
lytics has two main branches: statistics and online analytics
processing (OLAP). OLAP
is the term used for analyzing, characterizing, and summarizing
structured data stored in
organizational databases (often stored in a data warehouse or in
a data mart) using cubes
(i.e., multidimensional data structures that are created to extract
a subset of data values to
answer a specific business question). The OLAP branch of
descriptive analytics has also
been called business intelligence. Statistics, on the other hand,
helps to characterize the
data, either one variable at a time or multivariable, all together
using either descriptive or
inferential methods.
Statistics—a collection of mathematical techniques to
characterize and interpret
data—has been around for a very long time. Many methods and
techniques have been
developed to address the needs of the end users and the unique
characteristics of the
data being analyzed. Generally speaking, at the highest level,
statistical methods can be
Descriptive Inferential
OLAP Statistics
Business Analytics
Descriptive Predictive Prescriptive
FIGURE 3.7 Relationship between Statistics and Descriptive
Analytics.
140 Part I • Introduction to Analytics and AI
classified as either descriptive or inferential. The main
difference between descriptive and
inferential statistics is the data used in these methods—whereas
descriptive statistics
is all about describing the sample data on hand, inferential
statistics is about drawing
inferences or conclusions about the characteristics of the
population. In this section, we
briefly describe descriptive statistics (because of the fact that it
lays the foundation for,
and is the integral part of, descriptive analytics), and in the
following section we cover
regression (both linear and logistic regression) as part of
inferential statistics.
Descriptive Statistics for Descriptive Analytics
Descriptive statistics, as the name implies, describes the basic
characteristics of the data at
hand, often one variable at a time. Using formulas and
numerical aggregations, descrip-
tive statistics summarizes the data in such a way that often
meaningful and easily under-
standable patterns emerge from the study. Although it is very
useful in data analytics and
very popular among the statistical methods, descriptive
statistics does not allow making
conclusions (or inferences) beyond the sample of the data being
analyzed. That is, it is
simply a nice way to characterize and describe the data on hand
without making conclu-
sions (inferences or extrapolations) regarding the population of
related hypotheses we
might have in mind.
In business analytics, descriptive statistics plays a critical
role—it allows us to un-
derstand and explain/present our data in a meaningful manner
using aggregated num-
bers, data tables, or charts/graphs. In essence, descriptive
statistics helps us convert our
numbers and symbols into meaningful representations for
anyone to understand and use.
Such an understanding helps not only business users in their
decision-making processes
but also analytics professionals and data scientists to
characterize and validate the data for
other more sophisticated analytics tasks. Descriptive statistics
allows analysts to identify
data concertation, unusually large or small values (i.e.,
outliers), and unexpectedly dis-
tributed data values for numeric variables. Therefore, the
methods in descriptive statistics
can be classified as either measures for central tendency or
measures of dispersion. In
the following section, we use a simple description and
mathematical formulation/repre-
sentation of these measures. In mathematical representation, we
will use x1, x2, . . . , xn to
represent individual values (observations) of the variable
(measure) that we are interested
in characterizing.
Measures of Centrality Tendency (Also Called Measures
of Location or Centrality)
Measures of centrality are the mathematical methods by which
we estimate or describe
central positioning of a given variable of interest. A measure of
central tendency is a
single numerical value that aims to describe a set of data by
simply identifying or estimat-
ing the central position within the data. The mean (often called
the arithmetic mean or
the simple average) is the most commonly used measure of
central tendency. In addition
to mean, you could also see median or mode being used to
describe the centrality of a
given variable. Although, the mean, median, and mode are all
valid measures of central
tendency, under different circumstances, one of these measures
of centrality becomes
more appropriate than the others. What follows are short
descriptions of these measures,
including how to calculate them mathematically and pointers on
the circumstances in
which they are the most appropriate measure to use.
Arithmetic Mean
The arithmetic mean (or simply mean or average) is the sum of
all the values/observa-
tions divided by the number of observations in the data set. It is
by far the most popular
Chapter 3 • Nature of Data, Statistical Modeling, and
Visualization 141
and most commonly used measure of central tendency. It is used
with continuous or
discrete numeric data. For a given variable x, if we happen to
have n values/observations
1x1, x2, . . ., xn2, we can write the arithmetic mean of the data
sample (x, pronounced as
x-bar) as follows:
x =
x1 + x2 + g + xn
n
or
x = a i=1
n
xi
n
The mean has several unique characteristics. For instance, the
sum of the absolute devia-
tions (differences between the mean and the observations) above
the mean is the same
as the sum of the deviations below the mean, balancing the
values on either side of it.
That said, it does not suggest, however, that half the
observations are above and the other
half are below the mean (a common misconception among those
who do not know basic
statistics). Also, the mean is unique for every data set and is
meaningful and calculable
for both interval- and ratio-type numeric data. One major
downside is that the mean can
be affected by outliers (observations that are considerably
larger or smaller than the rest
of the data points). Outliers can pull the mean toward their
direction and, hence, bias the
centrality representation. Therefore, if there are outliers or if
the data are erratically dis-
persed and skewed, one should either avoid using the mean as
the measure of centrality
or augment it with other central tendency measures, such as
median and mode.
Median
The median is the measure of center value in a given data set. It
is the number in the
middle of a given set of data that has been arranged/sorted in
order of magnitude (either
ascending or descending). If the number of observations is an
odd number, identifying
the median is very easy—just sort the observations based on
their values and pick the
value right in the middle. If the number of observations is an
even number, identify the
two middle values, and then take the simple average of these
two values. The median is
meaningful and calculable for ratio, interval, and ordinal data
types. Once determined,
one-half of the data points in the data is above and the other
half is below the median. In
contrary to the mean, the median is not affected by outliers or
skewed data.
Mode
The mode is the observation that occurs most frequently (the
most frequent value in our
data set). On a histogram, it represents the highest bar in a bar
chart, and, hence, it can
be considered as the most popular option/value. The mode is
most useful for data sets
that contain a relatively small number of unique values. That is,
it could be useless if the
data have too many unique values (as is the case in many
engineering measurements
that capture high precision with a large number of decimal
places), rendering each value
having either one or a very small number representing its
frequency. Although it is a
useful measure (especially for nominal data), mode is not a very
good representation of
centrality, and therefore, it should not be used as the only
measure of central tendency
for a given data set.
In summary, which central tendency measure is the best?
Although there is not a
clear answer to this question, here are a few hints—use the
mean when the data are not
prone to outliers and there is no significant level of skewness;
use the median when the
data have outliers and/or it is ordinal in nature; use the mode
when the data are nominal.
142 Part I • Introduction to Analytics and AI
Perhaps the best practice is to use all three together so that the
central tendency of the
data set can be captured and represented from three
perspectives. Mostly because “av-
erage” is a very familiar and highly used concept to everyone in
regular daily activities,
managers (as well as some scientists and journalists) often use
the centrality measures
(especially mean) inappropriately when other statistical
information should be consid-
ered along with the centrality. It is a better practice to present
descriptive statistics as a
package—a combination of centrality and dispersion
measures—as opposed to a single
measure such as mean.
Measures of Dispersion (Also Called Measures of Spread
or Decentrality)
Measures of dispersion are the mathematical methods used to
estimate or describe the
degree of variation in a given variable of interest. They
represent the numerical spread
(compactness or lack thereof) of a given data set. To describe
this dispersion, a number
of statistical measures are developed; the most notable ones are
range, variance, and
standard deviation (and also quartiles and absolute deviation).
One of the main reasons
why the measures of dispersion/spread of data values are
important is the fact that they
give us a framework within which we can judge the central
tendency—give us the indica-
tion of how well the mean (or other centrality measures)
represents the sample data. If
the dispersion of values in the data set is large, the mean is not
deemed to be a very good
representation of the data. This is because a large dispersion
measure indicates large dif-
ferences between individual scores. Also, in research, it is often
perceived as a positive
sign to see a small variation within each data sample, as it may
indicate homogeneity,
similarity, and robustness within the collected data.
Range
The range is perhaps the simplest measure of dispersion. It is
the difference between
the largest and the smallest values in a given data set (i.e.,
variables). So we calculate
range by simply identifying the smallest value in the data set
(minimum), identifying the
largest value in the data set (maximum), and calculating the
difference between them
(range = maximum - minimum).
Variance
A more comprehensive and sophisticated measure of dispersion
is the variance. It is
a method used to calculate the deviation of all data points in a
given data set from the
mean. The larger the variance, the more the data are spread out
from the mean and the
more variability one can observe in the data sample. To prevent
the offsetting of negative
and positive differences, the variance takes into account the
square of the distances from
the mean. The formula for a data sample can be written as
s2 =
a ni = 1( xi - x )2
n - 1
where n is the number of samples, x is the mean of the sample,
and xi is the i
th
value in the data set. The larger values of variance indicate
more dispersion, whereas
smaller values indicate compression in the overall data set.
Because the differences
are squared, larger deviations from the mean contribute
significantly to the value of
variance. Again, because the differences are squared, the
numbers that represent de-
viation/variance become somewhat meaningless (as opposed to a
dollar difference,
here you are given a squared dollar difference). Therefore,
instead of variance, in
Chapter 3 • Nature of Data, Statistical Modeling, and
Visualization 143
many business applications, we use a more meaningful
dispersion measure, called
standard deviation.
Standard Deviation
The standard deviation is also a measure of the spread of values
within a set of data.
The standard deviation is calculated by simply taking the square
root of the variations. The
following formula shows the calculation of standard deviation
from a given sample of
data points.
s = A a ni = 1(xi - x )2n - 1
Mean Absolute Deviation
In addition to variance and standard deviation, sometimes we
also use mean absolute
deviation to measure dispersion in a data set. It is a simpler way
to calculate the overall
deviation from the mean. Specifically, the mean absolute
deviation is calculated by mea-
suring the absolute values of the differences between each data
point and the mean and
then summing them. This process provides a measure of spread
without being specific
about the data point being lower or higher than the mean. The
following formula shows
the calculation of the mean absolute deviation:
MAD =
a ni =1� xi - x �
n
Quartiles and Interquartile Range
Quartiles help us identify spread within a subset of the data. A
quartile is a quarter of
the number of data points given in a data set. Quartiles are
determined by first sorting
the data and then splitting the sorted data into four disjoint
smaller data sets. Quartiles
are a useful measure of dispersion because they are much less
affected by outliers or a
skewness in the data set than the equivalent measures in the
whole data set. Quartiles
are often reported along with the median as the best choice of
measure of dispersion
and central tendency, respectively, when dealing with skewed
and/or data with outliers.
A common way of expressing quartiles is as an interquartile
range, which describes the
difference between the third quartile (Q3) and the first quartile
(Q1), telling us about the
range of the middle half of the scores in the distribution. The
quartile-driven descriptive
measures (both centrality and dispersion) are best explained
with a popular plot called a
box-and-whiskers plot (or box plot).
Box-and-Whiskers Plot
The box-and-whiskers plot (or simply a box plot) is a graphical
illustration of several
descriptive statistics about a given data set. They can be either
horizontal or vertical, but
vertical is the most common representation, especially in
modern-day analytics software
products. It is known to be first created and presented by John
W. Tukey in 1969. Box
plot is often used to illustrate both centrality and dispersion of a
given data set (i.e., the
distribution of the sample data) in an easy-to-understand
graphical notation. Figure 3.8
shows two box plots side by side, sharing the same y-axis. As
shown therein, a single
chart can have one or more box plots for visual comparison
purposes. In such cases,
the y-axis would be the common measure of magnitude (the
numerical value of the
144 Part I • Introduction to Analytics and AI
variable), with the x-axis showing different classes/subsets such
as different time dimen-
sions (e.g., descriptive statistics for annual Medicare expenses
in 2015 versus 2016) or
different categories (e.g., descriptive statistics for marketing
expenses versus total sales).
Although historically speaking, the box plot has not been used
widely and often
enough (especially in areas outside of statistics), with the
emerging popularity of business
analytics, it is gaining fame in less technical areas of the
business world. Its information
richness and ease of understanding are largely to credit for its
recent popularity.
The box plot shows the centrality (median and sometimes also
mean) as well as
the dispersion (the density of the data within the middle half—
drawn as a box between
the first and third quartiles), the minimum and maximum ranges
(shown as extended
lines from the box, looking like whiskers, that are calculated as
1.5 times the upper or
lower end of the quartile box), and the outliers that are larger
than the limits of the whis-
kers. A box plot also shows whether the data are symmetrically
distributed with respect
to the mean or sway one way or another. The relative position
of the median versus
mean and the lengths of the whiskers on both side of the box
give a good indication of
the potential skewness in the data.
x
Max
Upper
Quartile
Median
Lower
Quartile
Min
Outliers
Outliers
Larger than 1.5 times the
upper quartile
Largest value, excluding
larger outliers
25% of data is larger than
this value
25% of data is smaller
than this value
Smallest value, excluding
smaller outliers
Smaller than 1.5 times the
lower quartile
Mean
50% of data is larger than
this value—middle of dataset
Simple average of the dataset
x
Variable 1 Variable 2
FIGURE 3.8 Understanding the Specifics about Box-and-
Whiskers Plots.
Chapter 3 • Nature of Data, Statistical Modeling, and
Visualization 145
Shape of a Distribution
Although not as common as the centrality and dispersion, the
shape of the data distribu-
tion is also a useful measure for the descriptive statistics.
Before delving into the shape of
the distribution, we first need to define the distribution itself.
Simply put, distribution is
the frequency of data points counted and plotted over a small
number of class labels or
numerical ranges (i.e., bins). In a graphical illustration of
distribution, the y-axis shows
the frequency (count or percentage), and the x-axis shows the
individual classes or bins
in a rank-ordered fashion. A very well-known distribution is
called normal distribution,
which is perfectly symmetric on both sides of the mean and has
numerous well-founded
mathematical properties that make it a very useful tool for
research and practice. As the
dispersion of a data set increases, so does the standard
deviation, and the shape of the
distribution looks wider. A graphic illustration of the
relationship between dispersion and
distribution shape (in the context of normal distribution) is
shown in Figure 3.9.
There are two commonly used measures to calculate the shape
characteristics of a
distribution: skewness and kurtosis. A histogram (frequency
plot) is often used to visually
illustrate both skewness and kurtosis.
Skewness is a measure of asymmetry (sway) in a distribution of
the data that por-
trays a unimodal structure—only one peak exists in the
distribution of the data. Because
normal distribution is a perfectly symmetric unimodal
distribution, it does not have
0 1 2 3212223
(a)
(c)
(d)
(b)
FIGURE 3.9 Relationship between Dispersion and Distribution
Shape Properties.
146 Part I • Introduction to Analytics and AI
skewness; that is, its skewness measure (i.e., the value of the
coefficient of skewness) is
equal to zero. The skewness measure/value can be either
positive or negative. If the dis-
tribution sways left (i.e., the tail is on the right side and the
mean is smaller than median),
then it produces a positive skewness measure; if the distribution
sways right (i.e., the tail
is on the left side and the mean is larger than median), then it
produces a negative skew-
ness measure. In Figure 3.9, (c) represents a positively skewed
distribution whereas (d)
represents a negatively skewed distribution. In the same figure,
both (a) and (b) represent
perfect symmetry and hence zero measure for skewness.
Skewness = S =
a ni = 1(xi - x)3
(n - 1)s3
where s is the standard deviation and n is the number of
samples.
Kurtosis is another measure to use in characterizing the shape
of a unimodal dis-
tribution. As opposed to the sway in shape, kurtosis focuses
more on characterizing the
peak/tall/skinny nature of the distribution. Specifically, kurtosis
measures the degree to
which a distribution is more or less peaked than a normal
distribution. Whereas a posi-
tive kurtosis indicates a relatively peaked/tall distribution, a
negative kurtosis indicates a
relatively flat/short distribution. As a reference point, a normal
distribution has a kurtosis
of 3. The formula for kurtosis can be written as
Kurtosis = K =
a ni = 1(xi - x)4
ns4
-3
Descriptive statistics (as well as inferential statistics) can easily
be calculated using com-
mercially viable statistical software packages (e.g., SAS, SPSS,
Minitab, JMP, Statistica) or
free/open source tools (e.g., R). Perhaps the most convenient
way to calculate descriptive
and some of the inferential statistics is to use Excel.
Technology Insights 3.1 describes in
detail how to use Microsoft Excel to calculate descriptive
statistics.
TECHNOLOGY INSIGHTS 3.1 How to Calculate Descriptive
Statistics
in Microsoft Excel
Excel, arguably the most popular data analysis tool in the
world, can easily be used for descriptive
statistics. Although the base configuration of Excel does not
seem to have the statistics function
readily available for end users, those functions come with the
Excel installation and can be acti-
vated (turned on) with only a few mouse clicks. Figure 3.10
shows how these statistics functions
(as part of the Analysis ToolPak) can be activated in Microsoft
Excel 2016.
Once activated, the Analysis ToolPak will appear in the Data
menu option under the
name of Data Analysis. When you click on Data Analysis in the
Analysis group under the Data
tab in the Excel menu bar, you will see Descriptive Statistics as
one of the options within the
list of data analysis tools (see Figure 3.11, steps 1, 2); click on
OK, and the Descriptive Statistics
dialog box will appear (see the middle of Figure 3.11). In this
dialog box, you need to enter
the range of the data, which can be one or more numerical
columns, along with the preference
check boxes, and click OK (see Figure 3.11, steps 3, 4). If the
selection includes more than one
numeric column, the tool treats each column as a separate data
set and provides descriptive
statistics for each column separately.
As a simple example, we selected two columns (labeled as
Expense and Demand) and
executed the Descriptive Statistics option. The bottom section
of Figure 3.11 shows the output
created by Excel. As can be seen, Excel produced all
descriptive statistics that are covered in
the previous section and added a few more to the list. In Excel
2016, it is also very easy (a few
Chapter 3 • Nature of Data, Statistical Modeling, and
Visualization 147
1
2
3
4
FIGURE 3.10 Activating Statistics Function in Excel 2016.
148 Part I • Introduction to Analytics and AI
3
1
4
2
FIGURE 3.11 Obtaining Descriptive Statistics in Excel.
Chapter 3 • Nature of Data, Statistical Modeling, and
Visualization 149
1
2
3
FIGURE 3.12 Creating a Box-and-Whiskers Plot in Excel 2016.
mouse clicks) to create a box-and-whiskers plot. Figure 3.12
shows the simple three-step pro-
cess of creating a box-and-whiskers plot in Excel.
Although Analysis ToolPak is a very useful tool in Excel, one
should be aware of an im-
portant point related to the results that it generates, which have
a different behavior than other
ordinary Excel functions: Although Excel functions dynamically
change as the underlying data in
the spreadsheet are changed, the results generated by the
Analysis ToolPak do not. For example, if
you change the values in either or both of these columns, the
Descriptive Statistics results produced
by the Analysis ToolPak will stay the same. However, the same
is not true for ordinary Excel func-
tions. If you were to calculate the mean value of a given column
(using “=AVERAGE(A1:A121)”)
and then change the values within the data range, the mean
value would automatically change. In
summary, the results produced by Analysis ToolPak do not have
a dynamic link to the underlying
data, and if the data change, the analysis needs to be redone
using the dialog box.
Successful applications of data analytics cover a wide range of
business and organizational
settings, addressing problems once thought unsolvable.
Application Case 3.3 is an excellent il-
lustration of those success stories in which a small municipality
administration adopted a data
analytics approach to intelligently detect and solve problems by
continuously analyzing demand
and consumption patterns.
u SECTION 3.5 REVIEW QUESTIONS
1. What is the relationship between statistics and business
analytics?
2. What are the main differences between descriptive and
inferential statistics?
3. List and briefly define the central tendency measures of
descriptive statistics.
4. List and briefly define the dispersion measures of descriptiv e
statistics.
5. What is a box-and-whiskers plot? What types of statistical
information does it represent?
6. What are the two most commonly used shape characteristics
to describe a data distribution?
150 Part I • Introduction to Analytics and AI
A leaky faucet. A malfunctioning dishwasher. A cracked
sprinkler head. These are more than just a headache
for a home owner or business to fix. They can be
costly, unpredictable, and, unfortunately, hard to pin-
point. Through a combination of wireless water meters
and a data-analytics-driven, customer-accessible portal,
the Town of Cary, North Carolina, is making it much
easier to find and fix water loss issues. In the process,
the town has gained a big-picture view of water usage
critical to planning future water plant expansions and
promoting targeted conservation efforts.
When the town of Cary installed wireless
meters for 60,000 customers in 2010, it knew the
new technology wouldn’t just save money by
eliminating manual monthly readings; the town
also realized it would get more accurate and
timely information about water consumption.
The Aquastar wireless system reads meters once
an hour—that is 8,760 data points per customer
each year instead of 12 monthly readings. The data
had tremendous potential if they could be easily
consumed.
“Monthly readings are like having a gallon of
water’s worth of data. Hourly meter readings are
more like an Olympic-size pool of data,” says Karen
Mills, finance director for Cary. “SAS helps us man-
age the volume of that data nicely.” In fact, the solu-
tion enables the town to analyze half a billion data
points on water usage and make them available to
and easily consumable by all customers.
The ability to visually look at data by house-
hold or commercial customer by the hour has led to
some very practical applications:
• The town can notify customers of potential
leaks within days.
• Customers can set alerts that notify them with-
in hours if there is a spike in water usage.
• Customers can track their water usage online,
helping them to be more proactive in conserv-
ing water.
Through the online portal, one business in the
town saw a spike in water consumption on weekends
when employees are away. This seemed odd, and
the unusual reading helped the company learn that a
commercial dishwasher was malfunctioning, running
continuously over weekends. Without the wireless
water-meter data and the customer-accessible portal,
this problem could have gone unnoticed, continuing
to waste water and money.
The town has a much more accurate picture
of daily water usage per person, critical for planning
future water plant expansions. Perhaps the most
interesting perk is that the town was able to verify a
hunch that has far-reaching cost ramifications: Cary
residents are very economical in their use of water.
“We calculate that with modern high-efficiency appli-
ances, indoor water use could be as low as 35 gal-
lons per person per day. Cary residents average 45
gallons, which is still phenomenall y low,” explains
town Water Resource Manager Leila Goodwin. Why
is this important? The town was spending money
to encourage water efficiency—rebates on low-flow
toilets or discounts on rain barrels. Now it can take
a more targeted approach, helping specific consum-
ers understand and manage both their indoor and
outdoor water use.
SAS was critical not just for enabling residents
to understand their water use but also working
behind the scenes to link two disparate databases.
“We have a billing database and the meter-reading
117LEARNING OBJECTIVESNature of Data, Statistical Mo

More Related Content

Similar to 117LEARNING OBJECTIVESNature of Data, Statistical Mo

OpenText Big Data Analytics for Telecommunications - Solution Overview
OpenText Big Data Analytics for Telecommunications - Solution OverviewOpenText Big Data Analytics for Telecommunications - Solution Overview
OpenText Big Data Analytics for Telecommunications - Solution OverviewOpenText
 
The CFO in the Age of Digital Analytics
The CFO in the Age of Digital AnalyticsThe CFO in the Age of Digital Analytics
The CFO in the Age of Digital AnalyticsAnametrix
 
Data Mining Services in various types
Data Mining Services in various typesData Mining Services in various types
Data Mining Services in various typesloginworks software
 
Research Presentation: How Numbers are Powering the Next Era of Marketing
Research Presentation: How Numbers are Powering the Next Era of MarketingResearch Presentation: How Numbers are Powering the Next Era of Marketing
Research Presentation: How Numbers are Powering the Next Era of MarketingMediaPost
 
Business Intelligence, Data Analytics, and AI
Business Intelligence, Data Analytics, and AIBusiness Intelligence, Data Analytics, and AI
Business Intelligence, Data Analytics, and AIJohnny Jepp
 
What are Big Data, Data Science, and Data Analytics
 What are Big Data, Data Science, and Data Analytics What are Big Data, Data Science, and Data Analytics
What are Big Data, Data Science, and Data AnalyticsRay Business Technologies
 
Going Strategic: DAM for a New Decade
Going Strategic: DAM for a New DecadeGoing Strategic: DAM for a New Decade
Going Strategic: DAM for a New DecadeRebekah Rodriguez
 
Entry Points – How to Get Rolling with Big Data Analytics
Entry Points – How to Get Rolling with Big Data AnalyticsEntry Points – How to Get Rolling with Big Data Analytics
Entry Points – How to Get Rolling with Big Data AnalyticsInside Analysis
 
Acumen insurance Data Warehouse
Acumen insurance Data WarehouseAcumen insurance Data Warehouse
Acumen insurance Data WarehouseNIIT Technologies
 
Marketing Audit Example
Marketing Audit ExampleMarketing Audit Example
Marketing Audit ExampleTim Bourgeois
 
Becoming A Digital Business
Becoming A Digital BusinessBecoming A Digital Business
Becoming A Digital BusinessKen Polotan
 
How Insurers Can Tame Data to Drive Innovation
How Insurers Can Tame Data to Drive InnovationHow Insurers Can Tame Data to Drive Innovation
How Insurers Can Tame Data to Drive InnovationCognizant
 
The new patterns of innovation
The new patterns of innovationThe new patterns of innovation
The new patterns of innovationkrushali98
 
Introduction Datalicious Korea
Introduction Datalicious KoreaIntroduction Datalicious Korea
Introduction Datalicious KoreaDatalicious Korea
 
Modernizing Insurance Data to Drive Intelligent Decisions
Modernizing Insurance Data to Drive Intelligent DecisionsModernizing Insurance Data to Drive Intelligent Decisions
Modernizing Insurance Data to Drive Intelligent DecisionsCognizant
 
infigraph_digitalanalytic_v1.0
infigraph_digitalanalytic_v1.0infigraph_digitalanalytic_v1.0
infigraph_digitalanalytic_v1.0Tjikal Jedy
 
Capitalize On Social Media With Big Data Analytics
Capitalize On Social Media With Big Data AnalyticsCapitalize On Social Media With Big Data Analytics
Capitalize On Social Media With Big Data AnalyticsHassan Keshavarz
 
The 10 most promising bi and analytics solution providers 2018
The 10 most promising bi and analytics solution providers 2018 The 10 most promising bi and analytics solution providers 2018
The 10 most promising bi and analytics solution providers 2018 Merry D'souza
 

Similar to 117LEARNING OBJECTIVESNature of Data, Statistical Mo (20)

OpenText Big Data Analytics for Telecommunications - Solution Overview
OpenText Big Data Analytics for Telecommunications - Solution OverviewOpenText Big Data Analytics for Telecommunications - Solution Overview
OpenText Big Data Analytics for Telecommunications - Solution Overview
 
The CFO in the Age of Digital Analytics
The CFO in the Age of Digital AnalyticsThe CFO in the Age of Digital Analytics
The CFO in the Age of Digital Analytics
 
6 Reasons to Use Data Analytics
6 Reasons to Use Data Analytics6 Reasons to Use Data Analytics
6 Reasons to Use Data Analytics
 
Data Mining Services in various types
Data Mining Services in various typesData Mining Services in various types
Data Mining Services in various types
 
Research Presentation: How Numbers are Powering the Next Era of Marketing
Research Presentation: How Numbers are Powering the Next Era of MarketingResearch Presentation: How Numbers are Powering the Next Era of Marketing
Research Presentation: How Numbers are Powering the Next Era of Marketing
 
Business Intelligence, Data Analytics, and AI
Business Intelligence, Data Analytics, and AIBusiness Intelligence, Data Analytics, and AI
Business Intelligence, Data Analytics, and AI
 
What are Big Data, Data Science, and Data Analytics
 What are Big Data, Data Science, and Data Analytics What are Big Data, Data Science, and Data Analytics
What are Big Data, Data Science, and Data Analytics
 
Going Strategic: DAM for a New Decade
Going Strategic: DAM for a New DecadeGoing Strategic: DAM for a New Decade
Going Strategic: DAM for a New Decade
 
Entry Points – How to Get Rolling with Big Data Analytics
Entry Points – How to Get Rolling with Big Data AnalyticsEntry Points – How to Get Rolling with Big Data Analytics
Entry Points – How to Get Rolling with Big Data Analytics
 
Acumen insurance Data Warehouse
Acumen insurance Data WarehouseAcumen insurance Data Warehouse
Acumen insurance Data Warehouse
 
Marketing Audit Example
Marketing Audit ExampleMarketing Audit Example
Marketing Audit Example
 
Becoming A Digital Business
Becoming A Digital BusinessBecoming A Digital Business
Becoming A Digital Business
 
How Insurers Can Tame Data to Drive Innovation
How Insurers Can Tame Data to Drive InnovationHow Insurers Can Tame Data to Drive Innovation
How Insurers Can Tame Data to Drive Innovation
 
mediarithmics-avec-pagination.pptx
mediarithmics-avec-pagination.pptxmediarithmics-avec-pagination.pptx
mediarithmics-avec-pagination.pptx
 
The new patterns of innovation
The new patterns of innovationThe new patterns of innovation
The new patterns of innovation
 
Introduction Datalicious Korea
Introduction Datalicious KoreaIntroduction Datalicious Korea
Introduction Datalicious Korea
 
Modernizing Insurance Data to Drive Intelligent Decisions
Modernizing Insurance Data to Drive Intelligent DecisionsModernizing Insurance Data to Drive Intelligent Decisions
Modernizing Insurance Data to Drive Intelligent Decisions
 
infigraph_digitalanalytic_v1.0
infigraph_digitalanalytic_v1.0infigraph_digitalanalytic_v1.0
infigraph_digitalanalytic_v1.0
 
Capitalize On Social Media With Big Data Analytics
Capitalize On Social Media With Big Data AnalyticsCapitalize On Social Media With Big Data Analytics
Capitalize On Social Media With Big Data Analytics
 
The 10 most promising bi and analytics solution providers 2018
The 10 most promising bi and analytics solution providers 2018 The 10 most promising bi and analytics solution providers 2018
The 10 most promising bi and analytics solution providers 2018
 

More from SantosConleyha

11Getting Started with PhoneGapWHAT’S IN THIS CHAPTER
11Getting Started with PhoneGapWHAT’S IN THIS CHAPTER11Getting Started with PhoneGapWHAT’S IN THIS CHAPTER
11Getting Started with PhoneGapWHAT’S IN THIS CHAPTERSantosConleyha
 
11Proposal Part One - Part 1 Influence of Internet on Tourism
11Proposal Part One - Part 1 Influence of Internet on Tourism11Proposal Part One - Part 1 Influence of Internet on Tourism
11Proposal Part One - Part 1 Influence of Internet on TourismSantosConleyha
 
11Social Inclusion of Deaf with Hearing Congre
11Social Inclusion of Deaf with Hearing Congre11Social Inclusion of Deaf with Hearing Congre
11Social Inclusion of Deaf with Hearing CongreSantosConleyha
 
11Managing Economies of Scale in a Supply Chain Cycle Invento
11Managing Economies of Scale in a Supply Chain Cycle Invento11Managing Economies of Scale in a Supply Chain Cycle Invento
11Managing Economies of Scale in a Supply Chain Cycle InventoSantosConleyha
 
11Mental Health Among College StudentsTomia Willin
11Mental Health Among College StudentsTomia Willin11Mental Health Among College StudentsTomia Willin
11Mental Health Among College StudentsTomia WillinSantosConleyha
 
11From Introductions to ConclusionsDrafting an EssayIn this chap
11From Introductions to ConclusionsDrafting an EssayIn this chap11From Introductions to ConclusionsDrafting an EssayIn this chap
11From Introductions to ConclusionsDrafting an EssayIn this chapSantosConleyha
 
11Groupthink John SmithCampbellsville Univ
11Groupthink John SmithCampbellsville Univ11Groupthink John SmithCampbellsville Univ
11Groupthink John SmithCampbellsville UnivSantosConleyha
 
11Sun Coast Remediation Research Objectives, Research Que
11Sun Coast Remediation Research Objectives, Research Que11Sun Coast Remediation Research Objectives, Research Que
11Sun Coast Remediation Research Objectives, Research QueSantosConleyha
 
11Me Talk Pretty One Day # By David Sedaris From his b
11Me Talk Pretty One Day # By David Sedaris From his b11Me Talk Pretty One Day # By David Sedaris From his b
11Me Talk Pretty One Day # By David Sedaris From his bSantosConleyha
 
11Program analysis using different perspectives
11Program analysis using different perspectives11Program analysis using different perspectives
11Program analysis using different perspectivesSantosConleyha
 
11Factors that Affect the Teaching and Learning Process
11Factors that Affect the Teaching and Learning Process11Factors that Affect the Teaching and Learning Process
11Factors that Affect the Teaching and Learning ProcessSantosConleyha
 
11Criminal Justice Racial discriminationStudent’s Nam
11Criminal Justice Racial discriminationStudent’s Nam11Criminal Justice Racial discriminationStudent’s Nam
11Criminal Justice Racial discriminationStudent’s NamSantosConleyha
 
11Communication Plan for Manufacturing PlantStud
11Communication Plan for Manufacturing PlantStud11Communication Plan for Manufacturing PlantStud
11Communication Plan for Manufacturing PlantStudSantosConleyha
 
11CapitalKarl MarxPART I. COMMODITIES AND MONEYCHAPTER I.
11CapitalKarl MarxPART I. COMMODITIES AND MONEYCHAPTER I. 11CapitalKarl MarxPART I. COMMODITIES AND MONEYCHAPTER I.
11CapitalKarl MarxPART I. COMMODITIES AND MONEYCHAPTER I. SantosConleyha
 
11Criminal Justice SystemShambri Chill
11Criminal Justice SystemShambri Chill11Criminal Justice SystemShambri Chill
11Criminal Justice SystemShambri ChillSantosConleyha
 
11American Government and Politics in a Racially Divid
11American Government and Politics in a Racially Divid11American Government and Politics in a Racially Divid
11American Government and Politics in a Racially DividSantosConleyha
 
11Cancer is the uncontrollable growth of abnormal cells
11Cancer is the uncontrollable growth of abnormal cells11Cancer is the uncontrollable growth of abnormal cells
11Cancer is the uncontrollable growth of abnormal cellsSantosConleyha
 
11SENSE MAKING Runze DuChee PiongBUS 700 L
11SENSE MAKING Runze DuChee PiongBUS 700 L11SENSE MAKING Runze DuChee PiongBUS 700 L
11SENSE MAKING Runze DuChee PiongBUS 700 LSantosConleyha
 
119E ECUTIVE BAR AININ CEOS NE OTIATIN THEIR PAWITH EM
119E ECUTIVE BAR AININ  CEOS NE OTIATIN THEIR PAWITH EM119E ECUTIVE BAR AININ  CEOS NE OTIATIN THEIR PAWITH EM
119E ECUTIVE BAR AININ CEOS NE OTIATIN THEIR PAWITH EMSantosConleyha
 
11CALIFORNIA MANAGEMENT REVIEW VOL. 51, NO. 4 SUMMER 2009 C
11CALIFORNIA MANAGEMENT REVIEW  VOL. 51, NO. 4  SUMMER 2009  C11CALIFORNIA MANAGEMENT REVIEW  VOL. 51, NO. 4  SUMMER 2009  C
11CALIFORNIA MANAGEMENT REVIEW VOL. 51, NO. 4 SUMMER 2009 CSantosConleyha
 

More from SantosConleyha (20)

11Getting Started with PhoneGapWHAT’S IN THIS CHAPTER
11Getting Started with PhoneGapWHAT’S IN THIS CHAPTER11Getting Started with PhoneGapWHAT’S IN THIS CHAPTER
11Getting Started with PhoneGapWHAT’S IN THIS CHAPTER
 
11Proposal Part One - Part 1 Influence of Internet on Tourism
11Proposal Part One - Part 1 Influence of Internet on Tourism11Proposal Part One - Part 1 Influence of Internet on Tourism
11Proposal Part One - Part 1 Influence of Internet on Tourism
 
11Social Inclusion of Deaf with Hearing Congre
11Social Inclusion of Deaf with Hearing Congre11Social Inclusion of Deaf with Hearing Congre
11Social Inclusion of Deaf with Hearing Congre
 
11Managing Economies of Scale in a Supply Chain Cycle Invento
11Managing Economies of Scale in a Supply Chain Cycle Invento11Managing Economies of Scale in a Supply Chain Cycle Invento
11Managing Economies of Scale in a Supply Chain Cycle Invento
 
11Mental Health Among College StudentsTomia Willin
11Mental Health Among College StudentsTomia Willin11Mental Health Among College StudentsTomia Willin
11Mental Health Among College StudentsTomia Willin
 
11From Introductions to ConclusionsDrafting an EssayIn this chap
11From Introductions to ConclusionsDrafting an EssayIn this chap11From Introductions to ConclusionsDrafting an EssayIn this chap
11From Introductions to ConclusionsDrafting an EssayIn this chap
 
11Groupthink John SmithCampbellsville Univ
11Groupthink John SmithCampbellsville Univ11Groupthink John SmithCampbellsville Univ
11Groupthink John SmithCampbellsville Univ
 
11Sun Coast Remediation Research Objectives, Research Que
11Sun Coast Remediation Research Objectives, Research Que11Sun Coast Remediation Research Objectives, Research Que
11Sun Coast Remediation Research Objectives, Research Que
 
11Me Talk Pretty One Day # By David Sedaris From his b
11Me Talk Pretty One Day # By David Sedaris From his b11Me Talk Pretty One Day # By David Sedaris From his b
11Me Talk Pretty One Day # By David Sedaris From his b
 
11Program analysis using different perspectives
11Program analysis using different perspectives11Program analysis using different perspectives
11Program analysis using different perspectives
 
11Factors that Affect the Teaching and Learning Process
11Factors that Affect the Teaching and Learning Process11Factors that Affect the Teaching and Learning Process
11Factors that Affect the Teaching and Learning Process
 
11Criminal Justice Racial discriminationStudent’s Nam
11Criminal Justice Racial discriminationStudent’s Nam11Criminal Justice Racial discriminationStudent’s Nam
11Criminal Justice Racial discriminationStudent’s Nam
 
11Communication Plan for Manufacturing PlantStud
11Communication Plan for Manufacturing PlantStud11Communication Plan for Manufacturing PlantStud
11Communication Plan for Manufacturing PlantStud
 
11CapitalKarl MarxPART I. COMMODITIES AND MONEYCHAPTER I.
11CapitalKarl MarxPART I. COMMODITIES AND MONEYCHAPTER I. 11CapitalKarl MarxPART I. COMMODITIES AND MONEYCHAPTER I.
11CapitalKarl MarxPART I. COMMODITIES AND MONEYCHAPTER I.
 
11Criminal Justice SystemShambri Chill
11Criminal Justice SystemShambri Chill11Criminal Justice SystemShambri Chill
11Criminal Justice SystemShambri Chill
 
11American Government and Politics in a Racially Divid
11American Government and Politics in a Racially Divid11American Government and Politics in a Racially Divid
11American Government and Politics in a Racially Divid
 
11Cancer is the uncontrollable growth of abnormal cells
11Cancer is the uncontrollable growth of abnormal cells11Cancer is the uncontrollable growth of abnormal cells
11Cancer is the uncontrollable growth of abnormal cells
 
11SENSE MAKING Runze DuChee PiongBUS 700 L
11SENSE MAKING Runze DuChee PiongBUS 700 L11SENSE MAKING Runze DuChee PiongBUS 700 L
11SENSE MAKING Runze DuChee PiongBUS 700 L
 
119E ECUTIVE BAR AININ CEOS NE OTIATIN THEIR PAWITH EM
119E ECUTIVE BAR AININ  CEOS NE OTIATIN THEIR PAWITH EM119E ECUTIVE BAR AININ  CEOS NE OTIATIN THEIR PAWITH EM
119E ECUTIVE BAR AININ CEOS NE OTIATIN THEIR PAWITH EM
 
11CALIFORNIA MANAGEMENT REVIEW VOL. 51, NO. 4 SUMMER 2009 C
11CALIFORNIA MANAGEMENT REVIEW  VOL. 51, NO. 4  SUMMER 2009  C11CALIFORNIA MANAGEMENT REVIEW  VOL. 51, NO. 4  SUMMER 2009  C
11CALIFORNIA MANAGEMENT REVIEW VOL. 51, NO. 4 SUMMER 2009 C
 

Recently uploaded

SOCIAL AND HISTORICAL CONTEXT - LFTVD.pptx
SOCIAL AND HISTORICAL CONTEXT - LFTVD.pptxSOCIAL AND HISTORICAL CONTEXT - LFTVD.pptx
SOCIAL AND HISTORICAL CONTEXT - LFTVD.pptxiammrhaywood
 
microwave assisted reaction. General introduction
microwave assisted reaction. General introductionmicrowave assisted reaction. General introduction
microwave assisted reaction. General introductionMaksud Ahmed
 
The Most Excellent Way | 1 Corinthians 13
The Most Excellent Way | 1 Corinthians 13The Most Excellent Way | 1 Corinthians 13
The Most Excellent Way | 1 Corinthians 13Steve Thomason
 
Paris 2024 Olympic Geographies - an activity
Paris 2024 Olympic Geographies - an activityParis 2024 Olympic Geographies - an activity
Paris 2024 Olympic Geographies - an activityGeoBlogs
 
Contemporary philippine arts from the regions_PPT_Module_12 [Autosaved] (1).pptx
Contemporary philippine arts from the regions_PPT_Module_12 [Autosaved] (1).pptxContemporary philippine arts from the regions_PPT_Module_12 [Autosaved] (1).pptx
Contemporary philippine arts from the regions_PPT_Module_12 [Autosaved] (1).pptxRoyAbrique
 
mini mental status format.docx
mini    mental       status     format.docxmini    mental       status     format.docx
mini mental status format.docxPoojaSen20
 
Solving Puzzles Benefits Everyone (English).pptx
Solving Puzzles Benefits Everyone (English).pptxSolving Puzzles Benefits Everyone (English).pptx
Solving Puzzles Benefits Everyone (English).pptxOH TEIK BIN
 
How to Make a Pirate ship Primary Education.pptx
How to Make a Pirate ship Primary Education.pptxHow to Make a Pirate ship Primary Education.pptx
How to Make a Pirate ship Primary Education.pptxmanuelaromero2013
 
Organic Name Reactions for the students and aspirants of Chemistry12th.pptx
Organic Name Reactions  for the students and aspirants of Chemistry12th.pptxOrganic Name Reactions  for the students and aspirants of Chemistry12th.pptx
Organic Name Reactions for the students and aspirants of Chemistry12th.pptxVS Mahajan Coaching Centre
 
Kisan Call Centre - To harness potential of ICT in Agriculture by answer farm...
Kisan Call Centre - To harness potential of ICT in Agriculture by answer farm...Kisan Call Centre - To harness potential of ICT in Agriculture by answer farm...
Kisan Call Centre - To harness potential of ICT in Agriculture by answer farm...Krashi Coaching
 
Incoming and Outgoing Shipments in 1 STEP Using Odoo 17
Incoming and Outgoing Shipments in 1 STEP Using Odoo 17Incoming and Outgoing Shipments in 1 STEP Using Odoo 17
Incoming and Outgoing Shipments in 1 STEP Using Odoo 17Celine George
 
Separation of Lanthanides/ Lanthanides and Actinides
Separation of Lanthanides/ Lanthanides and ActinidesSeparation of Lanthanides/ Lanthanides and Actinides
Separation of Lanthanides/ Lanthanides and ActinidesFatimaKhan178732
 
Presentation by Andreas Schleicher Tackling the School Absenteeism Crisis 30 ...
Presentation by Andreas Schleicher Tackling the School Absenteeism Crisis 30 ...Presentation by Andreas Schleicher Tackling the School Absenteeism Crisis 30 ...
Presentation by Andreas Schleicher Tackling the School Absenteeism Crisis 30 ...EduSkills OECD
 
18-04-UA_REPORT_MEDIALITERAСY_INDEX-DM_23-1-final-eng.pdf
18-04-UA_REPORT_MEDIALITERAСY_INDEX-DM_23-1-final-eng.pdf18-04-UA_REPORT_MEDIALITERAСY_INDEX-DM_23-1-final-eng.pdf
18-04-UA_REPORT_MEDIALITERAСY_INDEX-DM_23-1-final-eng.pdfssuser54595a
 
Mastering the Unannounced Regulatory Inspection
Mastering the Unannounced Regulatory InspectionMastering the Unannounced Regulatory Inspection
Mastering the Unannounced Regulatory InspectionSafetyChain Software
 
Grant Readiness 101 TechSoup and Remy Consulting
Grant Readiness 101 TechSoup and Remy ConsultingGrant Readiness 101 TechSoup and Remy Consulting
Grant Readiness 101 TechSoup and Remy ConsultingTechSoup
 
Presiding Officer Training module 2024 lok sabha elections
Presiding Officer Training module 2024 lok sabha electionsPresiding Officer Training module 2024 lok sabha elections
Presiding Officer Training module 2024 lok sabha electionsanshu789521
 

Recently uploaded (20)

SOCIAL AND HISTORICAL CONTEXT - LFTVD.pptx
SOCIAL AND HISTORICAL CONTEXT - LFTVD.pptxSOCIAL AND HISTORICAL CONTEXT - LFTVD.pptx
SOCIAL AND HISTORICAL CONTEXT - LFTVD.pptx
 
microwave assisted reaction. General introduction
microwave assisted reaction. General introductionmicrowave assisted reaction. General introduction
microwave assisted reaction. General introduction
 
Staff of Color (SOC) Retention Efforts DDSD
Staff of Color (SOC) Retention Efforts DDSDStaff of Color (SOC) Retention Efforts DDSD
Staff of Color (SOC) Retention Efforts DDSD
 
The Most Excellent Way | 1 Corinthians 13
The Most Excellent Way | 1 Corinthians 13The Most Excellent Way | 1 Corinthians 13
The Most Excellent Way | 1 Corinthians 13
 
Model Call Girl in Tilak Nagar Delhi reach out to us at 🔝9953056974🔝
Model Call Girl in Tilak Nagar Delhi reach out to us at 🔝9953056974🔝Model Call Girl in Tilak Nagar Delhi reach out to us at 🔝9953056974🔝
Model Call Girl in Tilak Nagar Delhi reach out to us at 🔝9953056974🔝
 
Paris 2024 Olympic Geographies - an activity
Paris 2024 Olympic Geographies - an activityParis 2024 Olympic Geographies - an activity
Paris 2024 Olympic Geographies - an activity
 
Contemporary philippine arts from the regions_PPT_Module_12 [Autosaved] (1).pptx
Contemporary philippine arts from the regions_PPT_Module_12 [Autosaved] (1).pptxContemporary philippine arts from the regions_PPT_Module_12 [Autosaved] (1).pptx
Contemporary philippine arts from the regions_PPT_Module_12 [Autosaved] (1).pptx
 
mini mental status format.docx
mini    mental       status     format.docxmini    mental       status     format.docx
mini mental status format.docx
 
Solving Puzzles Benefits Everyone (English).pptx
Solving Puzzles Benefits Everyone (English).pptxSolving Puzzles Benefits Everyone (English).pptx
Solving Puzzles Benefits Everyone (English).pptx
 
How to Make a Pirate ship Primary Education.pptx
How to Make a Pirate ship Primary Education.pptxHow to Make a Pirate ship Primary Education.pptx
How to Make a Pirate ship Primary Education.pptx
 
Organic Name Reactions for the students and aspirants of Chemistry12th.pptx
Organic Name Reactions  for the students and aspirants of Chemistry12th.pptxOrganic Name Reactions  for the students and aspirants of Chemistry12th.pptx
Organic Name Reactions for the students and aspirants of Chemistry12th.pptx
 
Kisan Call Centre - To harness potential of ICT in Agriculture by answer farm...
Kisan Call Centre - To harness potential of ICT in Agriculture by answer farm...Kisan Call Centre - To harness potential of ICT in Agriculture by answer farm...
Kisan Call Centre - To harness potential of ICT in Agriculture by answer farm...
 
Código Creativo y Arte de Software | Unidad 1
Código Creativo y Arte de Software | Unidad 1Código Creativo y Arte de Software | Unidad 1
Código Creativo y Arte de Software | Unidad 1
 
Incoming and Outgoing Shipments in 1 STEP Using Odoo 17
Incoming and Outgoing Shipments in 1 STEP Using Odoo 17Incoming and Outgoing Shipments in 1 STEP Using Odoo 17
Incoming and Outgoing Shipments in 1 STEP Using Odoo 17
 
Separation of Lanthanides/ Lanthanides and Actinides
Separation of Lanthanides/ Lanthanides and ActinidesSeparation of Lanthanides/ Lanthanides and Actinides
Separation of Lanthanides/ Lanthanides and Actinides
 
Presentation by Andreas Schleicher Tackling the School Absenteeism Crisis 30 ...
Presentation by Andreas Schleicher Tackling the School Absenteeism Crisis 30 ...Presentation by Andreas Schleicher Tackling the School Absenteeism Crisis 30 ...
Presentation by Andreas Schleicher Tackling the School Absenteeism Crisis 30 ...
 
18-04-UA_REPORT_MEDIALITERAСY_INDEX-DM_23-1-final-eng.pdf
18-04-UA_REPORT_MEDIALITERAСY_INDEX-DM_23-1-final-eng.pdf18-04-UA_REPORT_MEDIALITERAСY_INDEX-DM_23-1-final-eng.pdf
18-04-UA_REPORT_MEDIALITERAСY_INDEX-DM_23-1-final-eng.pdf
 
Mastering the Unannounced Regulatory Inspection
Mastering the Unannounced Regulatory InspectionMastering the Unannounced Regulatory Inspection
Mastering the Unannounced Regulatory Inspection
 
Grant Readiness 101 TechSoup and Remy Consulting
Grant Readiness 101 TechSoup and Remy ConsultingGrant Readiness 101 TechSoup and Remy Consulting
Grant Readiness 101 TechSoup and Remy Consulting
 
Presiding Officer Training module 2024 lok sabha elections
Presiding Officer Training module 2024 lok sabha electionsPresiding Officer Training module 2024 lok sabha elections
Presiding Officer Training module 2024 lok sabha elections
 

117LEARNING OBJECTIVESNature of Data, Statistical Mo

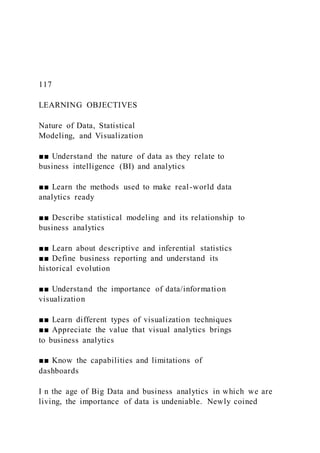
  • 1. 117 LEARNING OBJECTIVES Nature of Data, Statistical Modeling, and Visualization ■■ Understand the nature of data as they relate to business intelligence (BI) and analytics ■■ Learn the methods used to make real-world data analytics ready ■■ Describe statistical modeling and its relationship to business analytics ■■ Learn about descriptive and inferential statistics ■■ Define business reporting and understand its historical evolution ■■ Understand the importance of data/information visualization ■■ Learn different types of visualization techniques ■■ Appreciate the value that visual analytics brings to business analytics ■■ Know the capabilities and limitations of dashboards I n the age of Big Data and business analytics in which we are living, the importance of data is undeniable. Newly coined
  • 2. phrases such as “data are the oil,” “data are the new bacon,” “data are the new currency,” and “data are the king” are further stress- ing the renewed importance of data. But the type of data we are talking about is obvi- ously not just any data. The “garbage in garbage out—GIGO” concept/principle applies to today’s Big Data phenomenon more so than any data definition that we have had in the past. To live up to their promise, value proposition, and ability to turn into insight, data have to be carefully created/identified, collected, integrated, cleaned, transformed, and properly contextualized for use in accurate and timely decision making. Data are the main theme of this chapter. Accordingly, the chapter starts with a de- scription of the nature of data: what they are, what different types and forms they can come in, and how they can be preprocessed and made ready for analytics. The first few sections of the chapter are dedicated to a deep yet necessary understanding and process- ing of data. The next few sections describe the statistical methods used to prepare data as input to produce both descriptive and inferential measures. Following the statistics sections are sections on reporting and visualization. A report is a communication artifact 3 C H A P T E R
  • 3. 118 Part I • Introduction to Analytics and AI prepared with the specific intention of converting data into information and knowledge and relaying that information in an easily understandable/digestible format. Today, these reports are visually oriented, often using colors and graphical icons that collectively look like a dashboard to enhance the information content. Therefore, the latter part of the chapter is dedicated to subsections that present the design, implementation, and best practices regarding information visualization, storytelling, and information dashboards. This chapter has the following sections: 3.1 Opening Vignette: SiriusXM Attracts and Engages a New Generation of Radio Consumers with Data-Driven Marketing 118 3.2 Nature of Data 121 3.3 Simple Taxonomy of Data 125 3.4 Art and Science of Data Preprocessing 129 3.5 Statistical Modeling for Business Analytics 139 3.6 Regression Modeling for Inferential Statistics 151 3.7 Business Reporting 163 3.8 Data Visualization 166 3.9 Different Types of Charts and Graphs 171 3.10 Emergence of Visual Analytics 176 3.11 Information Dashboards 182 3.1 OPENING VIGNETTE: SiriusXM Attracts and Engages a New Generation of Radio Consumers with Data-Driven Marketing
  • 4. SiriusXM Radio is a satellite radio powerhouse, the largest radio company in the world with $3.8 billion in annual revenues and a wide range of hugely popular music, sports, news, talk, and entertainment stations. The company, which began broadcasting in 2001 with 50,000 subscribers, had 18.8 million subscribers in 2009, and today has nearly 29 million. Much of SiriusXM’s growth to date is rooted in creative arrangements with automo- bile manufacturers; today, nearly 70 percent of new cars are SiriusXM enabled. Yet the company’s reach extends far beyond car radios in the United States to a worldwide pres- ence on the Internet, on smartphones, and through other services and distribution chan- nels, including SONOS, JetBlue, and Dish. BUSINESS CHALLENGE Despite these remarkable successes, changes in customer demographics, technology, and a competitive landscape over the past few years have posed a new series of business challenges and opportunities for SiriusXM. Here are some notable ones: • As its market penetration among new cars increased, the demographics of its buy- ers changed, skewing toward younger people with less discretionary income. How could SiriusXM reach this new demographic?
  • 5. • As new cars become used cars and change hands, how could SiriusXM identify, engage, and convert second owners to paying customers? • With its acquisition of the connected vehicle business from Agero—the leading pro- vider of telematics in the U.S. car market—SiriusXM gained the ability to deliver its service via satellite and wireless networks. How could it successfully use this acqui- sition to capture new revenue streams? Chapter 3 • Nature of Data, Statistical Modeling, and Visualization 119 PROPOSED SOLUTION: SHIFTING THE VISION TOWARD DATA-DRIVEN MARKETING SiriusXM recognized that to address these challenges, it would need to become a high- performance, data-driven marketing organization. The company began making that shift by establishing three fundamental tenets. First, personalized interactions—not mass marketing—would rule the day. The company quickly understood that to conduct more personalized marketing, it would have to draw on past history and interactions as well as on a keen understanding of the consumer’s place in the subscription life cycle. Second, to gain that understanding, information technology (IT) and its external tech- nology partners would need the ability to deliver integrated
  • 6. data, advanced analytics, integrated marketing platforms, and multichannel delivery systems. And third, the company could not achieve its business goals without an integrated and consistent point of view across the company. Most important, the technology and business sides of SiriusXM would have to become true partners to best address the chal- lenges involved in becoming a high-performance marketing organization that draws on data-driven insights to speak directly with consumers in strikingly relevant ways. Those data-driven insights, for example, would enable the company to differentiate between consumers, owners, drivers, listeners, and account holders. The insights would help SiriusXM to understand what other vehicles and services are part of each household and cre- ate new opportunities for engagement. In addition, by constructing a coherent and reliable 360-degree view of all its consumers, SiriusXM could ensure that all messaging in all cam- paigns and interactions would be tailored, relevant, and consistent across all channels. The important bonus is that a more tailored and effective marketing is typically more cost-efficient. IMPLEMENTATION: CREATING AND FOLLOWING THE PATH TO HIGH-PERFORMANCE MARKETING At the time of its decision to become a high-performance marketing company, SiriusXM
  • 7. was working with a third-party marketing platform that did not have the capacity to support SiriusXM’s ambitions. The company then made an important, forward-thinking decision to bring its marketing capabilities in-house—and then carefully plotted what it would need to do to make the transition successfully. 1. Improve data cleanliness through improved master data management and governance. Although the company was understandably impatient to put ideas into action, data hygiene was a necessary first step to create a reliable window into consumer behavior. 2. Bring marketing analytics in-house and expand the data warehouse to enable scale and fully support integrated marketing analytics. 3. Develop new segmentation and scoring models to run in databases, eliminating la- tency and data duplication. 4. Extend the integrated data warehouse to include marketing data and scoring, lever- aging in-database analytics. 5. Adopt a marketing platform for campaign development. 6. Bring all of its capability together to deliver real-time offer management across all marketing channels: call center, mobile, Web, and in-app. Completing those steps meant finding the right technology partner. SiriusXM chose Teradata because its strengths were a powerful match for the
  • 8. project and company. Teradata offered the ability to: • Consolidate data sources with an integrated data warehouse (IDW), advanced ana- lytics, and powerful marketing applications. • Solve data-latency issues. 120 Part I • Introduction to Analytics and AI • Significantly reduce data movement across multiple databases and applications. • Seamlessly interact with applications and modules for all marketing areas. • Scale and perform at very high levels for running campaigns and analytics in-database. • Conduct real-time communications with customers. • Provide operational support, either via the cloud or on premise. This partnership has enabled SiriusXM to move smoothly and swiftly along its road map, and the company is now in the midst of a transformational, five-year process. After establishing its strong data governance process, SiriusXM began by implementing its IDW, which allowed the company to quickly and reliably operationalize insights through- out the organization. Next, the company implemented Customer Interaction Manager—part of the Teradata Integrated Marketing Cloud, which enables real-time, dialog-
  • 9. based customer interaction across the full spectrum of digital and traditional communication channels. SiriusXM also will incorporate the Teradata Digital Messaging Center. Together, the suite of capabilities allows SiriusXM to handle direct communications across multiple channels. This evolution will enable real -time offers, marketing messages, and recommendations based on previous behavior. In addition to streamlining the way it executes and optimizes outbound marketing activities, SiriusXM is also taking control of its internal marketing operations with the implementation of Marketing Resource Management, also part of the Teradata Integrated Marketing Cloud. The solution will allow SiriusXM to streamline workflow, optimize mar- keting resources, and drive efficiency through every penny of its marketing budget. RESULTS: REAPING THE BENEFITS As SiriusXM continues its evolution into a high-performance marketing organization, it already is benefiting from its thoughtfully executed strategy. Household-level consumer insights and a complete view of marketing touch strategy with each consumer enable SiriusXM to create more targeted offers at the household, consumer, and device levels. By bringing the data and marketing analytics capabilities in-house, SiriusXM achieved the following: • Campaign results in near real time rather than four days,
  • 10. resulting in massive reduc- tions in cycle times for campaigns and the analysts who support them. • Closed-loop visibility, allowing the analysts to support multistage dialogs and in-campaign modifications to increase campaign effectiveness. • Real-time modeling and scoring to increase marketing intelligence and sharpen cam- paign offers and responses at the speed of their business. Finally, SiriusXM’s experience has reinforced the idea that high-performance market- ing is a constantly evolving concept. The company has implemented both processes and the technology that give it the capacity for continued and flexible growth. u QUESTIONS FOR THE OPENING VIGNETTE 1. What does SiriusXM do? In what type of market does it conduct its business? 2. What were its challenges? Comment on both technology and data-related challenges. 3. What were the proposed solutions? 4. How did the company implement the proposed solutions? Did it face any implementation challenges? 5. What were the results and benefits? Were they worth the effort/investment?
  • 11. 6. Can you think of other companies facing similar challenges that can potentially benefit from similar data-driven marketing solutions? Chapter 3 • Nature of Data, Statistical Modeling, and Visualization 121 WHAT WE CAN LEARN FROM THIS VIGNETTE Striving to thrive in a fast-changing competitive industry, SiriusXM realized the need for a new and improved marketing infrastructure (one that relies on data and analytics) to effectively communicate its value proposition to its existing and potential custom- ers. As is the case in any industry, success or mere survival in entertainment depends on intelligently sensing the changing trends (likes and dislikes) and putting together the right messages and policies to win new customers while retaining the existing ones. The key is to create and manage successful marketing campaigns that resonate with the target population of customers and have a close feedback loop to adjust and modify the message to optimize the outcome. At the end, it was all about the preci- sion in the way that SiriusXM conducted business: being proactive about the changing nature of the clientele and creating and transmitting the right products and services in a timely manner using a fact-based/data-driven holistic marketing strategy. Source
  • 12. identification, source creation, access and collection, integration, cleaning, transforma- tion, storage, and processing of relevant data played a critical role in SiriusXM’s suc- cess in designing and implementing a marketing analytics strategy as is the case in any analytically savvy successful company today, regardless of the industry in which they are participating. Sources: C. Quinn, “Data-Driven Marketing at SiriusXM,” Teradata Articles & News, 2016. http://bigdata. teradata.com/US/Articles-News/Data-Driven-Marketing-At- SiriusXM/ (accessed August 2016); “SiriusXM Attracts and Engages a New Generation of Radio Consumers.” http://assets.teradata.com/resourceCenter/ downloads/CaseStudies/EB8597.pdf?processed=1. 3.2 NATURE OF DATA Data are the main ingredient for any BI, data science, and business analytics initiative. In fact, they can be viewed as the raw material for what popular decision technolo- gies produce—information, insight, and knowledge. Without data, none of these tech- nologies could exist and be popularized—although traditionally we have built analytics models using expert knowledge and experience coupled with very little or no data at all; however, those were the old days, and now data are of the essence. Once perceived as a big challenge to collect, store, and manage, data today are widely considered among the most valuable assets of an organization with the potential to create invaluable insight to
  • 13. better understand customers, competitors, and the business processes. Data can be small or very large. They can be structured (nicely organized for computers to process), or they can be unstructured (e.g., text that is created for humans and hence not readily understandable/consumable by computers). Data can come in small batches continuously or can pour in all at once as a large batch. These are some of the characteristics that define the inherent nature of today’s data, which we often call Big Data. Even though these characteristics of data make them more challenging to process and consume, they also make the data more valuable because the character- istics enrich them beyond their conventional limits, allowing for the discovery of new and novel knowledge. Traditional ways to manually collect data (via either surveys or human-entered business transactions) mostly left their places to modern-day data collection mechanisms that use Internet and/or sensor/radio frequency identification (RFID)–based computerized networks. These automated data collection systems are not only enabling us to collect more volumes of data but also enhancing the data quality and integrity. Figure 3.1 illustrates a typical analytics continuum—data to analytics to actionable information. http://bigdata.teradata.com/US/Articles-News/Data-Driven- Marketing-At-SiriusXM http://bigdata.teradata.com/US/Articles-News/Data-Driven-
  • 14. Marketing-At-SiriusXM http://assets.teradata.com/resourceCenter/downloads/CaseStudie s/EB8597.pdf?processed=1 http://assets.teradata.com/resourceCenter/downloads/CaseStudie s/EB8597.pdf?processed=1 122 Part I • Introduction to Analytics and AI Although their value proposition is undeniable, to live up their promise, data must comply with some basic usability and quality metrics. Not all data are useful for all tasks, obviously. That is, data must match with (have the coverage of the specifics for) the task for which they are intended to be used. Even for a specific task, the relevant data on hand need to comply with the quality and quantity requirements. Essentially, data have to be analytics ready. So what does it mean to make data analytics ready? In addition to its relevancy to the problem at hand and the quality/quantity requirements, it also has to have a certain structure in place with key fields/variables with properly normalized val- ues. Furthermore, there must be an organization-wide agreed-on definition for common variables and subject matters (sometimes also called master data management), such as how to define a customer (what characteristics of customers are used to produce a holis- tic enough representation to analytics) and where in the business process the customer- related information is captured, validated, stored, and updated. Sometimes the representation of the data depends on the type of
  • 15. analytics being employed. Predictive algorithms generally require a flat file with a target variable, so mak- ing data analytics ready for prediction means that data sets must be transformed into a flat-file format and made ready for ingestion into those predictive algorithms. It is also imperative to match the data to the needs and wants of a specific predictive algorithm and/or a software tool. For instance, neural network algorithms require all input variables UOB 1.0 X UOB 2.2 UOB 2.1 UOB 3.0 ERP CRM SCM Business Process Facebook Google+ Linked In
  • 16. YouTube Twitter Tumblr Flicker Instagram Pinterest Snapchat Reddit Foursquare Internet/Social Media Machines/Internet of Things Data Storage Analytics Data Protection Cloud Storage and Computing Pa tte rn s Trends Knowledge
  • 17. Applications End Users Validate Built Test X FIGURE 3.1 A Data to Knowledge Continuum. Chapter 3 • Nature of Data, Statistical Modeling, and Visualization 123 to be numerically represented (even the nominal variables need to be converted into pseudo binary numeric variables), whereas decision tree algorithms do not require such numerical transformation—they can easily and natively handle a mix of nominal and nu- meric variables. Analytics projects that overlook data-related tasks (some of the most critical steps) often end up with the wrong answer for the right problem, and these unintentionally cre- ated, seemingly good answers could lead to inaccurate and untimely decisions. Following are some of the characteristics (metrics) that define the readiness level of data for an ana-
  • 18. lytics study (Delen, 2015; Kock, McQueen, & Corner, 1997). • Data source reliability. This term refers to the originality and appropriateness of the storage medium where the data are obtained—answering the question of “Do we have the right confidence and belief in this data source?” If at all possible, one should always look for the original source/creator of the data to eliminate/mitigate the possibilities of data misrepresentation and data transformation caused by the mishandling of the data as they moved from the source to destination through one or more steps and stops along the way. Every move of the data creates a chance to unintentionally drop or reformat data items, which limits the integrity and perhaps true accuracy of the data set. • Data content accuracy. This means that data are correct and are a good match for the analytics problem—answering the question of “Do we have the right data for the job?” The data should represent what was intended or defined by the original source of the data. For example, the customer’s contact information recorded within a database should be the same as what the customer said it was. Data accuracy will be covered in more detail in the following subsection. • Data accessibility. This term means that the data are easily and readily obtainable— answering the question of “Can we easily get to the data when we need to?” Access to
  • 19. data can be tricky, especially if they are stored in more than one location and storage medium and need to be merged/transformed while accessing and obtaining them. As the traditional relational database management systems leave their place (or coexist with a new generation of data storage mediums such as data lakes and Hadoop infra- structure), the importance/criticality of data accessibility is also increasing. • Data security and data privacy. Data security means that the data are secured to allow only those people who have the authority and the need to access them and to prevent anyone else from reaching them. Increasing popularity in educational degrees and certificate programs for Information Assurance is evidence of the criti- cality and the increasing urgency of this data quality metric. Any organization that maintains health records for individual patients must have systems in place that not only safeguard the data from unauthorized access (which is mandated by federal laws such as the Health Insurance Portability and Accountability Act [HIPAA]) but also accurately identify each patient to allow proper and timely access to records by authorized users (Annas, 2003). • Data richness. This means that all required data elements are included in the data set. In essence, richness (or comprehensiveness) means that the available variables portray a rich enough dimensionality of the underlying subject
  • 20. matter for an accurate and worthy analytics study. It also means that the information content is complete (or near complete) to build a predictive and/or prescriptive analytics model. • Data consistency. This means that the data are accurately collected and com- bined/merged. Consistent data represent the dimensional information (variables of interest) coming from potentially disparate sources but pertaining to the same sub- ject. If the data integration/merging is not done properly, some of the variables of different subjects could appear in the same record—having two different patient 124 Part I • Introduction to Analytics and AI records mixed up; for instance, this could happen while merging the demographic and clinical test result data records. • Data currency/data timeliness. This means that the data should be up-to-date (or as recent/new as they need to be) for a given analytics model. It also means that the data are recorded at or near the time of the event or observation so that the time delay–related misrepresentation (incorrectly remembering and encoding) of the data is prevented. Because accurate analytics relies on accurate and timely data, an essential characteristic of analytics-ready data is the
  • 21. timeliness of the creation and access to data elements. • Data granularity. This requires that the variables and data values be defined at the lowest (or as low as required) level of detail for the intended use of the data. If the data are aggregated, they might not contain the level of detail needed for an analytics algorithm to learn how to discern different records/cases from one another. For example, in a medical setting, numerical values for laboratory results should be recorded to the appropriate decimal place as required for the meaning- ful interpretation of test results and proper use of those values within an analytics algorithm. Similarly, in the collection of demographic data, data elements should be defined at a granular level to determine the differences in outcomes of care among various subpopulations. One thing to remember is that the data that are aggregated cannot be disaggregated (without access to the original source), but they can easily be aggregated from its granular representation. • Data validity. This is the term used to describe a match/mismatch between the actual and expected data values of a given variable. As part of data definition, the acceptable values or value ranges for each data element must be defined. For example, a valid data definition related to gender would include three values: male, female, and unknown.
  • 22. • Data relevancy. This means that the variables in the data set are all relevant to the study being conducted. Relevancy is not a dichotomous measure (whether a variable is relevant or not); rather, it has a spectrum of relevancy from least relevant to most relevant. Based on the analytics algorithms being used, one can choose to include only the most relevant information (i.e., variables) or, if the algorithm is capable enough to sort them out, can choose to include all the relevant ones regard- less of their levels. One thing that analytics studies should avoid is including totally irrelevant data into the model building because this could contaminate the informa- tion for the algorithm, resulting in inaccurate and misleading results. The above-listed characteristics are perhaps the most prevailing metrics to keep up with; the true data quality and excellent analytics readiness for a specific application do- main would require different levels of emphasis to be placed on these metric dimensions and perhaps add more specific ones to this collection. The following section will delve into the nature of data from a taxonomical perspective to list and define different data types as they relate to different analytics projects. u SECTION 3.2 REVIEW QUESTIONS 1. How do you describe the importance of data in analyti cs? Can we think of analytics
  • 23. without data? 2. Considering the new and broad definition of business analytics, what are the main inputs and outputs to the analytics continuum? 3. Where do the data for business analytics come from? 4. In your opinion, what are the top three data-related challenges for better analytics? 5. What are the most common metrics that make for analytics- ready data? Chapter 3 • Nature of Data, Statistical Modeling, and Visualization 125 3.3 SIMPLE TAXONOMY OF DATA The term data (datum in singular form) refers to a collection of facts usually obtained as the result of experiments, observations, transactions, or experiences. Data can consist of numbers, letters, words, images, voice recordings, and so on, as measurements of a set of variables (characteristics of the subject or event that we are interested in studying). Data are often viewed as the lowest level of abstraction from which information and then knowledge is derived. At the highest level of abstraction, one can classify data as structured and unstruc- tured (or semistructured). Unstructured data/semistructured data are composed of any combination of textual, imagery, voice, and Web content.
  • 24. Unstructured/semistruc- tured data will be covered in more detail in the text mining and Web mining chapter. Structured data are what data mining algorithms use and can be classified as categori- cal or numeric. The categorical data can be subdivided into nominal or ordinal data, whereas numeric data can be subdivided into intervals or ratios. Figure 3.2 shows a simple data taxonomy. • Categorical data. These represent the labels of multiple classes used to divide a variable into specific groups. Examples of categorical variables include race, sex, age group, and educational level. Although the latter two variables can also be considered in a numerical manner by using exact values for age and highest grade completed, for example, it is often more informative to categorize such variables into a relatively small number of ordered classes. The categorical data can also be called discrete data, implying that they represent a finite number of values with no continuum between them. Even if the values used for the categorical (or discrete) variables are numeric, these numbers are nothing more than symbols and do not imply the possibility of calculating fractional values. • Nominal data. These contain measurements of simple codes assigned to objects as labels, which are not measurements. For example, the variable marital status can be generally categorized as (1) single, (2) married, and (3)
  • 25. divorced. Nominal Data in Analytics Structured Data Unstructured or Semi-Structured Data Nominal Ordinal Textual Multimedia XML/JSON Categorical Numerical Interval Ratio Image Audio Video FIGURE 3.2 A Simple Taxonomy of Data. 126 Part I • Introduction to Analytics and AI data can be represented with binomial values having two possible values (e.g.,
  • 26. yes/no, true/false, good/bad) or multinomial values having three or more pos- sible values (e.g., brown/green/blue, white/black/Latino/Asian, single/married/ divorced). • Ordinal data. These contain codes assigned to objects or events as labels that also represent the rank order among them. For example, the variable credit score can be generally categorized as (1) low, (2) medium, or (3) high. Similar ordered relationships can be seen in variables such as age group (i.e., child, young, middle-aged, elderly) and educational level (i.e., high school, college, graduate school). Some predictive analytic algorithms, such as ordinal multiple logistic regression, take into account this additional rank-order information to build a better classification model. • Numeric data. These represent the numeric values of specific variables. Examples of numerically valued variables include age, number of children, total household income (in U.S. dollars), travel distance (in miles), and temperature (in Fahrenheit degrees). Numeric values representing a variable can be integers (only whole numbers) or real (also fractional numbers). The numeric data can also be called continuous data, implying that the variable contains continuous measures on a specific scale that allows insertion of interim values. Unlike a discrete vari-
  • 27. able, which represents finite, countable data, a continuous variable represents scal- able measurements, and it is possible for the data to contain an infinite number of fractional values. • Interval data. These are variables that can be measured on interval scales. A common example of interval scale measurement is temperature on the Celsius scale. In this particular scale, the unit of measurement is 1/100 of the difference between the melting temperature and the boiling temperature of water in atmospheric pres- sure; that is, there is not an absolute zero value. • Ratio data. These include measurement variables commonly found in the physical sciences and engineering. Mass, length, time, plane angle, energy, and electric charge are examples of physical measures that are ratio scales. The scale type takes its name from the fact that measurement is the estimation of the ratio between a magnitude of a continuous quantity and a unit magnitude of the same kind. Informally, the dis- tinguishing feature of a ratio scale is the possession of a nonarbitrary zero value. For example, the Kelvin temperature scale has a nonarbitrary zero point of absolute zero, which is equal to –273.15 degrees Celsius. This zero point is nonarbitrary because the particles that comprise matter at this temperature have zero kinetic energy. Other data types, including textual, spatial, imagery, video, and
  • 28. voice, need to be converted into some form of categorical or numeric representation before they can be pro- cessed by analytics methods (data mining algorithms; Delen, 2015). Data can also be classi- fied as static or dynamic (i.e., temporal or time series). Some predictive analytics (i.e., data mining) methods and machine-learning algorithms are very selective about the type of data that they can handle. Providing them with incompatible data types can lead to incorrect models or (more often) halt the model development process. For example, some data mining methods need all the variables (both input and output) represented as numerically valued variables (e.g., neural net- works, support vector machines, logistic regression). The nominal or ordinal variables are converted into numeric representations using some type of 1-of- N pseudo variables (e.g., a categorical variable with three unique values can be transformed into three pseudo variables with binary values—1 or 0). Because this process could increase the number of variables, one should be cautious about the effect of such representations, especially for the categorical variables that have large numbers of unique values. Chapter 3 • Nature of Data, Statistical Modeling, and Visualization 127 Similarly, some predictive analytics methods, such as ID3 (a
  • 29. classic decision tree algorithm) and rough sets (a relatively new rule induction algorithm), need all the vari- ables represented as categorically valued variables. Early versions of these methods re- quired the user to discretize numeric variables into categorical representations before they could be processed by the algorithm. The good news is that most implementa- tions of these algorithms in widely available software tools accept a mix of numeric and nominal variables and internally make the necessary conversions before process- ing the data. Data come in many different variable types and representation schemas. Business analytics tools are continuously improving in their ability to help data scientists in the daunting task of data transformation and data representation so that the data require- ments of specific predictive models and algorithms can be properly executed. Application Case 3.1 illustrates a business scenario in which one of the largest telecommunication companies streamlined and used a wide variety of rich data sources to generate customers insight to prevent churn and to create new revenue sources. The Problem In the ultra-competitive telecommunications indus- try, staying relevant to consumers while finding new sources of revenue is critical, especially since cur- rent revenue sources are in decline.
  • 30. For Fortune 13 powerhouse Verizon, the secret weapon that catapulted the company into the nation’s largest and most reliable network provider is also guiding the business toward future success (see the following figure for some numbers about Verizon). The secret weapon? Data and analytics. Because telecommunication companies are typically rich in data, having the right analytics solution and personnel in place can uncover critical insights that benefit every area of the business. The Backbone of the Company Since its inception in 2000, Verizon has partnered with Teradata to create a data and analytics archi- tecture that drives innovation and science-based decision making. The goal is to stay relevant to cus- tomers while also identifying new business oppor- tunities and making adjustments that result in more cost-effective operations. “With business intelligence, we help the business identify new business opportunities or make course corrections to operate the business in a more cost-effective way,” said Grace Hwang, executive director of Financial Performance & Analytics, BI, for Verizon. “We support decision makers with the most relevant information to improve the competitive advantage of Verizon.” By leveraging data and analytics, Verizon is able to offer a reliable network, ensure customer satisfaction, and develop products and services that consumers want to buy.
  • 31. “Our incubator of new products and services will help bring the future to our customers,” Hwang said. “We’re using our network to make breakthroughs in Application Case 3.1 Verizon Answers the Call for Innovation: The Nation’s Largest Network Provider uses Advanced Analytics to Bring the Future to its Customers Verizon by the Numbers The top ranked wireless carrier in the U.S. has: $131.6B 177K 1,700 112.1M 106.5M 13M retail locations retail connections postpaid customers TV and internet subscribers in revenue employees
  • 32. $ (Continued ) 128 Part I • Introduction to Analytics and AI interactive entertainment, digital media, the Internet of Things, and broadband services.” Data Insights across Three Business Units Verizon relies on advanced analytics that are exe- cuted on the Teradata® Unified Data Architecture™ to support its business units. The analytics enable Verizon to deliver on its promise to help customers innovate their lifestyles and provide key insights to support these three areas: • Identify new revenue sources. Research and development teams use data, analytics, and strategic partnerships to test and develop with the Internet of Things (IoT). The new frontier in data is IoT, which will lead to new revenues that in turn generate opportunities for top-line growth. Smart cars, smart agricul- ture, and smart IoT will all be part of this new growth. • Predict churn in the core mobile business. Verizon has multiple use cases that demonstrate how its advanced analytics enable laser-accurate churn prediction—within a one to two percent margin—in the mobile space. For a $131 billion
  • 33. company, predicting churn with such precision is significant. By recognizing specific patterns in tablet data usage, Verizon can identify which customers most often access their tablets, then engage those who do not. • Forecast mobile phone plans. Customer behav- ioral analytics allow finance to better predict earnings in fast-changing market conditions. The U.S. wireless industry is moving from monthly payments for both the phone and the service to paying for the phone independently. This opens up a new opportunity for Verizon to gain busi- ness. The analytic environment helps Verizon better predict churn with new plans and forecast the impact of changes to pricing plans. The analytics deliver what Verizon refers to as “hon- est data” that inform various business units. “Our mission is to be the honest voice and the indepen- dent third-party opinion on the success or oppor- tunities for improvement to the business,” Hwang explains. “So my unit is viewed as the golden source of information, and we come across with the honest voice, and a lot of the business decisions are through various rungs of course correction.” Hwang adds that oftentimes, what forces a company to react is competitors affecting change in the marketplace, rather than the company making the wrong decisions. “So we try to guide the business through the best course of correc- tion, wherever applicable, timely, so that we can continue to deliver record-breaking results year after year,” she said. “I have no doubt that the
  • 34. business intelligence had led to such success in the past.” Disrupt and Innovate Verizon leverages advanced analytics to optimize marketing by sending the most relevant offers to customers. At the same time, the company relies on analytics to ensure they have the financial acumen to stay number one in the U.S. mobile market. By continuing to disrupt the industry with innovative products and solutions, Verizon is positioned to remain the wireless standard for the industry. “We need the marketing vision and the sales rigor to produce the most relevant offer to our customers, and then at the same time we need to have the finance rigor to ensure that whatever we offer to the customer is also profitable to the business so that we’re responsible to our share- holders,” Hwang says. In Summary—Executing the Seven Ps of Modern Marketing Telecommunications giant Verizon uses seven Ps to drive its modern-day marketing efforts. The Ps, when used in unison, help Verizon penetrate the market in the way it predicted. 1. People: Understanding customers and their needs to create the product. 2. Place: Where customers shop. 3. Product: The item that’s been manufactured
  • 35. and is for sale. Application Case 3.1 (Continued) Chapter 3 • Nature of Data, Statistical Modeling, and Visualization 129 u SECTION 3.3 REVIEW QUESTIONS 1. What are data? How do data differ from information and knowledge? 2. What are the main categories of data? What types of data can we use for BI and analytics? 3. Can we use the same data representation for all analytics models? Why, or why not? 4. What is a 1-of-N data representation? Why and where is it used in analytics? 3.4 ART AND SCIENCE OF DATA PREPROCESSING Data in their original form (i.e., the real-world data) are not usually ready to be used in analytics tasks. They are often dirty, misaligned, overly complex, and inaccurate. A te- dious and time-demanding process (so-called data preprocessing) is necessary to con- vert the raw real-world data into a well-refined form for analytics algorithms (Kotsiantis, Kanellopoulos, & Pintelas, 2006). Many analytics professionals
  • 36. would testify that the time spent on data preprocessing (which is perhaps the least enjoyable phase in the whole process) is significantly longer than the time spent on the rest of the analytics tasks (the fun of analytics model building and assessment). Figure 3.3 shows the main steps in the data preprocessing endeavor. In the first step of data preprocessing, the relevant data are collected from the iden- tified sources, the necessary records and variables are selected (based on an intimate understanding of the data, the unnecessary information is filtered out), and the records coming from multiple data sources are integrated/merged (again, using the intimate un- derstanding of the data, the synonyms and homonyms are able to be handled properly). In the second step of data preprocessing, the data are cleaned (this step is also known as data scrubbing). Data in their original/raw/real-world form are usually dirty (Hernández & Stolfo, 1998; Kim et al., 2003). In this phase, the values in the data set are identified and dealt with. In some cases, missing values are an anomaly in the data set, in which case they need to be imputed (filled with a most probable value) or ignored; in other cases, the missing values are a natural part of the data set 4. Process: How customers get to the shop or place to buy the product.
  • 37. 5. Pricing: Working with promotions to get cus- tomers’ attention. 6. Promo: Working with pricing to get customers’ attention. 7. Physical evidence: The business intelligence that gives insights. “The Aster and Hadoop environment allows us to explore things we suspect could be the rea- sons for breakdown in the seven Ps,” says Grace Hwang, executive director of Financial Performance & Analytics, BI, for Verizon. “This goes back to providing the business value to our decision- makers. With each step in the seven Ps, we ought to be able to tell them where there are opportunities for improvement.” Questions for Case 3.1 1. What was the challenge Verizon was facing? 2. What was the data-driven solution proposed for Verizon’s business units? 3. What were the results? Source: Teradata Case Study “Verizon Answers the Call for Innovation” https://www.teradata.com/Resources/Case-Studies/ Verizon-answers-the-call-for-innovation (accessed July 2018). https://www.teradata.com/Resources/Case-Studies/Verizon- answers-the-call-for-innovation https://www.teradata.com/Resources/Case-Studies/Verizon-
  • 38. answers-the-call-for-innovation 130 Part I • Introduction to Analytics and AI (e.g., the household income field is often left unanswered by people who are in the top income tier). In this step, the analyst should also identify noisy values in the data (i.e., the outliers) and smooth them out. In addition, inconsistencies (unusual values within a variable) in the data should be handled using domain knowledge and/or expert opinion. In the third step of data preprocessing, the data are transformed for better process- ing. For instance, in many cases, the data are normalized between a certain minimum and maximum for all variables to mitigate the potential bias of one variable having DW Well-Formed Data Social Data Legacy DBWeb Data Data Consolidation Collect data Select data Integrate data
  • 39. Data Cleaning Impute values Reduce noise Eliminate duplicates Data Transformation Normalize data Discretize data Create attributes Data Reduction Reduce dimension Reduce volume Balance data OLTP Raw Data Sources F e e d b a c k FIGURE 3.3 Data Preprocessing Steps. Chapter 3 • Nature of Data, Statistical Modeling, and Visualization 131
  • 40. large numeric values (such as household income) dominating other variables (such as number of dependents or years in service, which could be more important) having smaller values. Another transformation that takes place is discretization and/or aggrega- tion. In some cases, the numeric variables are converted to categorical values (e.g., low, medium, high); in other cases, a nominal variable’s unique value range is reduced to a smaller set using concept hierarchies (e.g., as opposed to using the individual states with 50 different values, one could choose to use several regions for a variable that shows location) to have a data set that is more amenable to computer processing. Still, in other cases, one might choose to create new variables based on the existing ones to magnify the information found in a collection of variables in the data set. For instance, in an organ transplantation data set, one might choose to use a single variable show- ing the blood-type match (1: match, 0: no match) as opposed to separate multinominal values for the blood type of both the donor and the recipient. Such simplification could increase the information content while reducing the complexity of the relationships in the data. The final phase of data preprocessing is data reduction. Even though data scientists (i.e., analytics professionals) like to have large data sets, too much data can also be a problem. In the simplest sense, one can visualize the data commonly used in predictive
  • 41. analytics projects as a flat file consisting of two dimensions: variables (the number of columns) and cases/records (the number of rows). In some cases (e.g., image process- ing and genome projects with complex microarray data), the number of variables can be rather large, and the analyst must reduce the number to a manageable size. Because the variables are treated as different dimensions that describe the phenomenon from differ- ent perspectives, in predictive analytics and data mining, this process is commonly called dimensional reduction (or variable selection). Even though there is not a single best way to accomplish this task, one can use the findings from previously published litera- ture; consult domain experts; run appropriate statistical tests (e.g., principal component analysis or independent component analysis); and, more preferably, use a combination of these techniques to successfully reduce the dimensions in the data into a more manage- able and most relevant subset. With respect to the other dimension (i.e., the number of cases), some data sets can include millions or billions of records. Even though computing power is increasing ex- ponentially, processing such a large number of records cannot be practical or feasible. In such cases, one might need to sample a subset of the data for analysis. The underlying assumption of sampling is that the subset of the data will contain all relevant patterns of the complete data set. In a homogeneous data set, such an assumption could hold well,
  • 42. but real-world data are hardly ever homogeneous. The analyst should be extremely careful in selecting a subset of the data that reflects the essence of the complete data set and is not specific to a subgroup or subcategory. The data are usually sorted on some variable, and taking a section of the data from the top or bottom could lead to a biased data set on specific values of the indexed variable; therefore, always try to randomly select the records on the sample set. For skewed data, straightforward random sampling might not be sufficient, and stratified sampling (a proportional representation of different subgroups in the data is represented in the sample data set) might be required. Speaking of skewed data, it is a good practice to balance the highly skewed data by either oversampling the less represented or undersampling the more represented classes. Research has shown that balanced data sets tend to produce better prediction models than unbalanced ones (Thammasiri et al., 2014). The essence of data preprocessing is summarized in Table 3.1, which maps the main phases (along with their problem descriptions) to a representative list of tasks and algorithms. 132 Part I • Introduction to Analytics and AI TABLE 3.1 A Summary of Data Preprocessing Tasks and Potential Methods
  • 43. Main Task Subtasks Popular Methods Data consolidation Access and collect the data Select and filter the data Integrate and unify the data SQL queries, software agents, Web services. Domain expertise, SQL queries, statistical tests. SQL queries, domain expertise, ontology-driven data mapping. Data cleaning Handle missing values in the data Fill in missing values (imputations) with most appropriate val - ues (mean, median, min/max, mode, etc.); recode the missing values with a constant such as “ML”; remove the record of the missing value; do nothing. Identify and reduce noise in the data Identify the outliers in data with simple statistical techniques (such as averages and standard deviations) or with cluster analysis; once identified, either remove the outliers or smooth them by using binning, regression, or simple averages. Find and eliminate erroneous data Identify the erroneous values in data (other than outliers), such as odd values, inconsistent class labels, odd distributions; once identified, use domain expertise to correct the values or remove the records holding the erroneous values.
  • 44. Data transformation Normalize the data Reduce the range of values in each numerically valued variable to a standard range (e.g., 0 to 1 or -1 to +1) by using a vari- ety of normalization or scaling techniques. Discretize or aggregate the data If needed, convert the numeric variables into discrete represen- tations using range- or frequency-based binning techniques; for categorical variables, reduce the number of values by applying proper concept hierarchies. Construct new attributes Derive new and more informative variables from the existing ones using a wide range of mathematical functions (as simple as addition and multiplication or as complex as a hybrid combi - nation of log transformations). Data reduction Reduce number of attributes Use principal component analysis, independent component analysis, chi-square testing, correlation analysis, and decision tree induction. Reduce number of records Perform random sampling, stratified sampling, expert- knowledge-driven purposeful sampling. Balance skewed data Oversample the less represented or undersample the more represented classes. It is almost impossible to underestimate the value proposition of data preprocess- ing. It is one of those time-demanding activities in which investment of time and effort
  • 45. pays off without a perceivable limit for diminishing returns. That is, the more resources you invest in it, the more you will gain at the end. Application Case 3.2 illustrates an interesting study that used raw, readily available academic data within an educational organization to develop predictive models to better understand attrition and improve freshman student retention in a large higher education institution. As the application case clearly states, each and every data preprocessing task described in Table 3.1 was criti- cal to a successful execution of the underlying analytics project, especially the task that related to the balancing of the data set. Chapter 3 • Nature of Data, Statistical Modeling, and Visualization 133 Student attrition has become one of the most chal- lenging problems for decision makers in academic institutions. Despite all the programs and services that are put in place to help retain students, accord- ing to the U.S. Department of Education’s Center for Educational Statistics (nces.ed.gov), only about half of those who enter higher education actually earn a bachelor’s degree. Enrollment management and the retention of students have become a top priority for administrators of colleges and universities in the United States and other countries around the world. High dropout of students usually results in overall financial loss, lower graduation rates, and an inferior school reputation in the eyes of all stakeholders. The legislators and policy makers who oversee higher
  • 46. education and allocate funds, the parents who pay for their children’s education to prepare them for a better future, and the students who make college choices look for evidence of institutional quality and reputation to guide their decision-making processes. The Proposed Solution To improve student retention, one should try to understand the nontrivial reasons behind the attrition. To be successful, one should also be able to accu- rately identify those students who are at risk of drop- ping out. So far, the vast majority of student attrition research has been devoted to understanding this com- plex, yet crucial, social phenomenon. Even though these qualitative, behavioral, and survey-based stud- ies revealed invaluable insight by developing and testing a wide range of theories, they do not pro- vide the much-needed instruments to accurately pre- dict (and potentially improve) student attrition. The project summarized in this case study proposed a quantitative research approach in which the histori-
  • 47. cal institutional data from student databases could be used to develop models that are capable of pre- dicting as well as explaining the institution-specific nature of the attrition problem. The proposed analyt- ics approach is shown in Figure 3.4. Although the concept is relatively new to higher education, for more than a decade now, similar problems in the field of marketing man- agement have been studied using predictive data analytics techniques under the name of “churn analysis” where the purpose has been to identify a sample among current customers to answer the question, “Who among our current customers are more likely to stop buying our products or services?” so that some kind of mediation or intervention pro- cess can be executed to retain them. Retaining exist- ing customers is crucial because, as we all know and as the related research has shown time and time again, acquiring a new customer costs on an order of magnitude more effort, time, and money than try- ing to keep the one that you already have. Data Are of the Essence
  • 48. The data for this research project came from a sin- gle institution (a comprehensive public university located in the Midwest region of the United States) with an average enrollment of 23,000 students, of which roughly 80 percent are the residents of the same state and roughly 19 percent of the students are listed under some minority classification. There is no significant difference between the two genders in the enrollment numbers. The average freshman student retention rate for the institution was about 80 percent, and the average six-year graduation rate was about 60 percent. The study used five years of institutional data, which entailed 16,000+ students enrolled as fresh- men, consolidated from various and diverse univer- sity student databases. The data contained variables related to students’ academic, financial, and demo- graphic characteristics. After merging and convert- ing the multidimensional student data into a single flat file (a file with columns representing the vari- ables and rows representing the student records), the resultant file was assessed and preprocessed to identify and remedy anomalies and unusable val-
  • 49. ues. As an example, the study removed all inter- national student records from the data set because they did not contain information about some of the most reputed predictors (e.g., high school GPA, SAT scores). In the data transformation phase, some of the variables were aggregated (e.g., “Major” and “Concentration” variables aggregated to binary vari- ables MajorDeclared and ConcentrationSpecified) Application Case 3.2 Improving Student Retention with Data- Driven Analytics (Continued ) 134 Part I • Introduction to Analytics and AI FIGURE 3.4 An Analytics Approach to Predicting Student Attrition. Application Case 3.2 (Continued)
  • 50. Chapter 3 • Nature of Data, Statistical Modeling, and Visualization 135 for better interpretation for the predictive model- ing. In addition, some of the variables were used to derive new variables (e.g., Earned/Registered ratio and YearsAfterHighSchool). Earned>Registered = EarnedHours> RegisteredHours YearsAfterHigh = FreshmenEnrollmentYear - School HighSchoolGraduationYear The Earned/Registered ratio was created to have a better representation of the students’ resiliency and determination in their first semester of the freshman year. Intuitively, one would expect greater values for this variable to have a positive impact on retention/ persistence. The YearsAfterHighSchool was created to measure the impact of the time taken between high school graduation and initial college enrollment. Intuitively, one would expect this variable to be a contributor to the prediction of attrition. These aggre- gations and derived variables are determined based
  • 51. on a number of experiments conducted for a number of logical hypotheses. The ones that made more com- mon sense and the ones that led to better prediction accuracy were kept in the final variable set. Reflecting the true nature of the subpopulation (i.e., the fresh- men students), the dependent variable (i.e., “Second Fall Registered”) contained many more yes records (~80%) than no records (~20%; see Figure 3.5). Research shows that having such imbalanced data has a negative impact on model performance. Therefore, the study experimented with the options of using and comparing the results of the same type of models built with the original imbalanced data (biased for the yes records) and the well-balanced data. Modeling and Assessment The study employed four popular classification meth- ods (i.e., artificial neural networks, decision trees, sup- port vector machines, and logistic regression) along with three model ensemble techniques (i.e., bagging, busting, and information fusion). The results obtained from all model types were then compared to each
  • 52. other using regular classification model assessment methods (e.g., overall predictive accuracy, sensitivity, specificity) on the holdout samples. In machine-learning algorithms (some of which will be covered in Chapter 4), sensitivity analysis is a method for identifying the “cause-and-effect” relationship between the inputs and outputs of a given prediction model. The fundamental idea behind sensitivity analysis is that it measures the importance of predictor variables based on the change in modeling performance that occurs if a predictor variable is not included in the model. This modeling and experimentation practice is also called a leave-one-out assessment. Hence, the mea- sure of sensitivity of a specific predictor variable is the ratio of the error of the trained model without the predictor variable to the error of the model that includes this predictor variable. The more sensitive 50% No 50% No B
  • 53. a la n c e d D a ta Model Building, Testing, and Validating Model Assessment TP FP FN TN Yes No Yes
  • 54. No (80%, 80%, 80%) (90%, 100%, 50%) Which one is better? Input Data 80% No 20% Yes *Yes: dropped out, No: persisted. (accuracy, precision+, precision–) (accuracy, precision+, precision–) Validate Built
  • 55. Test Im b a la n c e d D a ta FIGURE 3.5 A Graphical Depiction of the Class Imbalance Problem. (Continued ) 136 Part I • Introduction to Analytics and AI
  • 56. the network is to a particular variable, the greater the performance decrease would be in the absence of that variable and therefore the greater the ratio of importance. In addition to the predictive power of the models, the study also conducted sensitivity analyses to determine the relative importance of the input variables. The Results In the first set of experiments, the study used the original imbalanced data set. Based on the 10-fold cross-validation assessment results, the support vector machines produced the best accuracy with an overall prediction rate of 87.23 percent, and the decision tree was the runner-up with an overall prediction rate of 87.16 percent, followed by artificial neural networks and logistic regression with overall prediction rates of 86.45 percent and 86.12 percent, respectively (see Table 3.2). A careful examination of these results reveals that the prediction accuracy for the “Yes” class is significantly higher than the prediction accuracy of the “No” class. In fact, all four model types predicted the students who are likely to return for the second year with better than 90 percent accuracy, but the
  • 57. types did poorly on predicting the students who are likely to drop out after the freshman year with less than 50 percent accuracy. Because the prediction of the “No” class is the main purpose of this study, less than 50 percent accuracy for this class was deemed not acceptable. Such a difference in prediction accu- racy of the two classes can (and should) be attributed to the imbalanced nature of the training data set (i.e., ~80% “Yes” and ~20% “No” samples). The next round of experiments used a well- balanced data set in which the two classes are represented nearly equally in counts. In realizing this approach, the study took all samples from the minority class (i.e., the “No” class herein), randomly selected an equal number of samples from the major- ity class (i.e., the “Yes” class herein), and repeated this process 10 times to reduce potential bias of random sampling. Each of these sampling processes resulted in a data set of 7,000+ records, of which both class labels (“Yes” and “No”) were equally represented. Again, using a 10-fold cross-validation methodology, the study developed and tested prediction models for all four model types. The results of these experi - ments are shown in Table 3.3. Based on the hold-
  • 58. out sample results, support vector machines once again generated the best overall prediction accuracy with 81.18 percent followed by decision trees, artifi - cial neural networks, and logistic regression with an overall prediction accuracy of 80.65 percent, 79.85 percent, and 74.26 percent, respectively. As can be seen in the per-class accuracy figures, the prediction models did significantly better on predicting the “No” class with the well-balanced data than they did with the unbalanced data. Overall, the three machine- learning techniques performed significantly better than their statistical counterpart, logistic regression. Next, another set of experiments was con- ducted to assess the predictive ability of the three ensemble models. Based on the 10-fold cross- validation methodology, the information fusion– type ensemble model produced the best results with an overall prediction rate of 82.10 percent, followed by the bagging-type ensembles and boosting-type TABLE 3.2 Prediction Results for the Original/Unbalanced Data Set ANN(MLP) DT(C5) SVM LR
  • 59. No Yes No Yes No Yes No Yes No 1,494 384 1,518 304 1,478 255 1,438 376 Yes 1,596 11,142 1,572 11,222 1,612 11,271 1,652 11,150 SUM 3,090 11,526 3,090 11,526 3,090 11,526 3,090 11,526 Per-class accuracy 48.35% 96.67% 49.13% 97.36% 47.83% 97.79% 46.54% 96.74% Overall accuracy 86.45% 87.16% 87.23% 86.12% *ANN: Artificial Neural Network; MLP: Multi-Layer Perceptron; DT: Decision Tree; SVM: Support Vector Machine; LR: Logistic Regression Application Case 3.2 (Continued) Chapter 3 • Nature of Data, Statistical Modeling, and Visualization 137
  • 60. ensembles with overall prediction rates of 81.80 per- cent and 80.21 percent, respectively (see Table 3.4). Even though the prediction results are slightly better than those of the individual models, ensembles are known to produce more robust prediction systems compared to a single-best prediction model (more on this can be found in Chapter 4). In addition to assessing the prediction accu- racy for each model type, a sensitivity analysis was also conducted using the developed prediction models to identify the relative importance of the independent variables (i.e., the predictors). In real - izing the overall sensitivity analysis results, each of the four individual model types generated its own sensitivity measures, ranking all independent vari- ables in a prioritized list. As expected, each model type generated slightly different sensitivity rank- ings of the independent variables. After collecting all four sets of sensitivity numbers, the sensitivity numbers are normalized and aggregated and plot- ted in a horizontal bar chart (see Figure 3.6). The Conclusions
  • 61. The study showed that, given sufficient data with the proper variables, data mining methods are capable of predicting freshmen student attrition with approximately 80 percent accuracy. Results also showed that, regardless of the prediction model employed, the balanced data set (compared to unbalanced/original data set) produced better prediction models for identifying the students who are likely to drop out of the college prior to their sophomore year. Among the four individual pre- diction models used in this study, support vector machines performed the best, followed by deci- sion trees, neural networks, and logistic regres- sion. From the usability standpoint, despite the fact that support vector machines showed better prediction results, one might choose to use deci- sion trees, because compared to support vector machines and neural networks, they portray a more transparent model structure. Decision trees TABLE 3.3 Prediction Results for the Balanced Data Set Confusion Matrix
  • 62. ANN(MLP) DT(C5) SVM LR No Yes No Yes No Yes No Yes No 2,309 464 2311 417 2,313 386 2,125 626 Yes 781 2,626 779 2,673 777 2,704 965 2,464 SUM 3,090 3,090 3,090 3,090 3,090 3,090 3,090 3,090 Per-class accuracy 74.72% 84.98% 74.79% 86.50% 74.85% 87.51% 68.77% 79.74% Overall accuracy 79.85% 80.65% 81.18% 74.26% TABLE 3.4 Prediction Results for the Three Ensemble Models Boosting Bagging Information Fusion (boosted trees) (random forest) (weighted average) No Yes No Yes No Yes No 2,242 375 2,327 362 2,335 351 Yes 848 2,715 763 2,728 755 2,739
  • 63. SUM 3,090 3,090 3,090 3,090 3,090 3,090 Per-class accuracy 72.56% 87.86% 75.31% 88.28% 75.57% 88.64% Overall accuracy 80.21% 81.80% 82.10% (Continued ) 138 Part I • Introduction to Analytics and AI explicitly show the reasoning process of different predictions, providing a justification for a specific outcome, whereas support vector machines and artificial neural networks are mathematical models that do not provide such a transparent view of “how they do what they do.” Questions for Case 3.2 1. What is student attrition, and why is it an impor- tant problem in higher education?
  • 64. 2. What were the traditional methods to deal with the attrition problem? 3. List and discuss the data-related challenges within the context of this case study. 4. What was the proposed solution? What were the results? Sources: D. Thammasiri, D. Delen, P. Meesad, & N. Kasap, “A Critical Assessment of Imbalanced Class Distribution Problem: The Case of Predicting Freshmen Student Attrition,” Expert Systems with Applications, 41(2), 2014, pp. 321–330; D. Delen, “A Comparative Analysis of Machine Learning Techniques for Student Retention Management,” Decision Support Systems, 49(4), 2010, pp. 498– 506, and “Predicting Student Attrition with Data Mining Methods,” Journal of College Student Retention 13(1), 2011, pp. 17–35. EarnedByRegistered
  • 67. Age 0.00 0.20 0.40 0.60 1.000.80 1.20 Sex CLEPHours FIGURE 3.6 Sensitivity-Analysis-Based Variable Importance Results. Application Case 3.2 (Continued) Chapter 3 • Nature of Data, Statistical Modeling, and Visualization 139 u SECTION 3.4 REVIEW QUESTIONS 1. Why are the original/raw data not readily usable by analytics tasks? 2. What are the main data preprocessing steps? 3. What does it mean to clean/scrub the data? What activities are performed in this
  • 68. phase? 4. Why do we need data transformation? What are the commonly used data transforma- tion tasks? 5. Data reduction can be applied to rows (sampling) and/or columns (variable selec- tion). Which is more challenging? 3.5 STATISTICAL MODELING FOR BUSINESS ANALYTICS Because of the increasing popularity of business analytics, the traditional statistical meth- ods and underlying techniques are also regaining their attractiveness as enabling tools to support evidence-based managerial decision making. Not only are they regaining atten- tion and admiration, but this time, they are attracting business users in addition to statisti- cians and analytics professionals. Statistics (statistical methods and underlying techniques) is usually considered as
  • 69. part of descriptive analytics (see Figure 3.7). Some of the statistical methods can also be considered as part of predictive analytics, such as discriminant analysis, multiple regres- sion, logistic regression, and k-means clustering. As shown in Figure 3.7, descriptive ana- lytics has two main branches: statistics and online analytics processing (OLAP). OLAP is the term used for analyzing, characterizing, and summarizing structured data stored in organizational databases (often stored in a data warehouse or in a data mart) using cubes (i.e., multidimensional data structures that are created to extract a subset of data values to answer a specific business question). The OLAP branch of descriptive analytics has also been called business intelligence. Statistics, on the other hand, helps to characterize the data, either one variable at a time or multivariable, all together using either descriptive or inferential methods. Statistics—a collection of mathematical techniques to characterize and interpret data—has been around for a very long time. Many methods and
  • 70. techniques have been developed to address the needs of the end users and the unique characteristics of the data being analyzed. Generally speaking, at the highest level, statistical methods can be Descriptive Inferential OLAP Statistics Business Analytics Descriptive Predictive Prescriptive FIGURE 3.7 Relationship between Statistics and Descriptive Analytics. 140 Part I • Introduction to Analytics and AI classified as either descriptive or inferential. The main difference between descriptive and inferential statistics is the data used in these methods—whereas descriptive statistics
  • 71. is all about describing the sample data on hand, inferential statistics is about drawing inferences or conclusions about the characteristics of the population. In this section, we briefly describe descriptive statistics (because of the fact that it lays the foundation for, and is the integral part of, descriptive analytics), and in the following section we cover regression (both linear and logistic regression) as part of inferential statistics. Descriptive Statistics for Descriptive Analytics Descriptive statistics, as the name implies, describes the basic characteristics of the data at hand, often one variable at a time. Using formulas and numerical aggregations, descrip- tive statistics summarizes the data in such a way that often meaningful and easily under- standable patterns emerge from the study. Although it is very useful in data analytics and very popular among the statistical methods, descriptive statistics does not allow making conclusions (or inferences) beyond the sample of the data being analyzed. That is, it is
  • 72. simply a nice way to characterize and describe the data on hand without making conclu- sions (inferences or extrapolations) regarding the population of related hypotheses we might have in mind. In business analytics, descriptive statistics plays a critical role—it allows us to un- derstand and explain/present our data in a meaningful manner using aggregated num- bers, data tables, or charts/graphs. In essence, descriptive statistics helps us convert our numbers and symbols into meaningful representations for anyone to understand and use. Such an understanding helps not only business users in their decision-making processes but also analytics professionals and data scientists to characterize and validate the data for other more sophisticated analytics tasks. Descriptive statistics allows analysts to identify data concertation, unusually large or small values (i.e., outliers), and unexpectedly dis- tributed data values for numeric variables. Therefore, the methods in descriptive statistics can be classified as either measures for central tendency or
  • 73. measures of dispersion. In the following section, we use a simple description and mathematical formulation/repre- sentation of these measures. In mathematical representation, we will use x1, x2, . . . , xn to represent individual values (observations) of the variable (measure) that we are interested in characterizing. Measures of Centrality Tendency (Also Called Measures of Location or Centrality) Measures of centrality are the mathematical methods by which we estimate or describe central positioning of a given variable of interest. A measure of central tendency is a single numerical value that aims to describe a set of data by simply identifying or estimat- ing the central position within the data. The mean (often called the arithmetic mean or the simple average) is the most commonly used measure of central tendency. In addition to mean, you could also see median or mode being used to describe the centrality of a given variable. Although, the mean, median, and mode are all
  • 74. valid measures of central tendency, under different circumstances, one of these measures of centrality becomes more appropriate than the others. What follows are short descriptions of these measures, including how to calculate them mathematically and pointers on the circumstances in which they are the most appropriate measure to use. Arithmetic Mean The arithmetic mean (or simply mean or average) is the sum of all the values/observa- tions divided by the number of observations in the data set. It is by far the most popular Chapter 3 • Nature of Data, Statistical Modeling, and Visualization 141 and most commonly used measure of central tendency. It is used with continuous or discrete numeric data. For a given variable x, if we happen to have n values/observations
  • 75. 1x1, x2, . . ., xn2, we can write the arithmetic mean of the data sample (x, pronounced as x-bar) as follows: x = x1 + x2 + g + xn n or x = a i=1 n xi n The mean has several unique characteristics. For instance, the sum of the absolute devia- tions (differences between the mean and the observations) above the mean is the same as the sum of the deviations below the mean, balancing the values on either side of it. That said, it does not suggest, however, that half the observations are above and the other
  • 76. half are below the mean (a common misconception among those who do not know basic statistics). Also, the mean is unique for every data set and is meaningful and calculable for both interval- and ratio-type numeric data. One major downside is that the mean can be affected by outliers (observations that are considerably larger or smaller than the rest of the data points). Outliers can pull the mean toward their direction and, hence, bias the centrality representation. Therefore, if there are outliers or if the data are erratically dis- persed and skewed, one should either avoid using the mean as the measure of centrality or augment it with other central tendency measures, such as median and mode. Median The median is the measure of center value in a given data set. It is the number in the middle of a given set of data that has been arranged/sorted in order of magnitude (either ascending or descending). If the number of observations is an odd number, identifying
  • 77. the median is very easy—just sort the observations based on their values and pick the value right in the middle. If the number of observations is an even number, identify the two middle values, and then take the simple average of these two values. The median is meaningful and calculable for ratio, interval, and ordinal data types. Once determined, one-half of the data points in the data is above and the other half is below the median. In contrary to the mean, the median is not affected by outliers or skewed data. Mode The mode is the observation that occurs most frequently (the most frequent value in our data set). On a histogram, it represents the highest bar in a bar chart, and, hence, it can be considered as the most popular option/value. The mode is most useful for data sets that contain a relatively small number of unique values. That is, it could be useless if the data have too many unique values (as is the case in many engineering measurements
  • 78. that capture high precision with a large number of decimal places), rendering each value having either one or a very small number representing its frequency. Although it is a useful measure (especially for nominal data), mode is not a very good representation of centrality, and therefore, it should not be used as the only measure of central tendency for a given data set. In summary, which central tendency measure is the best? Although there is not a clear answer to this question, here are a few hints—use the mean when the data are not prone to outliers and there is no significant level of skewness; use the median when the data have outliers and/or it is ordinal in nature; use the mode when the data are nominal. 142 Part I • Introduction to Analytics and AI Perhaps the best practice is to use all three together so that the central tendency of the
  • 79. data set can be captured and represented from three perspectives. Mostly because “av- erage” is a very familiar and highly used concept to everyone in regular daily activities, managers (as well as some scientists and journalists) often use the centrality measures (especially mean) inappropriately when other statistical information should be consid- ered along with the centrality. It is a better practice to present descriptive statistics as a package—a combination of centrality and dispersion measures—as opposed to a single measure such as mean. Measures of Dispersion (Also Called Measures of Spread or Decentrality) Measures of dispersion are the mathematical methods used to estimate or describe the degree of variation in a given variable of interest. They represent the numerical spread (compactness or lack thereof) of a given data set. To describe this dispersion, a number of statistical measures are developed; the most notable ones are range, variance, and
  • 80. standard deviation (and also quartiles and absolute deviation). One of the main reasons why the measures of dispersion/spread of data values are important is the fact that they give us a framework within which we can judge the central tendency—give us the indica- tion of how well the mean (or other centrality measures) represents the sample data. If the dispersion of values in the data set is large, the mean is not deemed to be a very good representation of the data. This is because a large dispersion measure indicates large dif- ferences between individual scores. Also, in research, it is often perceived as a positive sign to see a small variation within each data sample, as it may indicate homogeneity, similarity, and robustness within the collected data. Range The range is perhaps the simplest measure of dispersion. It is the difference between the largest and the smallest values in a given data set (i.e., variables). So we calculate range by simply identifying the smallest value in the data set
  • 81. (minimum), identifying the largest value in the data set (maximum), and calculating the difference between them (range = maximum - minimum). Variance A more comprehensive and sophisticated measure of dispersion is the variance. It is a method used to calculate the deviation of all data points in a given data set from the mean. The larger the variance, the more the data are spread out from the mean and the more variability one can observe in the data sample. To prevent the offsetting of negative and positive differences, the variance takes into account the square of the distances from the mean. The formula for a data sample can be written as s2 = a ni = 1( xi - x )2 n - 1 where n is the number of samples, x is the mean of the sample,
  • 82. and xi is the i th value in the data set. The larger values of variance indicate more dispersion, whereas smaller values indicate compression in the overall data set. Because the differences are squared, larger deviations from the mean contribute significantly to the value of variance. Again, because the differences are squared, the numbers that represent de- viation/variance become somewhat meaningless (as opposed to a dollar difference, here you are given a squared dollar difference). Therefore, instead of variance, in Chapter 3 • Nature of Data, Statistical Modeling, and Visualization 143 many business applications, we use a more meaningful dispersion measure, called standard deviation.
  • 83. Standard Deviation The standard deviation is also a measure of the spread of values within a set of data. The standard deviation is calculated by simply taking the square root of the variations. The following formula shows the calculation of standard deviation from a given sample of data points. s = A a ni = 1(xi - x )2n - 1 Mean Absolute Deviation In addition to variance and standard deviation, sometimes we also use mean absolute deviation to measure dispersion in a data set. It is a simpler way to calculate the overall deviation from the mean. Specifically, the mean absolute deviation is calculated by mea- suring the absolute values of the differences between each data point and the mean and then summing them. This process provides a measure of spread without being specific about the data point being lower or higher than the mean. The following formula shows
  • 84. the calculation of the mean absolute deviation: MAD = a ni =1� xi - x � n Quartiles and Interquartile Range Quartiles help us identify spread within a subset of the data. A quartile is a quarter of the number of data points given in a data set. Quartiles are determined by first sorting the data and then splitting the sorted data into four disjoint smaller data sets. Quartiles are a useful measure of dispersion because they are much less affected by outliers or a skewness in the data set than the equivalent measures in the whole data set. Quartiles are often reported along with the median as the best choice of measure of dispersion and central tendency, respectively, when dealing with skewed and/or data with outliers. A common way of expressing quartiles is as an interquartile range, which describes the
  • 85. difference between the third quartile (Q3) and the first quartile (Q1), telling us about the range of the middle half of the scores in the distribution. The quartile-driven descriptive measures (both centrality and dispersion) are best explained with a popular plot called a box-and-whiskers plot (or box plot). Box-and-Whiskers Plot The box-and-whiskers plot (or simply a box plot) is a graphical illustration of several descriptive statistics about a given data set. They can be either horizontal or vertical, but vertical is the most common representation, especially in modern-day analytics software products. It is known to be first created and presented by John W. Tukey in 1969. Box plot is often used to illustrate both centrality and dispersion of a given data set (i.e., the distribution of the sample data) in an easy-to-understand graphical notation. Figure 3.8 shows two box plots side by side, sharing the same y-axis. As shown therein, a single chart can have one or more box plots for visual comparison
  • 86. purposes. In such cases, the y-axis would be the common measure of magnitude (the numerical value of the 144 Part I • Introduction to Analytics and AI variable), with the x-axis showing different classes/subsets such as different time dimen- sions (e.g., descriptive statistics for annual Medicare expenses in 2015 versus 2016) or different categories (e.g., descriptive statistics for marketing expenses versus total sales). Although historically speaking, the box plot has not been used widely and often enough (especially in areas outside of statistics), with the emerging popularity of business analytics, it is gaining fame in less technical areas of the business world. Its information richness and ease of understanding are largely to credit for its recent popularity. The box plot shows the centrality (median and sometimes also
  • 87. mean) as well as the dispersion (the density of the data within the middle half— drawn as a box between the first and third quartiles), the minimum and maximum ranges (shown as extended lines from the box, looking like whiskers, that are calculated as 1.5 times the upper or lower end of the quartile box), and the outliers that are larger than the limits of the whis- kers. A box plot also shows whether the data are symmetrically distributed with respect to the mean or sway one way or another. The relative position of the median versus mean and the lengths of the whiskers on both side of the box give a good indication of the potential skewness in the data. x Max Upper Quartile Median
  • 88. Lower Quartile Min Outliers Outliers Larger than 1.5 times the upper quartile Largest value, excluding larger outliers 25% of data is larger than this value 25% of data is smaller than this value Smallest value, excluding smaller outliers Smaller than 1.5 times the
  • 89. lower quartile Mean 50% of data is larger than this value—middle of dataset Simple average of the dataset x Variable 1 Variable 2 FIGURE 3.8 Understanding the Specifics about Box-and- Whiskers Plots. Chapter 3 • Nature of Data, Statistical Modeling, and Visualization 145 Shape of a Distribution Although not as common as the centrality and dispersion, the shape of the data distribu-
  • 90. tion is also a useful measure for the descriptive statistics. Before delving into the shape of the distribution, we first need to define the distribution itself. Simply put, distribution is the frequency of data points counted and plotted over a small number of class labels or numerical ranges (i.e., bins). In a graphical illustration of distribution, the y-axis shows the frequency (count or percentage), and the x-axis shows the individual classes or bins in a rank-ordered fashion. A very well-known distribution is called normal distribution, which is perfectly symmetric on both sides of the mean and has numerous well-founded mathematical properties that make it a very useful tool for research and practice. As the dispersion of a data set increases, so does the standard deviation, and the shape of the distribution looks wider. A graphic illustration of the relationship between dispersion and distribution shape (in the context of normal distribution) is shown in Figure 3.9. There are two commonly used measures to calculate the shape characteristics of a
  • 91. distribution: skewness and kurtosis. A histogram (frequency plot) is often used to visually illustrate both skewness and kurtosis. Skewness is a measure of asymmetry (sway) in a distribution of the data that por- trays a unimodal structure—only one peak exists in the distribution of the data. Because normal distribution is a perfectly symmetric unimodal distribution, it does not have 0 1 2 3212223 (a) (c) (d) (b) FIGURE 3.9 Relationship between Dispersion and Distribution Shape Properties.
  • 92. 146 Part I • Introduction to Analytics and AI skewness; that is, its skewness measure (i.e., the value of the coefficient of skewness) is equal to zero. The skewness measure/value can be either positive or negative. If the dis- tribution sways left (i.e., the tail is on the right side and the mean is smaller than median), then it produces a positive skewness measure; if the distribution sways right (i.e., the tail is on the left side and the mean is larger than median), then it produces a negative skew- ness measure. In Figure 3.9, (c) represents a positively skewed distribution whereas (d) represents a negatively skewed distribution. In the same figure, both (a) and (b) represent perfect symmetry and hence zero measure for skewness. Skewness = S = a ni = 1(xi - x)3 (n - 1)s3 where s is the standard deviation and n is the number of
  • 93. samples. Kurtosis is another measure to use in characterizing the shape of a unimodal dis- tribution. As opposed to the sway in shape, kurtosis focuses more on characterizing the peak/tall/skinny nature of the distribution. Specifically, kurtosis measures the degree to which a distribution is more or less peaked than a normal distribution. Whereas a posi- tive kurtosis indicates a relatively peaked/tall distribution, a negative kurtosis indicates a relatively flat/short distribution. As a reference point, a normal distribution has a kurtosis of 3. The formula for kurtosis can be written as Kurtosis = K = a ni = 1(xi - x)4 ns4 -3 Descriptive statistics (as well as inferential statistics) can easily be calculated using com- mercially viable statistical software packages (e.g., SAS, SPSS,
  • 94. Minitab, JMP, Statistica) or free/open source tools (e.g., R). Perhaps the most convenient way to calculate descriptive and some of the inferential statistics is to use Excel. Technology Insights 3.1 describes in detail how to use Microsoft Excel to calculate descriptive statistics. TECHNOLOGY INSIGHTS 3.1 How to Calculate Descriptive Statistics in Microsoft Excel Excel, arguably the most popular data analysis tool in the world, can easily be used for descriptive statistics. Although the base configuration of Excel does not seem to have the statistics function readily available for end users, those functions come with the Excel installation and can be acti- vated (turned on) with only a few mouse clicks. Figure 3.10 shows how these statistics functions (as part of the Analysis ToolPak) can be activated in Microsoft Excel 2016. Once activated, the Analysis ToolPak will appear in the Data menu option under the
  • 95. name of Data Analysis. When you click on Data Analysis in the Analysis group under the Data tab in the Excel menu bar, you will see Descriptive Statistics as one of the options within the list of data analysis tools (see Figure 3.11, steps 1, 2); click on OK, and the Descriptive Statistics dialog box will appear (see the middle of Figure 3.11). In this dialog box, you need to enter the range of the data, which can be one or more numerical columns, along with the preference check boxes, and click OK (see Figure 3.11, steps 3, 4). If the selection includes more than one numeric column, the tool treats each column as a separate data set and provides descriptive statistics for each column separately. As a simple example, we selected two columns (labeled as Expense and Demand) and executed the Descriptive Statistics option. The bottom section of Figure 3.11 shows the output created by Excel. As can be seen, Excel produced all descriptive statistics that are covered in the previous section and added a few more to the list. In Excel 2016, it is also very easy (a few
  • 96. Chapter 3 • Nature of Data, Statistical Modeling, and Visualization 147 1 2 3 4 FIGURE 3.10 Activating Statistics Function in Excel 2016. 148 Part I • Introduction to Analytics and AI 3 1 4
  • 97. 2 FIGURE 3.11 Obtaining Descriptive Statistics in Excel. Chapter 3 • Nature of Data, Statistical Modeling, and Visualization 149 1 2 3 FIGURE 3.12 Creating a Box-and-Whiskers Plot in Excel 2016. mouse clicks) to create a box-and-whiskers plot. Figure 3.12 shows the simple three-step pro- cess of creating a box-and-whiskers plot in Excel. Although Analysis ToolPak is a very useful tool in Excel, one should be aware of an im- portant point related to the results that it generates, which have a different behavior than other ordinary Excel functions: Although Excel functions dynamically
  • 98. change as the underlying data in the spreadsheet are changed, the results generated by the Analysis ToolPak do not. For example, if you change the values in either or both of these columns, the Descriptive Statistics results produced by the Analysis ToolPak will stay the same. However, the same is not true for ordinary Excel func- tions. If you were to calculate the mean value of a given column (using “=AVERAGE(A1:A121)”) and then change the values within the data range, the mean value would automatically change. In summary, the results produced by Analysis ToolPak do not have a dynamic link to the underlying data, and if the data change, the analysis needs to be redone using the dialog box. Successful applications of data analytics cover a wide range of business and organizational settings, addressing problems once thought unsolvable. Application Case 3.3 is an excellent il- lustration of those success stories in which a small municipality administration adopted a data analytics approach to intelligently detect and solve problems by continuously analyzing demand and consumption patterns.
  • 99. u SECTION 3.5 REVIEW QUESTIONS 1. What is the relationship between statistics and business analytics? 2. What are the main differences between descriptive and inferential statistics? 3. List and briefly define the central tendency measures of descriptive statistics. 4. List and briefly define the dispersion measures of descriptiv e statistics. 5. What is a box-and-whiskers plot? What types of statistical information does it represent? 6. What are the two most commonly used shape characteristics to describe a data distribution? 150 Part I • Introduction to Analytics and AI A leaky faucet. A malfunctioning dishwasher. A cracked sprinkler head. These are more than just a headache for a home owner or business to fix. They can be costly, unpredictable, and, unfortunately, hard to pin- point. Through a combination of wireless water meters
  • 100. and a data-analytics-driven, customer-accessible portal, the Town of Cary, North Carolina, is making it much easier to find and fix water loss issues. In the process, the town has gained a big-picture view of water usage critical to planning future water plant expansions and promoting targeted conservation efforts. When the town of Cary installed wireless meters for 60,000 customers in 2010, it knew the new technology wouldn’t just save money by eliminating manual monthly readings; the town also realized it would get more accurate and timely information about water consumption. The Aquastar wireless system reads meters once an hour—that is 8,760 data points per customer each year instead of 12 monthly readings. The data had tremendous potential if they could be easily consumed. “Monthly readings are like having a gallon of water’s worth of data. Hourly meter readings are more like an Olympic-size pool of data,” says Karen Mills, finance director for Cary. “SAS helps us man- age the volume of that data nicely.” In fact, the solu- tion enables the town to analyze half a billion data
  • 101. points on water usage and make them available to and easily consumable by all customers. The ability to visually look at data by house- hold or commercial customer by the hour has led to some very practical applications: • The town can notify customers of potential leaks within days. • Customers can set alerts that notify them with- in hours if there is a spike in water usage. • Customers can track their water usage online, helping them to be more proactive in conserv- ing water. Through the online portal, one business in the town saw a spike in water consumption on weekends when employees are away. This seemed odd, and the unusual reading helped the company learn that a commercial dishwasher was malfunctioning, running continuously over weekends. Without the wireless water-meter data and the customer-accessible portal,
  • 102. this problem could have gone unnoticed, continuing to waste water and money. The town has a much more accurate picture of daily water usage per person, critical for planning future water plant expansions. Perhaps the most interesting perk is that the town was able to verify a hunch that has far-reaching cost ramifications: Cary residents are very economical in their use of water. “We calculate that with modern high-efficiency appli- ances, indoor water use could be as low as 35 gal- lons per person per day. Cary residents average 45 gallons, which is still phenomenall y low,” explains town Water Resource Manager Leila Goodwin. Why is this important? The town was spending money to encourage water efficiency—rebates on low-flow toilets or discounts on rain barrels. Now it can take a more targeted approach, helping specific consum- ers understand and manage both their indoor and outdoor water use. SAS was critical not just for enabling residents to understand their water use but also working behind the scenes to link two disparate databases. “We have a billing database and the meter-reading