
Recommended
Recommended
More Related Content
Viewers also liked
Viewers also liked (20)
Similar to MR physics 101
Similar to MR physics 101 (20)
Recently uploaded
Recently uploaded (20)
MR physics 101
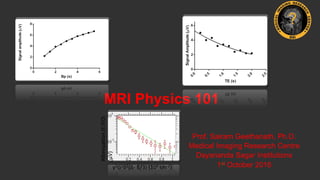
- 1. MRI Physics 101 Prof. Sairam Geethanath, Ph.D. Medical Imaging Research Centre Dayananda Sagar Institutions 1st October 2016 A"enua'on (E/E0) (µV) γ2G2δ2(∆- δ/3) (109 sm-2)
- 2. Declara'on • I have no conflicts of interest to declare, with respect to the contents of this presenta'on and data shown here is already in public domain • Wipro GE Healthcare funds part of my research as part of a DST Technology systems development grant MIRC 2
- 3. Outline • High school physics – relevant to MRI • Overview of the MRI system • Precession and the Pelton Wheel • Relaxa'on 'mes: T1 and T2 • Basis for contrast genera'on • Spin Echo sequence: An example of image genera'on • Spa'al localiza'on through magne'c field gradient • k-space and its traversal • Tools to get started • Pulseq - Acquisi'on • GPI - Reconstruc'on • DIY assignments MIRC 3
- 4. Important high school Physics 4 Lenz’s law Reciprocity theorem Biot Savart’s Law Faraday’s law Vineet, MIRC Abitha, MIRC Aparana, MIRC Anusha, MIRC
- 8. • The application of an RF pulse, causes alignment of spins away from the longitudinal axis (lower energy state) on a transverse plane (higher energy state) • Spins release the absorbed energy and drop back to their lower energy states • Spin can exchange a quantum of energy with the lattice (also precessing at same frequency) • Spin transitions from 𝑚=−1/2 (excited state) to 𝑚=1/2 (ground state) is accompanied by a transition upwards in energy from some lower lattice state to a higher lattice state h • Energy transition must be equal ‘ law of conservation of energy’ • Transfer of energy occurs through collisions, rotations, or electromagnetic interactions with the surrounding lattice • This energy loss is unrecoverable and represents the transfer of heat. h"p://mriques'ons.com Magne'c resonance imaging: Physical principles and sequence design 𝑚=−1/2 𝑚=1/2 ℎ 𝑙 𝑝𝑟𝑜𝑡𝑜𝑛 𝑙𝑎𝑡𝑡𝑖𝑐𝑒 Boltzmann equa'on for popula'on states T1 relaxation
- 9. • The electromagnetic field from a particle can be considered to emanate from an idealized tiny bar magnet with north and south poles ("dipole") . • A dipole-dipole interaction is a "through space" interaction of the fields from two spinning particles • Four major factors determine the strength of the dipolar interaction: (1) types of spins; (2) the distance between them; (3) the angle between them; and (4) their relative motion. h"p://mriques'ons.com/dipole-dipole-interac'ons.html T1 of water T1 of water doped with Copper Sulphate T1 of oil Dipole – dipole interactions
- 10. h"p://mriques'ons.com Magne'c resonance imaging: Physical principles and sequence design 0 2 4 4.0 4.5 5.0 Mz t M0 First RF Second RF TR T1 0.63 M0 • Spin lamce interac'on result in re-growth of longitudinal magne'za'on • Rate of change of longitudinal magne'za'on is captured by an exponen'al recovery, is a cross product of magne'za'on moment M and the applied external field B • Synonyms: longitudinal relaa'on, thermal relaxa'on and spin-lamce relaxa'on T1 recovery
- 11. Spin-Spin and Effec-ve Spin-Spin relaxa-on: • NMR signal – phase coherence of nuclear spins & Exponen'al signal decay – loss of phase coherence • Spin-spin relaxa'on – dipole coupling between neighbouring spins • Sampled signal, as a func'on of 'me is given by, S(t)=S0 exp(-t/T2) Where, S0 – ini'al signal magnitude at t=0 • Generally, the field is not en'rely homogeneous • Phase coherence loss – combina'on of spin-spin relaxa'on and magne'c field inhomogeneity, which introduce a range of Larmor frequencies • Dispersion of frequencies – loss of coherence- signal decay In completely homogeneous field, the phase coherence loss is due to spin-spin relaxa8on T2 relaxation
- 12. • Effec've spin-spin relaxa'on 'me constant, T2 * is defined as, 1/T2∗ = 1/T2 +γ∆B0 Where, γ – gyromagne'c ra'o of the observed nucleus ∆B0 – magne'c field inhomogeneity • Signal as a func'on of 'me in situa'on with field inhomogeneity is given by, S(t)=S0 exp(-t/T2∗) Where, S0 – ini'al signal magnitude at t=0 Phase coherence loss due to spin-spin relaxa8on is irreversible, whereas loss due to field inhomogeneity can be reversed by Spin Echo (called as Hahn Echo)Erwin Hahn T2 * relaxation
- 13. Figure1: Spin-Echo pulse sequence diagram • The 'me between the 90°pulse and the 180°pulse is called TΕ, the echo-8me • Reversing the de-phasing due to magne'c field inhomogeneity is the goal of this basic spin-echo experiment • Only the de-phasing that occurred as a result of magne'c field inhomogeneity will be re-focused spin echo Terranova student Guide, Magritek Limited
- 14. • Sampling commences at the centre of the echo • Delay between the 180°pulse and the first sampled data point is TΕ • TΕ must be chosen to be long enough - to view the en're echo - to allow for the complete relaxa'on of the signal excited T2 Measurement: • Measured using a succession of spin-echo experiments with incrementally longer echo 'mes • The plot of echo amplitude as a func'on of echo 'me will be an exponen'al decay with a characteris'c decay 'me constant, T2 • The echo amplitude is given by, where E - amplitude of an echo acquired with TΕ E0 - echo amplitude in the absence of a T2 decay
- 23. 20 40 60 80 100 120 50 100 150 200 250 Few k-space trajectories trajectories y x
- 24. Example problem 1: Design Cartesian k-space trajectory Given parameters: ∆x = 1 mm ∆y = 1 mm Lx = 25.6 cm L y = 25.6 cm Evaluate the unknowns : Variable Value Nx Ny 256 256 3.9 m-1 3.9 m-1 [-500, 500] m-1 [-500, 500] m-1
- 27. Open source tool for PSD - Pulseq MIRC 27 0 0.01 0.02 0.03 0.04 0.05 0.06 0.07 0.08 0.09 0 500 1000 1500 RFmag(Hz) 0 0.01 0.02 0.03 0.04 0.05 0.06 0.07 0.08 0.09 t (s) 0 2 4 RFph(rad) 0 0.01 0.02 0.03 0.04 0.05 0.06 0.07 0.08 0.09 t (s) -500 0 500 Gz(kHz/m) 0 0.01 0.02 0.03 0.04 0.05 0.06 0.07 0.08 0.09 -600 -400 -200 0 Gy(kHz/m) 0 0.01 0.02 0.03 0.04 0.05 0.06 0.07 0.08 0.09 -1000 0 1000 Gx(kHz/m) 0 0.01 0.02 0.03 0.04 0.05 0.06 0.07 0.08 0.09 -1 0 1 ADC Source: h"p://pulseq.github.io/ (Needs Matlab installed) Layton et. al., MRM 2016
- 28. Open source tool for students to use – recon - GPI MIRC 28 • h"p://gpilab.com/ 2016/09/gpi-on-windows/ • Simula'on • Reconstruc'on • Image Processing • Visualiza'on • Mac OS X/ Ubuntu / Windows Zwart et. al., MRM, 2016
- 31. Prof. Sairam Geethanath, Ph.D. Medical Imaging Research Centre Dayananda Sagar Institutions 1st October 2016
- 32. ¡ Head ¡ Tumors, aneurysms, bleeding in the brain, ¡ Nerve injury, damage caused by stroke. ¡ Spine ¡ Discs and nerves of the spine for conditions such as spinal stenosis, disc bulges, and spinal tumors. ¡ Chest : Heart, the valves, and coronary blood vessels ¡ Blood vessels and ?low – Dr. Ramesh Venkatesan’s talk ¡ Abdomen and pelvis ¡ Belly, liver, gallbladder, pancreas, kidneys, and bladder ¡ Bones and joints ¡ Arthritis, problems with joints ,bone marrow problems, ¡ Bone tumors, cartilage problems, ¡ Torn ligaments or tendons, infection.
- 34. ¡ DWI is a commonly used MRI sequence for evaluation of acute ischaemic stroke ¡ Sensitive in detection of small and early infarcts ¡ Non invasive way of understanding brain structural connectivity and macroscopic axonal organization ¡ DW image is generated based on the directional rate of diffusion of water molecules inside the brain due to Brownian motion ¡ Image intensities inversely related to the relative mobility of water molecules in tissue and the direction of the motion
- 35. Result Interpretation Quantitative analysis Segmentation Feature Extraction Visualization (may include generating FA,ADC, Tractograpghy) Processing (may include DWI enhancement using Super resolution techniques ) Preprocessing (may include registration,skull stripping,normalization motion , denoisng of low field MR image/DWI)
- 36. ¡ Dark regions – water diffusing slower, more obstacles to movement OR increased viscosity ¡ Bright regions – water diffusing faster DWI ¡ Bright regions – decreased water diffusion ¡ Dark regions – increased water diffusion Figure Source: www.radiopaedia.org ADC Matlab Code available with Arush, MIRC
- 37. COLOUR FA MAP TRACTOGRAPHY • According to the principal direction of diffusion, colour coding of the diffusion data is done • Red - transverse axis (x-axis) • Blue – superior-inferior (z –axis) • Green – anterior-posterior axis (y- axis) • Intensity of the colour is proportional to the fractional anisotropy • It is 3D modeling technique used to visually represent neural tracts using data collected by diffusion tensor imaging (DTI) • Voxels are connected based upon similarities in the maximum diffusion direction. Figure Source: www.radiopaedia.org Matlab Code available with Arush, MIRC
- 38. ADC map computa'on b=0 b=100 b=200 b=500 b=1000 Signal intensity decreasing with increase in b-value ADC map scanner ADC map matlab
- 41. Figure source: Nucifora et al. Radiology 245:2 (2007) Corticospinal Tracts -ProbabilisticCorticospinal Tracts - Streamline 1.Streamline tractography • Connects neighbouring voxels from user defined voxels (seed regions) • Tracts are traced until termination criteria are met. 2.Probabilistic tractography • Value of each voxel in the map is the probability the voxel which is in the diffusion path between the ROIs. • It provides quantitative probability of connection at each voxel • Allows tracking into regions where there is low anisotropy.
- 42. Degree of anisotropy Streamline tractography Probabilistic tractography Figure source :Nucifora et al. Radiology 245:2 (2007)
- 43. • It has been well established that magne'c resonance imaging (MRI) provides cri'cal informa'on about cancer [3] • Magne'c resonance spectroscopic imaging (MRSI) furthers this capability by providing informa'on about the presence of certain ‘metabolites’ which are known to be important prognos'c markers of cancer [4] (stroke, AD, energy metabolism, TCA cycle) • MRSI provides informa'on about the spa'al distribu'on of these metabolites, hence enabling metabolic imaging [3] Huk WJ et al., Neurosurgical Review 7(4) 1984; [4] Preul MC et al., Nat. Med. 2(3) 1996; Metabolic imaging: applica'ons CANCER NORMAL [5] H Kugel et al., Radiology 183 June 1992 MIRC 43 [5]
- 44. • 3D- PRESS makes it possible to localize the signal in the voxel formed by the intersection of the three slices Figure 7: Display of the volume of interest (voxel) located at the intersec8on of the slices [3]*
- 45. Spectroscopic Imaging Methods • Spectroscopic Imaging methods map spa'al distribu'on of components with different chemical shi}s • This imaging is a combina'on of spa'al ad spectral imaging • Goal : To obtain NMR spectrum at each spa'al posi'on/ to display an image of each chemical shi} 1. 3D Fourier Transform Spectroscopic Imaging: RF GZ Gy Gx DAQ Figure 4: 3D Fourier Transform Spectroscopic Imaging Sequence, Phase encoding in x and y is followed by data acquisi8on (DAQ) with gradients turned off 1* RF GZ Gy Gx DAQ TE 90 180 Figure 5: 3DFT Spin Echo Spectroscopic Imaging Sequence
- 47. • Long acquisi'on 'mes for MRSI • A typical MRSI protocol (32 X 32 X 512) takes ~ 10-12 minutes • Difficult to maintain anatomical posture for long 'me • Increases pa'ent discomfort, likelihood of early termina'on of study • Discourages rou'ne clinical use of this powerful MRI technique • To increase throughput (decreased scanner 'me, technician 'me) • Reduc'on of acquisi'on 'me is usually accomplished by under-sampling measured data (k-space) • Limita'ons of Shannon-Nyquist criterion • Compressed sensing provides a framework to achieve sub- Nyquist sampling rates with good data fidelity CS-MRSI: Need for accelera'on MIRC 47 kx ky x y 3D FT
- 48. Brain - normal (N=6) Brain - cancer (N=2) Prostate -cancer (N=2) MRSI data Scanner TR(ms) TE(ms) # Averages Grid Size FOV (mm3) Brain - normal (N=6) Siemens 3.0T Trio Tim 1700 270 4 16 x 16 x 1024 100 x 100 x 15 Brain cancer (N=2) Philips 3.0T Achieva 1000 112 112 2 2 18 x 21 x 1024 19 x 22 x 1024 180 x 210 x15 190 x 220 x 15 Prostate cancer (N=2) Philips 3.0T Achieva 1200 1000 140 140 1 1 14 x 10 x 1024 16 x 12 x 1024 25 x 50 x 33 20 x 51 x 26 In silico and in vitro phantom studies reported in [6] Geethanath et. al., SPIE Medical Imaging 2010 [7] Geethanath et al., Radiology. 2012 MRSI: acquisi'on parameters MIRC 48 [7]
- 49. Applica'on of CS to MRSI MIRC 49 • Signal model of a free-induc'on decay with N (3 in this case) metabolites • The sparsely measured Fourier data is represented by y, Object to be es'mated is in (x, y, f) space is m • Undersampling in x-y dimensions vs x-f dimension • Problem defini'on: • Find the sparsest transform coefficients of m that provides for data consistency between Fourier coefficients measured and es'mated, at sampled loca'ons (2) argminm∥Fu(m)-y∥2 2+λ∥ψ(m)∥1 (3) (1)
- 50. Processing So=wares: [1] jMRUI: It is a software that can be used to process MRSI data. The spectra are typically subjected to the following processing steps in jMRUI [5]: (a) Apodization to remove existing truncation artifacts, (b) baseline correction, (c) time-domain Hankel-Lanczos singular value decomposition filtering of residual water and fat peaks, (d) Phase Correction, (e) Frequency Shift. 5*
- 51. [2] VeSPA: It is a open source software for MRS applications. It supports four applications: 1. RFPulse (for RF pulse design), 2. Simulation (for spectral simulation), 3. Priorset (for creating simulated MR spectroscopic data) 4. Analysis (for spectral data processing and analysis) 6* Cr2 3.916 Cho 3.186 Cr 3.03 NAA 2.008 Lipids 0.9-1.4 Gln, Glu, GABA 2.12-2.42 Figure 8: Spectra simulated using VeSPA soVware with major metabolites of brain
- 53. [7] Geethanath et al., Radiology. 2012 Brain cancer 1X 2X 5X 10X Prostate cancer Normal CancerNormal Cancer NAACr ChoNAA Cr Cho Cr2 Cr2 Cr Cho Cit Cit Cho + Cr CS-MRSI: Cancer results MIRC 53
- 54. Brain - cancer Prostate - cancer Brain - Normal Brain - Normal Brain - cancer Prostate - cancer CS-MRSI: Metabolite maps MIRC 54 [7] Geethanath et al., Radiology. 2012
- 55. Limita'ons of PRESS • Conventional slice-selective 180 refocusing pulses do not have particularly good slice profiles, leading to non-uniform metabolite excitation and signal generation from outside PRESS box • By definition, it restricts excitation to a rectangular volume, but brain has a curved, elliptical shape – difficult to obtain signal from cortical regions close to the skull • 3DPRESS-MRSI sequence - scan-time becomes very long if high spatial resolution in all three directions is required (number of PE gradients to be recorded becomes very high since encoding is performed in all three directions, hence giving long scan times) • Difficulty of obtaining sufficient magnetic field homogeneity for large spatial coverages [4]*
- 56. Schizophrenia: - In a study [7], it is shown that using proton MRSI, in case of patients with schizophrenia, there will be a relative loss of signal from N-acetyl- containing compounds (NAA) - Patients with schizophrenia, when compared as a group to normal controls, show a consistent 1H-MRSI pattern of group differences, i.e., bilateral reductions of NAA/CRE and NAA/CHO in HIPPO and DLPFC; - 1H-MRSI data in both patients and controls do not show significant changes over a period of 90 days; however, absolute metabolite ratios in individuals show low predictability over this time interval; - 1H-MRSI data show relatively low variability (as measured by the coefficients of variation (CVs)) both in patients and normal controls, especially for NAA/ CRE and CHO/CRE. 7*
- 57. Mild Cogni've Impairment: - Mild cognitive impairment (MCI) is a clinical state between normal aging and Alzheimer's disease (AD) - In a study [8], 1H-MRS findings were compared in the superior temporal lobe, posterior cingulate gyri and medial occipital lobe among 21 patients with MCI, 21 patients with probable AD, and 63 elderly controls - Results showed that, NAA /Cr ratios were significantly lower in AD patients compared to both MCI and normal control subjects in the left superior temporal and the posterior cingulate VOI - Myoinositol (MI) /Cr ratios measured from the posterior cingulate VOI were significantly higher in both MCI and AD patients than controls - Cho /Cr ratios measured from the posterior cingulate VOI were higher in AD patients compared to both MCI and control subjects 8*
- 58. • Increased informa'on content but at cost of increased acquisi'on 'me • Provides richer insight into the pathophysiology and direct impact on therapeu'c design • Mul'ple open-source tools available – jMRUI and Vespa • Increased clinical research in neuro-,breast, prostate, cardiac (murine) and liver • Ac've area of research – development of PSD and recon Summary MIRC 58
- 59. References [1] Nishimura, Dwight George. Principles of magnetic resonance imaging. Stanford University, 1996. [2] SG Dissertation [3] Theoretical background: MRI and MRS [4] Peter B. Barker et al., “In vivo proton MR spectroscopy of the human brain”, Progress in Nuclear Magnetic Resonance Spectroscopy 49 (2006) 99–128 [5] A. Naressi, et al. Java-based graphical user interface for MRUI, a software package for quantitation of in vivo/medical magnetic resonance spectroscopy signals. Computers in Biology and Medicine, 31(4), 269-286 (2001) [6] https://scion.duhs.duke.edu/vespa/ [7] Alessandro Bertolino et al., “Reproducibility of Proton Magnetic Resonance Spectroscopic Imaging in Patients with Schizophrenia”, Neuropsychopharmacology 1998 [8] K. Kantarci et al., “Regional Metabolic Patterns In Mild Cognitive Impairment And Alzheimer's Disease A 1h Mrs Study”, Neurology. 2000
- 60. Acknowledgement • People § Prof. Vikram D. Kodibagkar § Prof. Joseph V. Hajnal § Colleagues at UT Southwestern § Colleagues at ICL § Students at MIRC & radiologists at Sagar Hospital § Collaborators from § UMN § Oxford § GE Healthcare (Dr. Ramesh Venkatesan) § ASU § IISc § NIMHANS § Philips Healthcare • Funding § Pilot grant (PI: Kodibagkar) from UL1RR024982, (PI: Milton Packer) § ARP#010019-0056-2007 (PI: Kodibagkar) § R21CA132096-01A1 (PI: Kodibagkar) § W81XWH-05-1-0223 (PI: Kodibagkar) § R21 CA139688 (PI: Corum) § S10 RR023730 (PI: Garwood) § P41 RR008079 (PI: Garwood) § MRI India Na'onal Mission grant – SCANERA (co-PI: Geethanath) from DEITY § DST-TSD grant and Wipro GE Healthcare (PI: Geethanath) § KFIST grant (PI: Geethanath) MIRC 60
- 62. References • [1] M. Kass et al. Interna'onal Journal of Computer Vision, 1988. • [2] Hand book of MRI Pulse Sequences, M. A. Bernstein • [3] M. Grant and S. Boyd disciplined convex programming. • [4] M. Lus'ng et. al. MRM, 2007 • [5]A. S. Konar et al., Journal of Indian Ins'tute of Science, 2014. MIRC 62
- 63. Acknowledgement • People § Dr. Vikram D. Kodibagkar § Dr. Joseph V. Hajnal § Students at MIRC § MRSI project § Hyeonman Baek, Ph.D. § Ma"hew Lewis, Ph.D. § Sandeep K. Ganji, B. Tech. § Yao Ding, M.S. § Robert D. Sims, M.D. § Changho Choi, Ph.D. § Elizabeth Maher, M.D., Ph.D. • Funding § Pilot grant (PI: Kodibagkar) from UL1RR024982, (PI: Milton Packer) § ARP#010019-0056-2007 (PI: Kodibagkar) § R21CA132096-01A1 (PI: Kodibagkar) § W81XWH-05-1-0223 (PI: Kodibagkar) § R21 CA139688 (PI: Corum) § S10 RR023730 (PI: Garwood) § P41 RR008079 (PI: Garwood) § MRI India Na'onal Mission grant – SCANERA (co-PI: Geethanath) § DST-TSD grant and Wipro GE Healthcare (PI: Geethanath) § KFIST grant (PI: Geethanath) § ROICS project § Amaresh Konar, M.Tech § Shashikala, M.Tech § Shivaraj, M.Tech § Rashmi Rao, B.E. § Barjor Gimi, Ph.D. § Steen Moeller, Ph.D. § Julianna Czum, MD § RUSL/Go-Ac've project § Amaresh Konar, M.Tech § Pavan Poojar, M.Tech § Nutan Dev, B.E. § Smera Lingesh, M.Tech § Ramesh Venkatesan, D.Sc § Smt. Prema, B.A. § Shilpa D. , M.S. MIRC 63
- 64. MIRC 64