Unlocking the Power of ChatGPT and AI in Testing - A Real-World Look, present...
Trend line
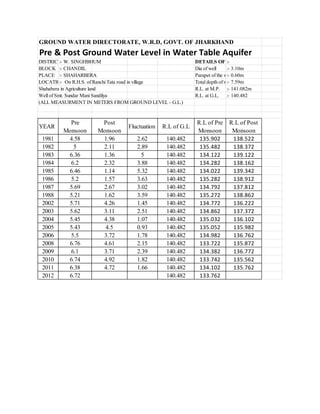
1. GROUND WATER DIRECTORATE, W.R.D, GOVT. OF JHARKHAND
Pre & Post Ground Water Level in Water Table Aquifer
DISTRICT W. SINGHBHUM
:BLOCK :- CHANDIL
PLACE :- SHAHARBERA
LOCATION On R.H.S. of Ranchi Tata road in village
:Shahabera in Agriculture land
Well of Smt. Sundar Mani Sandilya
(ALL MEASURMENT IN METERS FROM GROUND LEVEL - G.L.)
YEAR
1981
1982
1983
1984
1985
1986
1987
1988
2002
2003
2004
2005
2006
2008
2009
2010
2011
2012
Pre
Monsoon
4.58
5
6.36
6.2
6.46
5.2
5.69
5.21
5.71
5.62
5.45
5.43
5.5
6.76
6.1
6.74
6.38
6.72
Post
Monsoon
1.96
2.11
1.36
2.32
1.14
1.57
2.67
1.62
4.26
3.11
4.38
4.5
3.72
4.61
3.71
4.92
4.72
Fluctuation
R.L of G.L
2.62
2.89
5
3.88
5.32
3.63
3.02
3.59
1.45
2.51
1.07
0.93
1.78
2.15
2.39
1.82
1.66
140.482
140.482
140.482
140.482
140.482
140.482
140.482
140.482
140.482
140.482
140.482
140.482
140.482
140.482
140.482
140.482
140.482
140.482
DETAILS OF THE WELL
:Dia of well
:- 3.10m
Parapet of the well
:- 0.60m
Total depth of well from G.L.
:- 7.59m
R.L. at M.P. :- 141.082m
R.L. at G.L.
:- 140.482
R.L of Pre
Monsoon
135.902
135.482
134.122
134.282
134.022
135.282
134.792
135.272
134.772
134.862
135.032
135.052
134.982
133.722
134.382
133.742
134.102
133.762
R.L of Post
Monsoon
138.522
138.372
139.122
138.162
139.342
138.912
137.812
138.862
136.222
137.372
136.102
135.982
136.762
135.872
136.772
135.562
135.762
2.
3. DISTRICT E. SINGHBHUM
:BLOCK :- CHAKULIA
PLACE :- MANUS-MURIA
LOCATION
:- R.H.S. of Bahragoda Chkulia Road in
Agricultural land Big-dia Well.
DETAILS OF THE :WELL
Dia of well
:- 6.10m
Parapet of the well :- 0.85m
Total depth of well from6.65m
:- G.L.
R.L. at M.P.
:- 86.366m
R.L. at G.L.
(ALL MEASURMENT IN METERS FROM GROUND LEVEL - G.L.)
YEAR
1981
1982
1983
1984
1985
1986
1987
1988
2004
2006
2008
2009
2010
2011
2012
Pre
Monsoon
1.15
1.8
3.15
4.13
3.56
3.15
3.22
5.2
5.01
5.25
6.58
5.21
5.95
9.1
8.38
Post
Monsoon
0.35
2.5
0.63
0.33
0.3
0.35
0.75
1.29
3.41
3.53
1.53
2.55
4.38
5.76
Fluctuation
0.8
-0.07
2.52
3.8
3.26
2.8
2.47
3.91
1.6
1.72
5.05
2.66
1.57
3.34
R.L of G.L
0
0
0
0
0
0
0
0
0
0
0
0
0
0
0
R.L of Pre
Monsoon
1.15
1.8
3.15
4.13
3.56
3.15
3.22
5.2
5.01
5.25
6.58
5.21
5.95
9.1
8.38
R.L of Post
Monsoon
0.35
2.5
0.63
0.33
0.3
0.35
0.75
1.29
3.41
3.53
1.53
2.55
4.38
5.76
4. 10
9
8
7
R.L of Pre Monsoon
6
5
R.L of Post Monsoon
4
3
2 per. Mov. Avg. (R.L of Pre
Monsoon)
2
2 per. Mov. Avg. (R.L of Post
Monsoon)
1
TIME (YEAR)
2012
2011
2010
2009
2008
2006
2004
1988
1987
1986
1985
1984
1983
1982
0
1981
REDUCED LEVEL (METER)
FLUCTUATION OF PRE AND POST MONSOON
WATER TABLE
5. FLUCTUATION OF PRE AND POST MONSOON WATER TABLE
405
REDUCED LEVEL (METERS)
404
403
402
401
400
399
398
397
396
TIME (YEARS)
R.L OF PRE MONSOON
R.L OF POST MONSOON
2 per. Mov. Avg. (R.L OF PRE MONSOON)
2 per. Mov. Avg. (R.L OF POST MONSOON)