Seig seminar 2014 - A Smarter Way to Lower Emissions - Kenny Bissett
•
1 like•475 views

Kenny Bissett presentation - Local Solutions, managing traffic in Fife

Recommended
Recommended
More Related Content
What's hot
What's hot (20)
Similar to Seig seminar 2014 - A Smarter Way to Lower Emissions - Kenny Bissett
Similar to Seig seminar 2014 - A Smarter Way to Lower Emissions - Kenny Bissett (20)
More from STEP_scotland
More from STEP_scotland (20)
Recently uploaded
Recently uploaded (20)
Seig seminar 2014 - A Smarter Way to Lower Emissions - Kenny Bissett
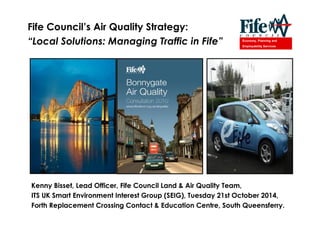
- 1. Economy, Planning and Employability Services Kenny Bisset, Lead Officer, Fife Council Land & Air Quality Team, ITS UK Smart Environment Interest Group (SEIG), Tuesday 21st October 2014, Forth Replacement Crossing Contact & Education Centre, South Queensferry. Fife Council s Air Quality Strategy: Local Solutions: Managing Traffic in Fife
- 2. Economy, Planning and Employability Services Content Background Review & Assessment Cupar & Dunfermline AQMAs Air Quality Action Plans Traffic Management Measures Strategic Measures Best Practice Deadly smog leaves us gasping for breath: Millions of asthmatics struggle as giant cloud of Saharan sand and toxic air covers Britain Daily Mail 3rd April 2014
- 3. Economy, Planning and Employability Services Background (1) Air pollution is now the world s largest single environmental health risk Reducing air pollution could save millions of lives. World Health Organisation (March 2014) (2) Government statistics estimate that air pollution in the UK reduces the life expectancy of every person by an average of 7 8 months, with an associated cost of up to £20 billion each year Scottish Government Air Quality Website (March 2014) (3) The higher attributable fractions of deaths associated with PM2.5 pollution mirrors the higher estimated levels of PM2.5 in the urban city areas within Scotland. HPS/NHS Report Air Quality (PM2.5 particulate air pollution)) and Mortality in Scotland (April 2014)
- 4. Economy, Planning and Employability Services Responsibilities Environment Act 1995 and Air Quality Regulations 2000 - Review and assessment of local air quality - Prescribed air quality standards and objectives - Short (1hr/24 hour) & long term objectives (annual mean) - Based on human health effects mainly cardiopulmonary - Includes monitoring at busiest roads/junctions - Production of annual air quality reports - PG & TG 09 - Declaration of Air Quality Management Areas (AQMAs) - Air Quality Action Plans (AQAPs)
- 5. Economy, Planning and Employability Services Pollutants Air Quality (Scotland) Regulations 2000 (as amended) - Benzene - 1,3 Butadiene - Carbon monoxide - Lead - Nitrogen dioxide (NO2) - PM10 (respirable fraction of particles) - Sulphur dioxide Each of these have prescribed objectives PM2.5 particulate fraction to be included shortly Key air quality issue for majority of local authorities NO2 and PM10 from road vehicle emissions Over 250 AQMAs in UK - most for NO2 and PM10
- 6. Economy, Planning and Employability Services Objectives Key AQS objectives for Fife Council are annual mean NO2 & PM10 concentrations Annual mean objective for NO2 is 40 µg m-3 and for PM10 is 18 µg m-3
- 7. Economy, Planning and Employability Services Monitoring and Assessment Monitors located at busy roads especially narrow and congested streets Passive monitors - 48 NO2 diffusion tube sites Automatic Monitors - NO2 and PM10 (1) Admiralty Road, Rosyth (2) Appin Crescent, Dunfermline (3) Bonnygate, Cupar (4) St Clair Street, Kirkcaldy (5) Mobile Monitor Survey (1) to (4) Dispersion Modelling simple (spreadsheet) and complex (software)
- 8. Economy, Planning and Employability Services Air Quality Management Areas AQMAs are essentially air pollution zones One or more of objectives exceeded 14 authorities in Scotland have AQMAs Over 30 AQMAs in Scotland Most are for NO2 and PM10 Majority as result of road traffic pollution Fife has two AQMAs (1) Bonnygate, Cupar (2) Appin Crescent, Dunfermline
- 9. Economy, Planning and Employability Services Kingdom of Fife CUPAR WELCOMES YOU Fife is Scotland s third largest local authority area by population at 367, 000 Population of Cupar is 9,000 (rural) & Dunfermline is 50,000 (urban) DUNFERMLINE HASTE YE BACK
- 10. Economy, Planning and Employability Services Bonnygate & Appin Crescent AQMAs Bonnygate, Cupar & Appin Crescent, Dunfermline (1) Busy (> 10, 000 AADT) roads; (2) Narrow & congested roads and; (3) Street Canyons trap pollutants Extensive monitoring and modelling NO2 & PM10 exceedances Bonnygate AQMA declared 2008 administrative based area Appin Crescent AQMA declared 2011- pollutant based area Air quality action plan in 12-18 months Set of measures to tackle the problem
- 11. Economy, Planning and Employability Services Air Quality Action Plans Bonnygate Air Quality Action Plan 2010 & Appin Crescent Action Plan 2013 Produced following extensive consultation process including local communities Prioritised set of measures for working towards meeting air quality objectives Focus on traffic management measures for purposes of this presentation
- 12. Economy, Planning and Employability Services Traffic Management in Cupar Market town not a major city Population of almost 9, 000 Serves a wide agricultural catchment Not an obvious candidate for AQMA but .. Non-bypassed On primary road network (A91 & A914) Focal point for local road network Fife Council Local Transport Strategy Over half of all trips in Cupar are local (less than 2 miles)
- 13. Economy, Planning and Employability Services A91 A914 Bonnygate Road Network A91 from Stirling to St Andrews (AADT 10, 500 vehicles) A914 from Central/West Fife areas (AADT 4, 700 vehicles)
- 14. Economy, Planning and Employability Services Bonnygate Monitoring Seven sites includes triplicate tubes co-located with automatic monitor High buildings either side near to Bonnygate/Crossgate street canyon effect
- 15. Economy, Planning and Employability Services Traffic Management Measures Bypasses/relief roads not the only solution expensive & might relocate problem! Cost effective traffic queue relocation scheme introduced in Bonnygate in 2009 Co-ordinated system of traffic lights (SCOOT) & pedestrian crossings Relocates traffic queue westwards outside street canyon and improves traffic flow Before & after dispersion modelling plots show noticeable decrease in pollutant levels
- 16. Economy, Planning and Employability Services NO2 Concentrations Bonnygate Traffic queue relocation system introduced 2009 decline in NO2 concentrations maintained following construction in 2009 Similar improvements observed for NO2 diffusion tube concentrations
- 17. Economy, Planning and Employability Services PM10 Concentrations Bonnygate Decline from 23 µg m-3 to borderline reading of 18 µg m-3 for PM10 in 2012/13 Indications that annual mean PM10 objective may be increased to 20 µg m-3
- 18. Economy, Planning and Employability Services Bonnygate Gap Site Buildings in 26/32 Bonnygate demolished in 2010 Ventilation from gap site creating AQ improvements? Concerns from public regarding filling the gap Two development scenarios proposed - With/without vennel in buildings Computational Fluid Dynamics (CFD) air quality modelling study in 2012 Useful for narrow streets with high volumes of traffic including influence of wind direction Difference in the NO2 concentrations for the filled gap site or vennel site scenarios considered to be insignificant
- 19. Economy, Planning and Employability Services Cupar Street Scene Project Two traffic management design options considered in Cupar Town Centre in 2013: Design Option 1 - mini-roundabouts at East Bridge/St Catherine Street and controlled pedestrian crossings Design Option 2 - reconfiguration of junctions at East Bridge/St Catherine Street including fixed cycle time pedestrian crossings Modelled to predict potential impact on air quality in Bonnygate AQMA Traffic flow & speed data from S-PARAMICS traffic micro-simulation model which simulates behaviour of individual vehicles within a road network
- 20. Economy, Planning and Employability Services Cupar Street Scene Outcomes Modelling of air quality impacts of Design Options 1 (mini roundabouts) & 2 (junction reconfiguration) using ADMS Roads modelling software Used annual mean NO2 & PM10 concentrations for 2012 baseline year & 2017 future scenarios Design Options 1 and 2 will lead to a general reduction in NOx and PM10 emissions in Bonnygate AQMA However, in general, it is Option 1 (mini roundabout scheme) that offers the greater air quality improvements than Option 2 Option 1 completed in September 2014 & on-going monitoring and assessment to confirm modelling outputs
- 21. Economy, Planning and Employability Services Appin Crescent Traffic Management One of key Appin Crescent AQAP measures is optimisation of the traffic management system in Appin Crescent area Main issues at Appin Crescent are: (1) emissions associated with high baseline traffic flows (AADT 20,000 vehicles); (2) low average vehicle speeds during peak periods and; (3) poor pollutant dispersion as residential properties located near to roadside Feasibility study (FS) of traffic management measures - in terms of delivery of air quality improvements - undertaken in 2013-2014
- 22. Economy, Planning and Employability Services Appin Crescent FS Inputs Dispersion modelling of traffic management (TM) options (ADMS Roads) Modelling of annual mean NO2 & PM10 concentrations for 2011 baseline year and 2015 future scenarios Three TM options vs 2015 future do nothing scenarios: (1) Slip Lane Options - Dedicated left hand slip lane from Appin Crescent - Turning south into St Margaret s Drive (A823) (2) Appin Crescent Bypass - Referred to in local plan - Hypothetical road design to bypass Appin Crescent (3) Halbeath Park and Choose - Park and Choose development to east of Dunfermline (2013) - AADT both east & westbound reduce by 300 vehicles per day
- 23. Economy, Planning and Employability Services Appin Crescent FS Outputs None of the modelled slip road scenarios reduce concentrations of NO2 and PM10 on Appin Crescent to below AQOs Improves traffic flows approaching from the north heading south but little benefit to the traffic travelling westbound in AQMA Slip road options show air quality improvement at locations very close to the roundabout but not at Appin Crescent itself Only the bypass scenario offers a solution in terms of securing AQOs but a costly measure & unlikely in the short-term future. Look at alternative short- to medium term cost effective traffic management measures
- 24. Economy, Planning and Employability Services Appin Crescent FS Traffic Signalling The traffic management options currently being investigated in 2014-2015: (1) Optimise signal phasing around Sinclair Gardens Roundabout - improve traffic flow including traffic approaching from east along Appin Crescent (2) Signalise the Garvock Hill roundabout - displacing slow moving/queuing traffic eastwards to Halbeath Road (3) Small scale interventions relocation of bus stops Modelling using 2013 traffic counts monitoring data & scenario analyses
- 25. Economy, Planning and Employability Services Appin Crescent Lane Markings Highest NO2 exceedances at South side of Appin Crescent Buildings nearer the kerbside relative to North side Traffic surveys indicated that middle lane approaching Sinclair Gardens roundabout from Appin Crescent was being underused Road lane markings revised in March 2013 Revised lane markings encourage use of middle lane Three NO2 tube site exceedances in 2012 Only one NO2 tube site marginal exceedance in 2013 Need further monitoring to confirm these results
- 26. Economy, Planning and Employability Services Partnerships Air Quality Strategy Fife Council Air Quality Strategy 2015-2020 To be submitted for Committee approval in 2015 Further integration of air quality issues into transportation, planning and climate change policies & strategies Includes encouraging and adopting partnership approaches for improving air quality Encourage community engagement on air quality issues and provide a service that meet the needs of customers Ensure consistency with Scottish Government Low Emissions Strategy for Scotland which is expected to be published in 2015 AND MORE
- 27. Economy, Planning and Employability Services Best Practice A good example of a thorough approach in developing an action plan which includes comprehensive links to transport policy and sustainable travel DEFRA Best Practice Website Bonnygate Cupar Air Quality Action Plan 2010 An example of best practice LAQM Appraisal Team for Fife Council Air Quality Annual Reports 2013 & 2014 Fife Council is making excellent progress on the implementation of its action plan in Cupar Minister for Environment and Climate Change - Scottish Government March 2014
- 28. Economy, Planning and Employability Services Contacts Land & Air Quality Team Kenny Bisset kenny.bisset@fife.gov.uk Eloise Griffin eloise.griffin@fife.gov.uk Donald Payne donald.payne@fife.gov.uk Jim Robb jim.robb@fife.gov.uk Blair Falconer blair.falconer@fife.gov.uk Fife Direct Air Quality Web Pages www.fifedirect.org.uk/airquality and; Air Quality Queries can also be directed to air.quality@fife.gov.uk -Thank you for listening! -Any Questions?