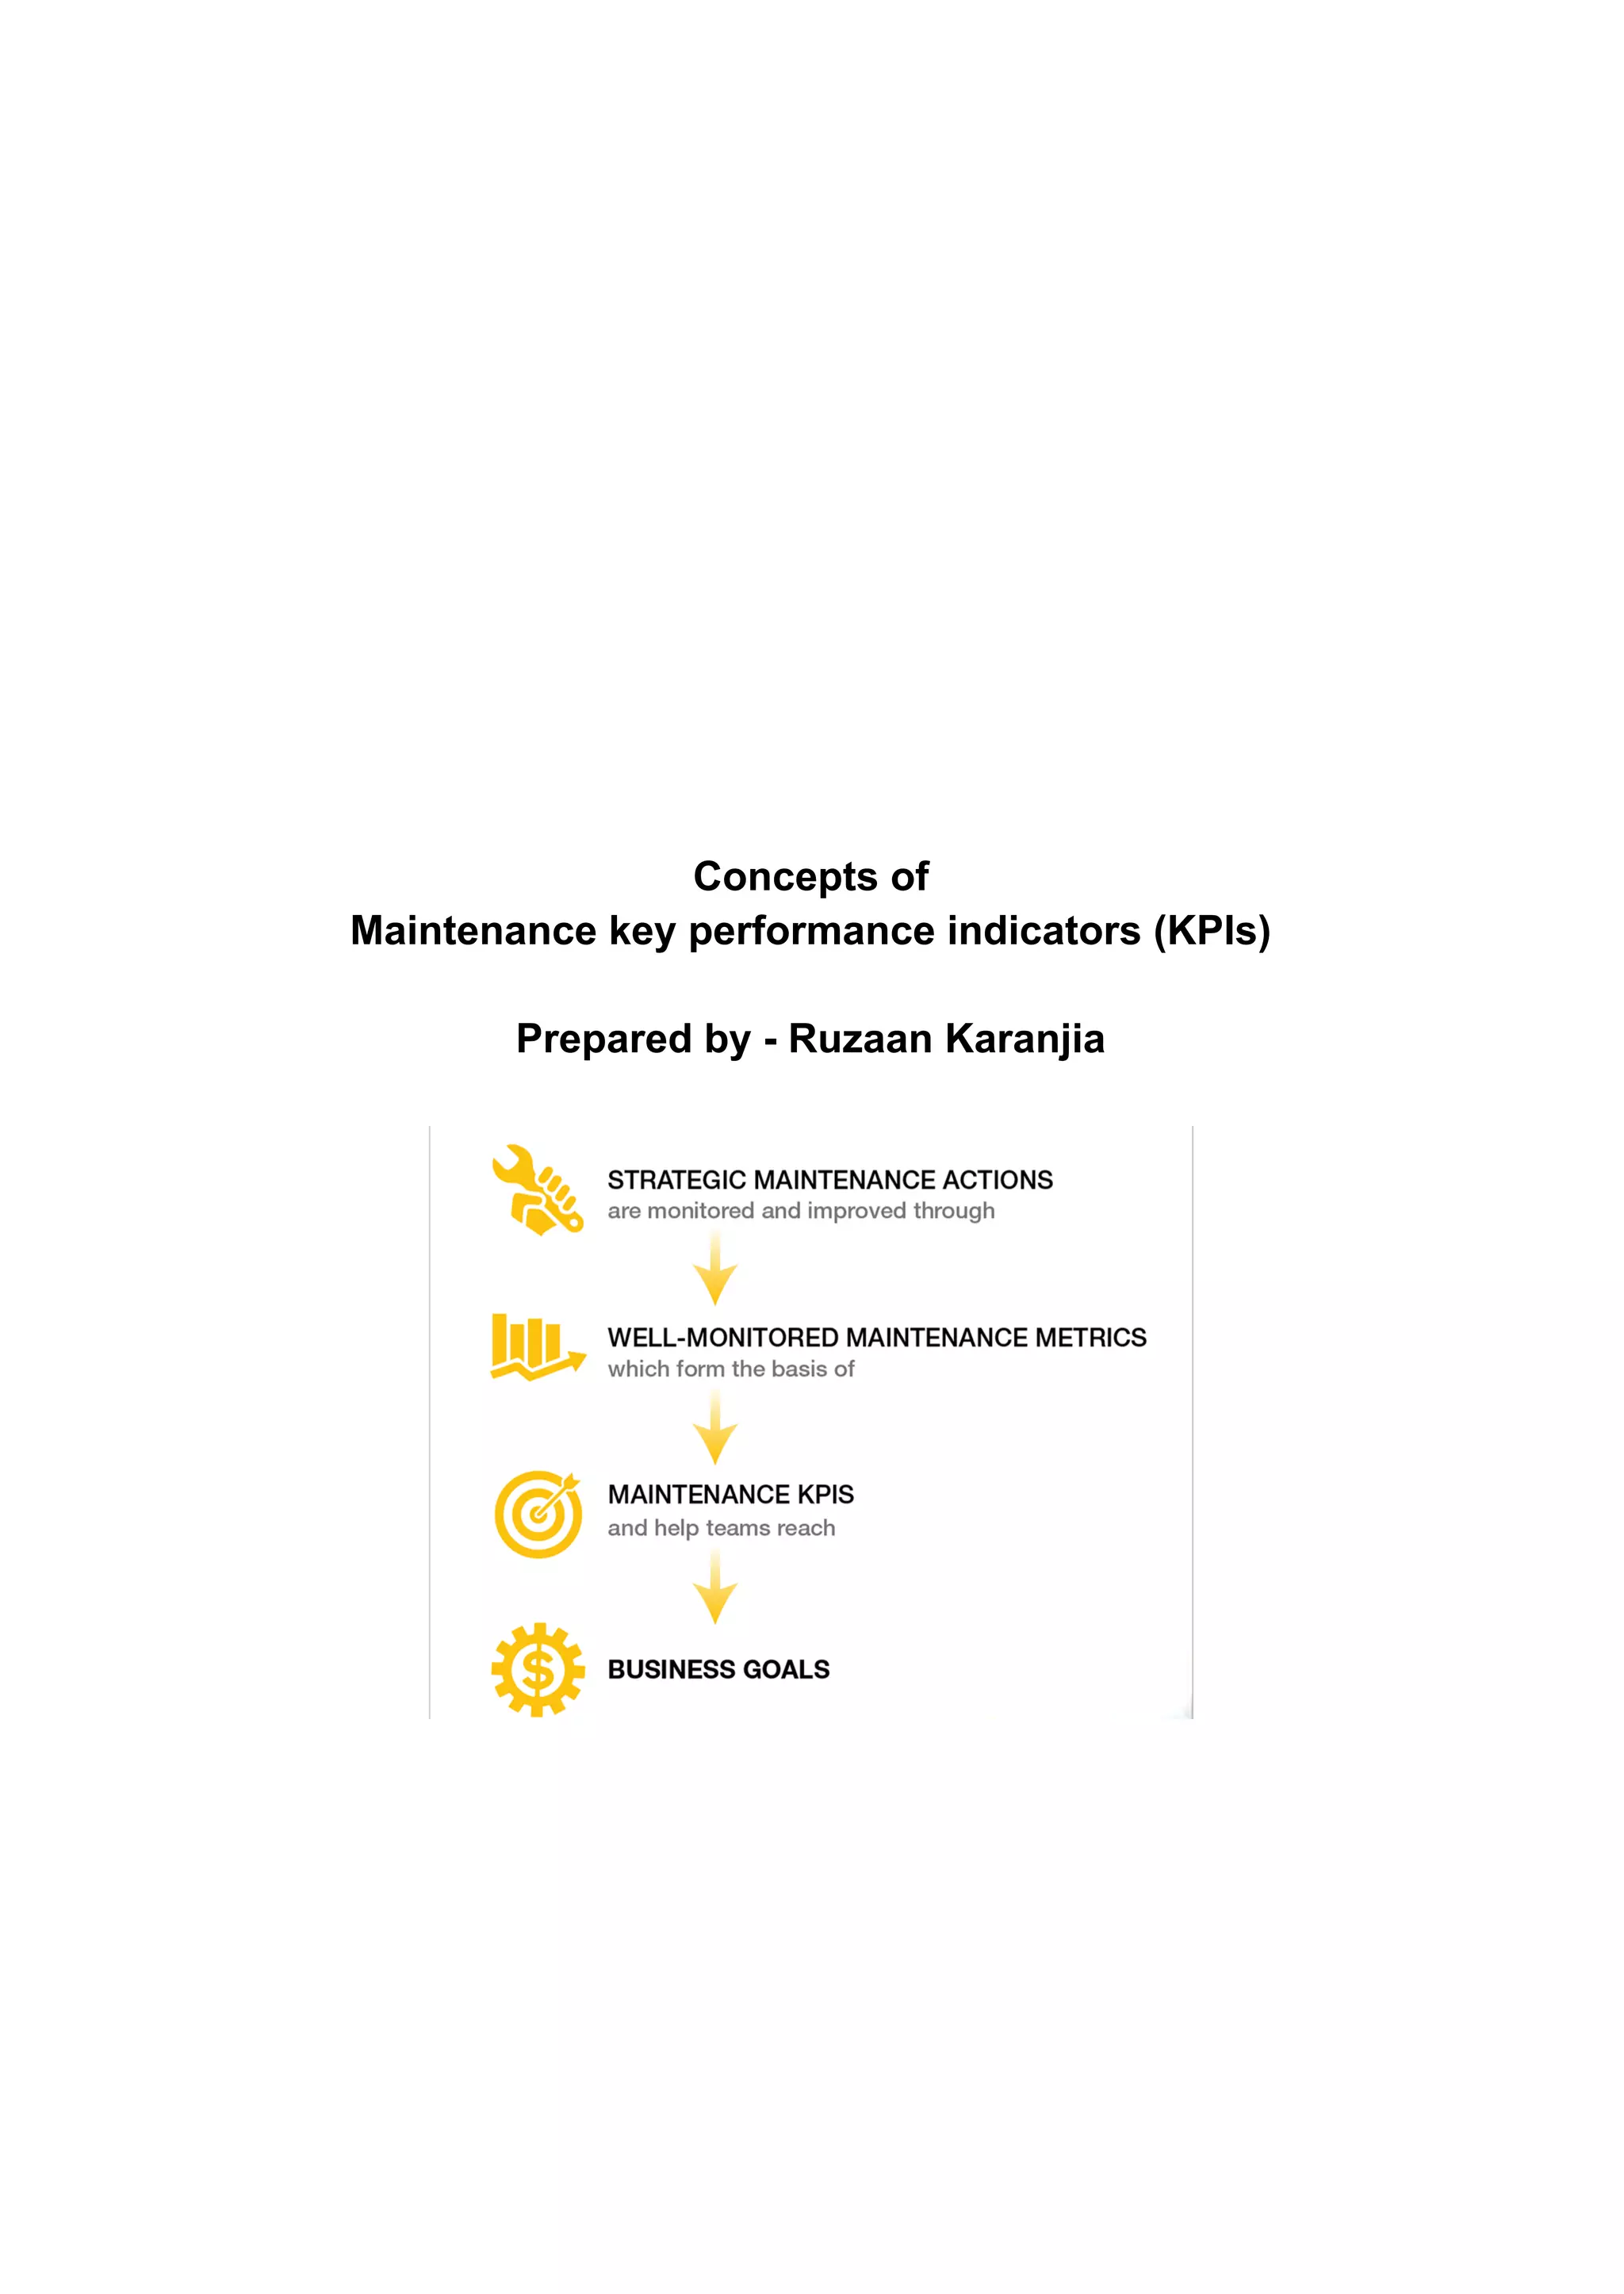
This document consists of complete concepts of Maintenance Key Performance Indicators (KPIs)
which includes various topics:
1) Maintenance KPIs
2) Maintenance KPIs vs Maintenance Performance Metrics
3) How to Implement Maintenance KPI Goals and eMaint CMMS
4) Develop Maintenance KPIs with SMART Goals
Important Examples of Maintenance KPI Metrics to Benchmark and Track
5) Maintenance Backlog
6) Mean Time To Repair (MTTR)
7) Mean Time Between Failures (MTBF)
8) Overall Equipment Effectiveness (OEE)
9) PM Compliance
10)Planned Maintenance Percentage
2. Table of Content
● Maintenance Key Performance Indicators (KPIs)
● Maintenance KPIs vs Maintenance Performance Metrics
● How to Implement Maintenance KPI Goals and eMaint CMMS
● Develop Maintenance KPIs with SMART Goals
● Important Examples of Maintenance KPI Metrics to
Benchmark and Track
● Maintenance Backlog
● Mean Time To Repair (MTTR)
● Mean Time Between Failures (MTBF)
● Overall Equipment Effectiveness (OEE)
● PM Compliance
● Planned Maintenance Percentage
3. Maintenance key performance indicators (KPIs)
Maintenance key performance indicators (KPIs) are metrics that
evaluate factors critical to an organization’s success. A wide array of
businesses tracks KPIs. However, in the maintenance world, these
metrics monitor performance against goals tied to things like machine
failures, repair times, maintenance backlogs, and costs.
One of the best ways to track maintenance KPIs is by using
Computerized Maintenance Management Software (CMMS). With
CMMS, users can develop baselines that measure and expose
opportunities for improvement. Using CMMS can be the difference
between organizations exceeding or falling short on maintenance KPIs.
Maintenance KPIs vs Maintenance Performance Metrics
Simply put, maintenance KPIs track an organization’s success at
meeting its goals. Are you cutting costs and reducing downtime? KPIs
offer the ground truth on your journey toward continuous improvement.
As the saying goes, “Measure What You Treasure.”
There are a few different categories of maintenance KPIs such as,
leading and lagging indicators. A leading indicator signals future events
and includes metrics like Preventative Maintenance Compliance or
Estimate vs. Actual Performance. Lagging indicators include
maintenance metrics like Mean Time Between Failure (MTBF) and Mean
Time to Repair (MTTR). The most comprehensive CMMS KPI tracking
includes a mix of both leading and lagging indicators.
Some common examples of maintenance KPIs include:
● Reducing Costs
● Reducing Failures
● Reducing Downtime
● Increasing Work Identification
● Increasing Work Planning
● More Effective Work Scheduling
● More Effective Work Execution
4. Maintenance performance metrics are another important factor to
consider in meeting your goals. While KPIs offer an objective measure of
progress on your most important goals, keeping a close eye on
maintenance performance metrics will help you succeed. Maintenance
performance metrics track the employees, machines, operations, and
inventory that influence whether you reach your goals.
CMMS offers an elite process for tracking maintenance performance
metrics and transforming that KPI data into meaningful reports and
dashboards. As a result, organizations gain both quantitative and
qualitative insight. Quantitatively, our system gives businesses the ability
to see their performance compared to their goals. Qualitatively, a
business can see how their performance compares to current
competitors in the “world-class maintenance” category.
How to Implement Maintenance KPI Goals and eMaint CMMS
Within eMaint CMMS, organizations can set and measure KPIs ranging
from the productivity of an individual to the overall performance against
budget across an entire department. The information that matters for
maintenance goals is different for every company, so it’s important to use
the top-down planning method to understand how every aspect of the
business affects reaching the goals set.
The CMMS organizes and presents the most relative and important
information in a way that makes your next action steps clear in one
space. When you purchase the eMaint CMMS, you also gain a
designated customer success manager to help with setup and answering
questions.
Below are a few examples showing how a company can leverage
eMaint’s work management and reporting tools to monitor and
benchmark maintenance KPIs.
XTO Energy, a producer of natural gas in the United States, was looking
for a CMMS because their former hand-written system resulted in
misplaced or unattended work requests. With eMaint, the company saw
5. an increase from 70% to 100% in work completion rates with no
additional staffing. They also always gained visibility of the work backlog.
Klein Plastics produces plastic products for manufacturers and major
suppliers of automotive parts, appliances, hand tools, and office
furniture. After implementing eMaint, Klein Plastics saw benefits of the
system including a 20% increase in overall Equipment Effectiveness,
and an improvement in consistency, communication, and productivity.
Develop Maintenance KPIs with SMART Goals
It’s important to implement maintenance KPIs with intention. That’s why
good CMMS uses S.M.A.R.T. goals (specific, measurable, achievable,
realistic, and timely). These terms are important factors to consider when
ensuring goals are met.
So, ask yourself: “Are my maintenance goals S.M.A.R.T.?”
Now, look through the terms as they apply to maintenance KPIs.
● Specific: What are the 5 W’s of the goal? (Who, What, When,
Where, Why)
● Measurable: What are the measurable and essential components
of the goal?
● Achievable: Have you or a competitor attained this goal in the
past?
● Realistic: Is reaching your goal practical in your current state?
● Timely: Did you map out the time it will take to obtain your goal?
6. Important Examples of Maintenance KPI Metrics to Benchmark and
Track
A Computerized Maintenance Management System (CMMS) tracks and
uses maintenance KPIs to establish, benchmark, and monitor all parts of
an organization’s goal. That’s why CMMS users experience visible
improvements in many areas, including:
● Maintenance Backlog
● Mean Time To Repair (MTTR)
● Mean Time Between Failures (MTBF)
● Overall Equipment Effectiveness (OEE)
● PM Compliance
● Planned Maintenance Percentage
● Maintenance Backlog
Maintenance Backlogs
Maintenance backlogs are an accumulation of maintenance work that
shows what needs to be dealt with based on safety issues or to prevent
breakdowns. This KPI is important because the longer work is not
completed, the greater the risk of more serious and costly failures.
The goal is to control backlog during normal operations and in
emergencies. Neglecting to track this maintenance KPI creates a lack of
visibility into the backlog. This can result in staffing challenges,
firefighting, and a lack of work prioritization.
7. Mean Time To Repair (MTTR)
Mean Time To Repair is a basic measure of the maintainability of
repairable items. It represents how long a piece of equipment is out of
production, or the average time required to repair a failed component or
device.
MTTR Calculation = Sum of Downtime Periods ÷ Number of Downtime
Periods = MTTR
MTTR can have a significant impact on the bottom line of an
organization and can mean missed orders and missing business
objectives. By tracking and monitoring this data, organizations can get a
better understanding of necessary staffing, inventory management, and
repair vs. replace decisions based on data. It also introduces a method
to understand how well an organization responds to repairs and
equipment problems.
8. Mean Time Between Failures (MTBF)
Mean Time Between Failures is the elapsed time between failures of a
system during operation. For critical pieces of equipment, MTBF is an
important way to discern the performance of an asset.
MTBF Calculation = Sum of (Start of Downtime – Start of Uptime)
Number of Failures
MTBF is an important way to quantify the reliability of an asset and
predict future performance. Organizations can optimize their
preventative maintenance schedules by carefully tracking this KPI and
associated performance metrics like downtime, uptime, and the number
of failures. Organizations can leverage MTBF to determine preventive
maintenance tasks such as rate of inspections or introduce preventive
actions such as lubrication, greasing, and calibrations. This can help to
avoid unexpected failures and reduce the risk of performing unneeded
maintenance on a piece of equipment.
9. Overall Equipment Effectiveness (OEE)
Overall Equipment Effectiveness evaluates how effectively a piece of
equipment is utilized. The OEE calculation is based on the three OEE
Factors:
Availability = Run Time / Planned Production Time
Performance = (Ideal Cycle Time × Total Count) / Run Time
Quality = Good Count / Total Count
To discover the total OEE for a particular piece of equipment:
OEE = Availability x Performance x Quality
OEE provides an informed, data-driven picture of how effectively your
maintenance processes are running based on critical factors such as
availability, performance, and quality of equipment. With a CMMS, it is
easy to track improvements over time.
10. Preventive Maintenance (PM) Compliance
Preventive Maintenance is work that is performed on a piece of
equipment on a predetermined schedulebased on elapsed time or usage
— to lessen the likelihood of it failing. Preventive maintenance is
performed while the equipment is still operational so that it does not
break down unexpectedly. PM Compliance is the percentage of
scheduled preventive work orders that are completed with a
predetermined time.
A good rule of thumb for PM Compliance is the 10% rule. This means
that PM tasks should be completed within 10% of the scheduled
maintenance interval. Monthly PMs should be completed within 3 days of
the due date. These measurements can give organizations a more
nuanced understanding of whether or not a PM program is effective.
Organizations can create reports based on compliance to offer
data-driven proof of this effectiveness. They can also create and a line of
sight into issues impacting your maintenance program.
11. Planned Maintenance Percentage
Planned Maintenance Percentage is the percentage of maintenance
hours spent on planned maintenance activities versus unplanned. This
percentage can be found by dividing the scheduled maintenance labor
hours into the total maintenance hours during a particular period.
“World-class maintenance” suggests that 90% of maintenance should be
planned. However, an 80% planned to 20% unplanned ratio is still
considered beneficial compared to the typical average of 55% or less.
Planned Maintenance Percentages can be easily tracked with an
effective CMMS.