
Recommended
Recommended
More Related Content
What's hot
What's hot (20)
Similar to Net Zero Energy Project
Similar to Net Zero Energy Project (20)
Recently uploaded
Recently uploaded (20)
Net Zero Energy Project
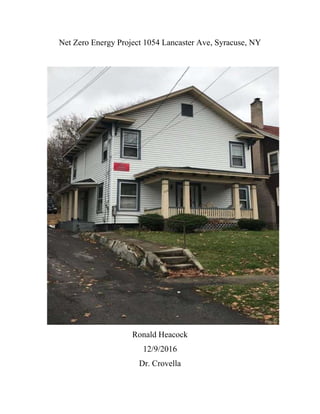
- 1. Net Zero Energy Project 1054 Lancaster Ave, Syracuse, NY Ronald Heacock 12/9/2016 Dr. Crovella
- 2. Table of Contents Table of Contents......................................................................................................................2 Introduction .................................................................................................................................3 Methods.........................................................................................................................................4 Data................................................................................................................................................8 Energy Usage After Upgrades .............................................................................................. 11 Conclusion................................................................................................................................. 14 Appendix A-REScheck Original Home Envelope and Upgraded Home.................... 17 Appendix B- Light Bulb Calculator .................................................................................... 18 Appendix C- New Hot Water Heater Specifications ....................................................... 19
- 3. Introduction The purpose of this project is to integrate all the topics reviewed in class during the semester to get a home to reach net zero energy. The project will require a selection of an existing building and designing a set of modifications that will allow it to be net zero. According to the 2009 Massachusetts Zero Net Energy Buildings Task Force “A zero net energy building is one that is optimally efficient and, over the course of a year, generates energy onsite, using clean renewable resources, in a quantity equal to or greater than the total amount of energy consumed onsite.” This assignment required the total energy use of a building over a one-year period. Energy usage was divided into sectors of electric use (kWh), space heating (therms) and domestic hot water (DHW). Multiple energy conservation measures (ECM) were evaluated and used to determine energy reduction. The payback period for each ECM evaluated was calculated. Renewable energy sources were then analyzed to find the best energy source for onsite implementation. The purpose of the renewable energy source is to meet the energy demand after the ECM reductions. This analysis gives a resident insight on energy usage and gives better understanding of the cost and payback period associated with upgrading a home to make it save energy. The home chosen for this report is located at 1054 Lancaster Ave, Syracuse, New York, 13210. It is a two-story home that was built in 1930. The square footage of the home is 1524. The walls of the house are wood frame, 16” on stud spacing with 3 ½” blown cellulose insulation. The attic has 6 ½” blown cellulose insulation. There are 18 30” x 62” single pane, wooden frame single hung windows distributed throughout the house. The basement is unfinished, solid concrete with virtually no insulation. There are
- 4. 38 incandescent light bulbs distributed throughout the house. The house is considered very leaky. There are a total of four people living in the house and all are college students. Methods The first step to strive towards “net zero” modifications will be to identify current energy usage of the home. All energy information needed can accessed by inputting all of the necessary utility information at the website https://www.nationalgridus.com/Default. This website provides monthly energy bills for the home and it will outline the overall gas (therms) and electricity (kWh) usage each month. In order to determine the total energy cost for electrical devices, space heating and domestic how water (DHW), a full years worth of energy bills was downloaded from the National Grid account. The bills appeared on a Microsoft Excel sheet that had the monthly energy usage and the monthly cost. The hot water heater in the home is electric, so 15% of the total electric energy usage was used to determine the Domestic Hot Water (DHW). The figure 15% came from the water heating section of Residential Energy and it states “Water heating consumes approximately 15% of the electricity and 25% of the natural gas used in residences.”(Krigger, 2009) The next step into comparing the usage types is by finding a common unit for the three usage types. British Thermal units (BTU) are the best unit for comparison between electric, space heat and DHW (Refer to Chart 1). The conversions were done by taking the electric and DHW values and using the conversion factor 1kWh=3412 BTU. For space heat, the conversion factor used is 1 Therm=100,000 BTU. Once all of these were calculated, the common units were placed on a pie chart for comparison. Heating, DHW and electricity units can all be found on Table 1 of the data
- 5. section. Another pie cart was created to show the cost currently associated for energy use in the house. The cost for 1 Therm was calculated to be $1.05 and the cost for 1 kWh of electricity was determined to be $.12 (Refer to Chart 2). The next step of the assignment was to determine the energy conservation methods (ECM) needed to improve the home. To determine possible energy reduction, characteristics of the house were manually inputted in the website https://energycode.pnl.gov/REScheckWeb/launch.html?sessionTimeout=true. Some of the characteristics of the home inputted consisted of the total sq ft of the walls and ceiling, the types of insulation throughout the house and the types of windows in the house. Once all of the data was input, “check compliance” was clicked and it provides a UA value and provides a percentage that represents if the home passed or failed. The first time the data was entered into REScheck, the home failed the test with a -51.6% (Refer to Appendix A). To have the home pass the test, new windows were installed and insulation was added to the attic, walls and basement. To find the amount of energy being saved by upgrading the insulation, the heat loss formula . HDD stands for heating degree-days is the number of degrees that a day’s average temperature is below 65 The R-value measures an objects resistance to heat and manufacturers will place the R-value on all insulation. The heat loss value of an object needs to be calculated first and then the upgraded insulation heat loss value needs to be calculated. Once both values are found, subtract the heating values from each other and the final value is the amount of heat that is saved annually (Refer to Heat Loss ECM Calculations in the data section) . This value can then be multiplied by the cost of fuel, 1.05/therm, to find the total amount of money that will be saved annually from the insulation upgrades. To get the price associated with
- 6. installing the insulation, for the desired insulation are found in the RSMeans Building Construction Cost Data book. The costs of the upgrades were calculated by multiplying by the total area that the insulation covers (Refer to the cost of ECM section in the data section). To get the payback period, the annual savings divides the total costs for the upgrades. (All payback period calculations can be found in the data section). R-values associated with installing a specific insulation are also found in the RSMeans Building Construction Cost Data book. For the attic, 8 ” of blown cellulose (R30) was added to increase the R-value from 22 to 52. For the walls, 6 ½” blown cellulose (R28) was added to increase the R-value from 13 to 26. All single pane, wooden from windows in the house were replaced with double pane, low-e coating windows with vinyl frames. This decreased the U-value from .48 to .29. The U-value measures the effectiveness of a material as an insulator by measuring the rate of heat transfer. The lower U-values are better. Finally, the depth of insulation in the attic was extended from the 1 ft. to 8.5 ft. by using 2” polystyrene foam board insulation. After all of the ECMs were completed, the new UA value passed at 17.8% (Refer to Appendix A). All space heat insulation payback periods can be found on Table 2 in the summary of results section. ECMs were also taken in place to reduce electricity demand. The website https://www.energystar.gov/ia/partners/promotions/change_light/downloads/bulb.html was used to determine savings and payoff of replacing the light bulbs in the house by inputting all of the relevant and necessary information into the calculator (Refer to Appendix B for energy star calculator). All 38, 60 watt incandescent light bulbs in the home were replaced with energy star rated 20 watt equivalent compact fluorescent bulbs.
- 7. Each energy star compact fluorescent light bulb costs $5 and the total amount to replace all the light bulbs in the house is $190. It was determined that 2774 kWh would be saved each year when the price of electricity was at $.12/kWh. The estimated yearly savings is $327.10 and that creates a payback period of 7 months. The next ECM for electrical use taken was preplacing the hot water heater. The current hot water heater is over 10 years old and requires a lot of electricity. A new energy star certified electric whirlpool water heater, with a hybrid heat pump was installed (Refer to Appendix C). The water heater was originally $1,119.46, but after incentives the price came down to $419.46. The hot water heater uses exactly one third of the annual energy that the current hot water heater uses. It was determined that it would save 840.48 kWh each year, resulting in an annual savings of $100.86 The payback period for the system was determined to be about 4 years. The next ECM for electricity taken was to remove the two mini-fridges that are operating in the house. Both mini-fridges are older Haier models and use 250kWh of electricity each year. There are no costs needed to remove them and no payback period. The annual savings of 500kWh is $60. All electric equipment upgrade payback periods can be found on Table 2 in the summary of results section. The last step of the assignment was to find a set of renewable energy sources that can be implemented onsite and will meet the energy demand after ECM reduction. To meet the zero net energy building modification, a solar photovoltaic (PV) system was installed on the roof. Using https://nyserda.wattplan.com/pv/, a personalized solar estimate was created. The website determined that a 6kW-DC system could be installed on the roof and have an annual production of 6,466kWh. The roof plane direction is south and has minimum shading of about 10%. 24 panels can be placed on the roof, which
- 8. covers a total area of 462sq ft. The PV system will cover 77% of the annual electricity demand. The other 23%, 1897kWh, will be covered the ECMs made. The payback period for the PV system can be found on Table 3 in the summary of results section. The new energy usage after upgrades for all sectors is found in the Data section. Data Energy type Units Jan Feb Mar Apr May Jun Jul Aug Sep Oct Nov Dec Total Heating Therms 127 169 113 85 34 0 0 0 0 7 38 70 643 Electricity kWh 460 1102 949 939 649 378 138 63 996 949 1048 692 8,363 DHW kWh 104.5 104.5 104.5 104.5 104.5 104.5 104.5 104.5 104.5 104.5 104.5 104.5 1254.45 Table 1- Energy usage broken down into month and sector Given Conversion Factors 1 therm = 100,000 BTU 1 kWh=3412 BTU U= 1/R R=1/U 1 kWh=$.12 1 Therm=$1.05 Initial Home Energy Conversions Domestic Hot Water New Electricity Energy Usage 643 therms = 64,300,000 BTU 7,720 kWh = 26,340,640 BTU 1,254.45 kWh = 4,280,183.4 BTU Electric Base Load
- 9. /1 year = 2547.6 kWh/yr 2,547.6 kWh/yr 3412 BTU = 8,692,411.2 BTU/yr Cost of ECM Insulation Cost of upgrade = Wall Insulation Upgrade (Add 6 ½” Blown Cellulose R23) 6 ½” Thick Blown Cellulose Insulation = $1.12/ Cost = $1.12/ Cost = $1473.92 Ceiling Insulation Upgrade (Add 8 11/16” Blown Cellulose R30) 8 11/16” Thick Blown Cellulose Insulation = $1.38/ Cost = $1.38/ Cost = $609.96 Basement Insulation Upgrade (Add 2” Polystyrene Foam Board R8) 2” Polystyrene Foam Board Insulation = $1.37/ Cost = $1.37/ Cost = $746.65 Window Upgrades (Add 30” x 62” double pane, low-e coating windows U.29) Double pane, low-e coating windows = $180/window Cost = $1.80/ Cost = $1944 Heat Loss ECM Calculations Wall Insulation Original Upgrade (Add 6 ½” Blown Cellulose R23) Heat Loss (Original) =
- 10. Heat Loss (Upgraded) = Ceiling (Attic) Insulation Original Upgrade (Add 8 11/16” Blown Cellulose R30) Heat Loss (Original) = Heat Loss (Upgraded) = Basement Wall Insulation Upgrade (Add 2” Polystyrene Foam Board Insulation R8) Heat Loss (Original) = Heat Loss (Upgrade) = Windows in the House (Add 30” x 62” double pane, low-e coating windows) Heat Loss (Original) = Heat Loss (Upgrade) =
- 11. New Hot Water Heater (1/3 Energy Needed) Current DHW use = 150.3 Therms 150.3 Therms .33 = 49.6 Therms 150.3 Therms 49.6 Therms = 100.7 Therms (Saved) 100.7 $105.74 Energy Usage After Upgrades 100,644,608 BTU = 16,582,217.64 BTU 22,061,992 BTU 16,582,217.64 BTU = 5,479,774.36 BTU
- 12. Summary of Results Chart 1- Original home total annual energy use Chart 2- Original dollars spent on energy usage for utilities 26,340,640 64,300,000 4,280,183.40 0 Annual Energy Use by Sector (BTU) Electricity Space Heat DHW 926.4675.15 150.53 0 Annual Cost of Utilities ($) Electric Space Heat DHW
- 13. Proposed ECM Location Cost ($) Annual Energy Saved Annual Energy Amount Saved ($) Payback (Years) 8 11/16” (R30) Blown Cellulose Insulation Ceiling $609.96 1,783,000 BTU or (17.83 Therm) $18.72 32.58 6 ½” (R23) Blown Cellulose Insulation 1st and 2nd story walls $1473.92 10,559,000 BTU or (105.59 Therm) $110.87 13.3 2” (R8) Polystyrene Foam Board Insulation Basement walls $452.35 56,345,608 BTU or (563.46 Therm) $591.63 1.33 Vinyl Double Pain low-e windows (U.29) 18 Throughout the House $1944 31,976,000 BTU or (319.76 Therm) $335.75 5.8 Compact Fluorescent Light bulbs 38 Throughout the House $190 9,464,888 BTU or (2774 kWh) $327.10 .7 New Hot Water Heater Basement $419.46 2,867,717.76 BTU or (840.48 kWh) $100.86 3.96 Remove 2 mini- fridges Student Rooms $0 1,706,000 BTU or (500 kWh) $60 0 Total $5089.69 114,702,213.8 BTU $1544.93 3.29 Table 2- Proposed Energy Conversation Measure (ECM) costs Proposed Sustainable Energy Source Location Cost ($) Annual Energy Savings (BTU) Annual Energy Amount Saved Payback (Years) 6 kW-DC Solar PV System Roof (24 panels) $28,849 22,061,992 or (6,466 kWh) $775.92 22 Table 3- Proposed Sustainable Energy Source costs Total Cost ($) Annual Energy Savings (BTU) Annual Energy Amount Saved Payback Period of all upgrades (Years) ECM Upgrades $5,089.69 114,702,213.8 $1,544.93 Total Cost/Annual Savings 14.62 Years PV system $28,849 22,061,213.8 $775.92 Total $33,938.69 136,763,427.6 $2320.85 Table 4- Total home upgrade costs and payback period of project
- 14. The ECMs taken were found to save 114,702,213.8 BTU annually. The total cost for installing all of the ECMs was found to be $5089.69 and the payback period for all the ECM’s was found to be 3.29 years. A 6 kW-DC solar system was the only sustainable energy system used to reach net zero because of the limited space of the property. The annual estimated energy output for a 6 kW system was determined to be 6,466 kWh. The payback period for the system was determined to be 22 years. The total cost of the ECMs and the PV system were added up for a total home upgrade cost of $33,938.69. The total annual energy savings was found to be 136,763,427.6 BTU, which saves $2,320.85 annually. The payback period for the entire upgraded was calculated to be 14.62 years. Conclusion Based on the data section and summary of results section, it can be seen that the ECM and sustainable energy system installed made the house net zero. The house without the upgrades used 64,300,000 BTU for space heat annually. After all of the insulation was added to the walls, basement, ceiling and new windows were put in, the house was estimated to save 100,644,608 from heat loss. The home had a positive net BTU savings of 36,364,608 BTU. The original REScheck calculation in Appendix A, found that the home failed code by 51.6%. After all of the insulation upgrades, the home was able to pass the REScheck building code with a 13.2%. The ECM to save electrical use and DHW use came out to 14,038,605.75 BTU annually. The annual electric and DHW usage was calculated to be 30,620,823.4 BTU. After the ECM upgrades, 16,582,217.64 BTU remained. To cover the remaining BTU, the PV system was installed
- 15. on the roof. The PV system was estimated to produce 22,061,992 BTU annually. The PV system would result in a surplus of 5,479,774.36 BTU annually, making the home net zero. The price of all the ECM upgrades and the addition of the PV system all have varying payback periods. The overall payback period is low at 14.26 years, but it could have been skewed by factors like 0 years payback for disposing of the 2 mini-fridges. I am a senior in college that is renting this house, so I could not do any of these modifications. The landlord most likely would not do any of these modifications because the utilities are not included in the rent, so the payback period for the landlord would almost be non-existent. If I were to own a home like this and had a steady job, I would make the investments. The home would be much more comfortable to live in and the value of the house would most likely rise. A lot of people would not invest in the upgrades though because it is hard to predict how long a person will stay in one location for an extended period of time. All of the roof space was utilized to cover the electrical costs of the home. The front lawn is too small to place a system in and the backyard would be completely shaded by trees and the neighbor’s house. The PV system was the only system utilized because of the limited space. There was no room to place a solar thermal unit and a geothermal system would be impractical for the small lot. Like the systems evaluated in the other studies, the data gathered for the PV system is an estimate. The performance of the system is extremely dependent on unpredictable weather conditions. The weather conditions can drastically increase or decrease the production of the PV system and the production values would impact the payback period of the systems and the net zero status
- 16. could vary. The payback period could also change because not all costs associated with installing the windows were calculated. Each individual price of the windows used was $108, but that did not include hiring somebody to install the windows. This would increase the overall costs and therefore increase the overall payback period. In the first report, the personal energy use, the same home was evaluated and it was discovered that the home had a EUI of 60,903.08 BTU/sq ft/yr and an HHI of 6.20 BTU/sq ft/HDD. For EUI, the home fell in the category of major problems with air leakage, insulation or space0condition efficiency. For HHI, the home fell in the better- than-average home with good insulation. The EUI was definitely more accurate than the HHI after reviewing the major insulation problems with the house. After the upgrades for the home, the HHI fell in the most efficient category by being less than 2 BTU/sq ft./HDD and also fell in the most efficient category for the EUI by being less than 25,000 BTU/sq ft/yr. Both categories determined that the home was now airtight; super insulated and has high heating efficiency.
- 17. Appendix A-REScheck Original Home Envelope and Upgraded Home
- 18. Appendix B- Light Bulb Calculator
- 19. Appendix C- New Hot Water Heater Specifications