Forecasting Financial Statements Sales growth rate 6- Dividend growth.pdf
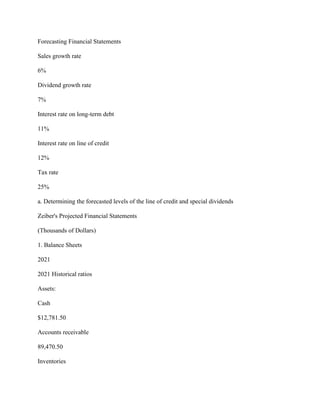
Forecasting Financial Statements Sales growth rate 6% Dividend growth rate 7% Interest rate on long-term debt 11% Interest rate on line of credit 12% Tax rate 25% a. Determining the forecasted levels of the line of credit and special dividends Zeiber's Projected Financial Statements (Thousands of Dollars) 1. Balance Sheets 2021 2021 Historical ratios Assets: Cash $12,781.50 Accounts receivable 89,470.50 Inventories 34,084.00 Total current assets $136,336.00 Fixed assets 161,899.00 Total assets $298,235.00 Liabilities and equity Accounts payable $21,302.50 Accruals 17,042.00 Line of credit 0.00 Total current liabilities $38,344.50 Long-term debt 120,000.00 Total liabilities $158,344.50 Common stock 70,000.00 Retained earnings 69,890.50 Total common equity $139,890.50 Total liabilities and equity $298,235.00 2. Income Statements 2021 2021 Historical ratios Sales $426,050.00 Expenses (excluding depr. & amort.) 362,142.50 Depreciation and amortization 12,951.92 EBIT $50,955.58 Interest expense on long-term debt 11,760.00 Interest expense on line of credit 0.00 EBT $39,195.58 Taxes (25%) 9,798.90 Net income $29,396.69 Regular common dividends $14,704.00 Special dividends 0.00 Addition to retained earnings $14,692.69 3. Elimination of the Financial Deficit or Surplus Increase in spontaneous liabilities (accounts payable and accruals) + Increase in long-term bonds and common stock + Net income (in preliminary forecast) minus regular common dividends - Previous line of credit Increase in financing - Increase in total assets Amount of financing deficit or surplus If deficit in financing (negative), draw on line of credit If surplus in financing (positive), pay special dividend b. Determining the forecasted levels of the line of credit and special dividends Sales growth rate Line of credit Special dividend (B3) $0.00 $0.00 3%.

Recommended
Recommended
More Related Content
Similar to Forecasting Financial Statements Sales growth rate 6- Dividend growth.pdf
Similar to Forecasting Financial Statements Sales growth rate 6- Dividend growth.pdf (18)
More from RichardovUKingh
More from RichardovUKingh (20)
Recently uploaded
Recently uploaded (20)
Forecasting Financial Statements Sales growth rate 6- Dividend growth.pdf
- 1. Forecasting Financial Statements Sales growth rate 6% Dividend growth rate 7% Interest rate on long-term debt 11% Interest rate on line of credit 12% Tax rate 25% a. Determining the forecasted levels of the line of credit and special dividends Zeiber's Projected Financial Statements (Thousands of Dollars) 1. Balance Sheets 2021 2021 Historical ratios Assets: Cash $12,781.50 Accounts receivable 89,470.50 Inventories
- 2. 34,084.00 Total current assets $136,336.00 Fixed assets 161,899.00 Total assets $298,235.00 Liabilities and equity Accounts payable $21,302.50 Accruals 17,042.00 Line of credit 0.00 Total current liabilities $38,344.50 Long-term debt 120,000.00 Total liabilities $158,344.50 Common stock 70,000.00 Retained earnings
- 3. 69,890.50 Total common equity $139,890.50 Total liabilities and equity $298,235.00 2. Income Statements 2021 2021 Historical ratios Sales $426,050.00 Expenses (excluding depr. & amort.) 362,142.50 Depreciation and amortization 12,951.92 EBIT $50,955.58 Interest expense on long-term debt 11,760.00 Interest expense on line of credit 0.00 EBT $39,195.58 Taxes (25%)
- 4. 9,798.90 Net income $29,396.69 Regular common dividends $14,704.00 Special dividends 0.00 Addition to retained earnings $14,692.69 3. Elimination of the Financial Deficit or Surplus Increase in spontaneous liabilities (accounts payable and accruals) + Increase in long-term bonds and common stock + Net income (in preliminary forecast) minus regular common dividends - Previous line of credit Increase in financing - Increase in total assets Amount of financing deficit or surplus If deficit in financing (negative), draw on line of credit If surplus in financing (positive), pay special dividend b. Determining the forecasted levels of the line of credit and special dividends Sales growth rate Line of credit Special dividend