SlideShare a Scribd company logo
1 of 30
1
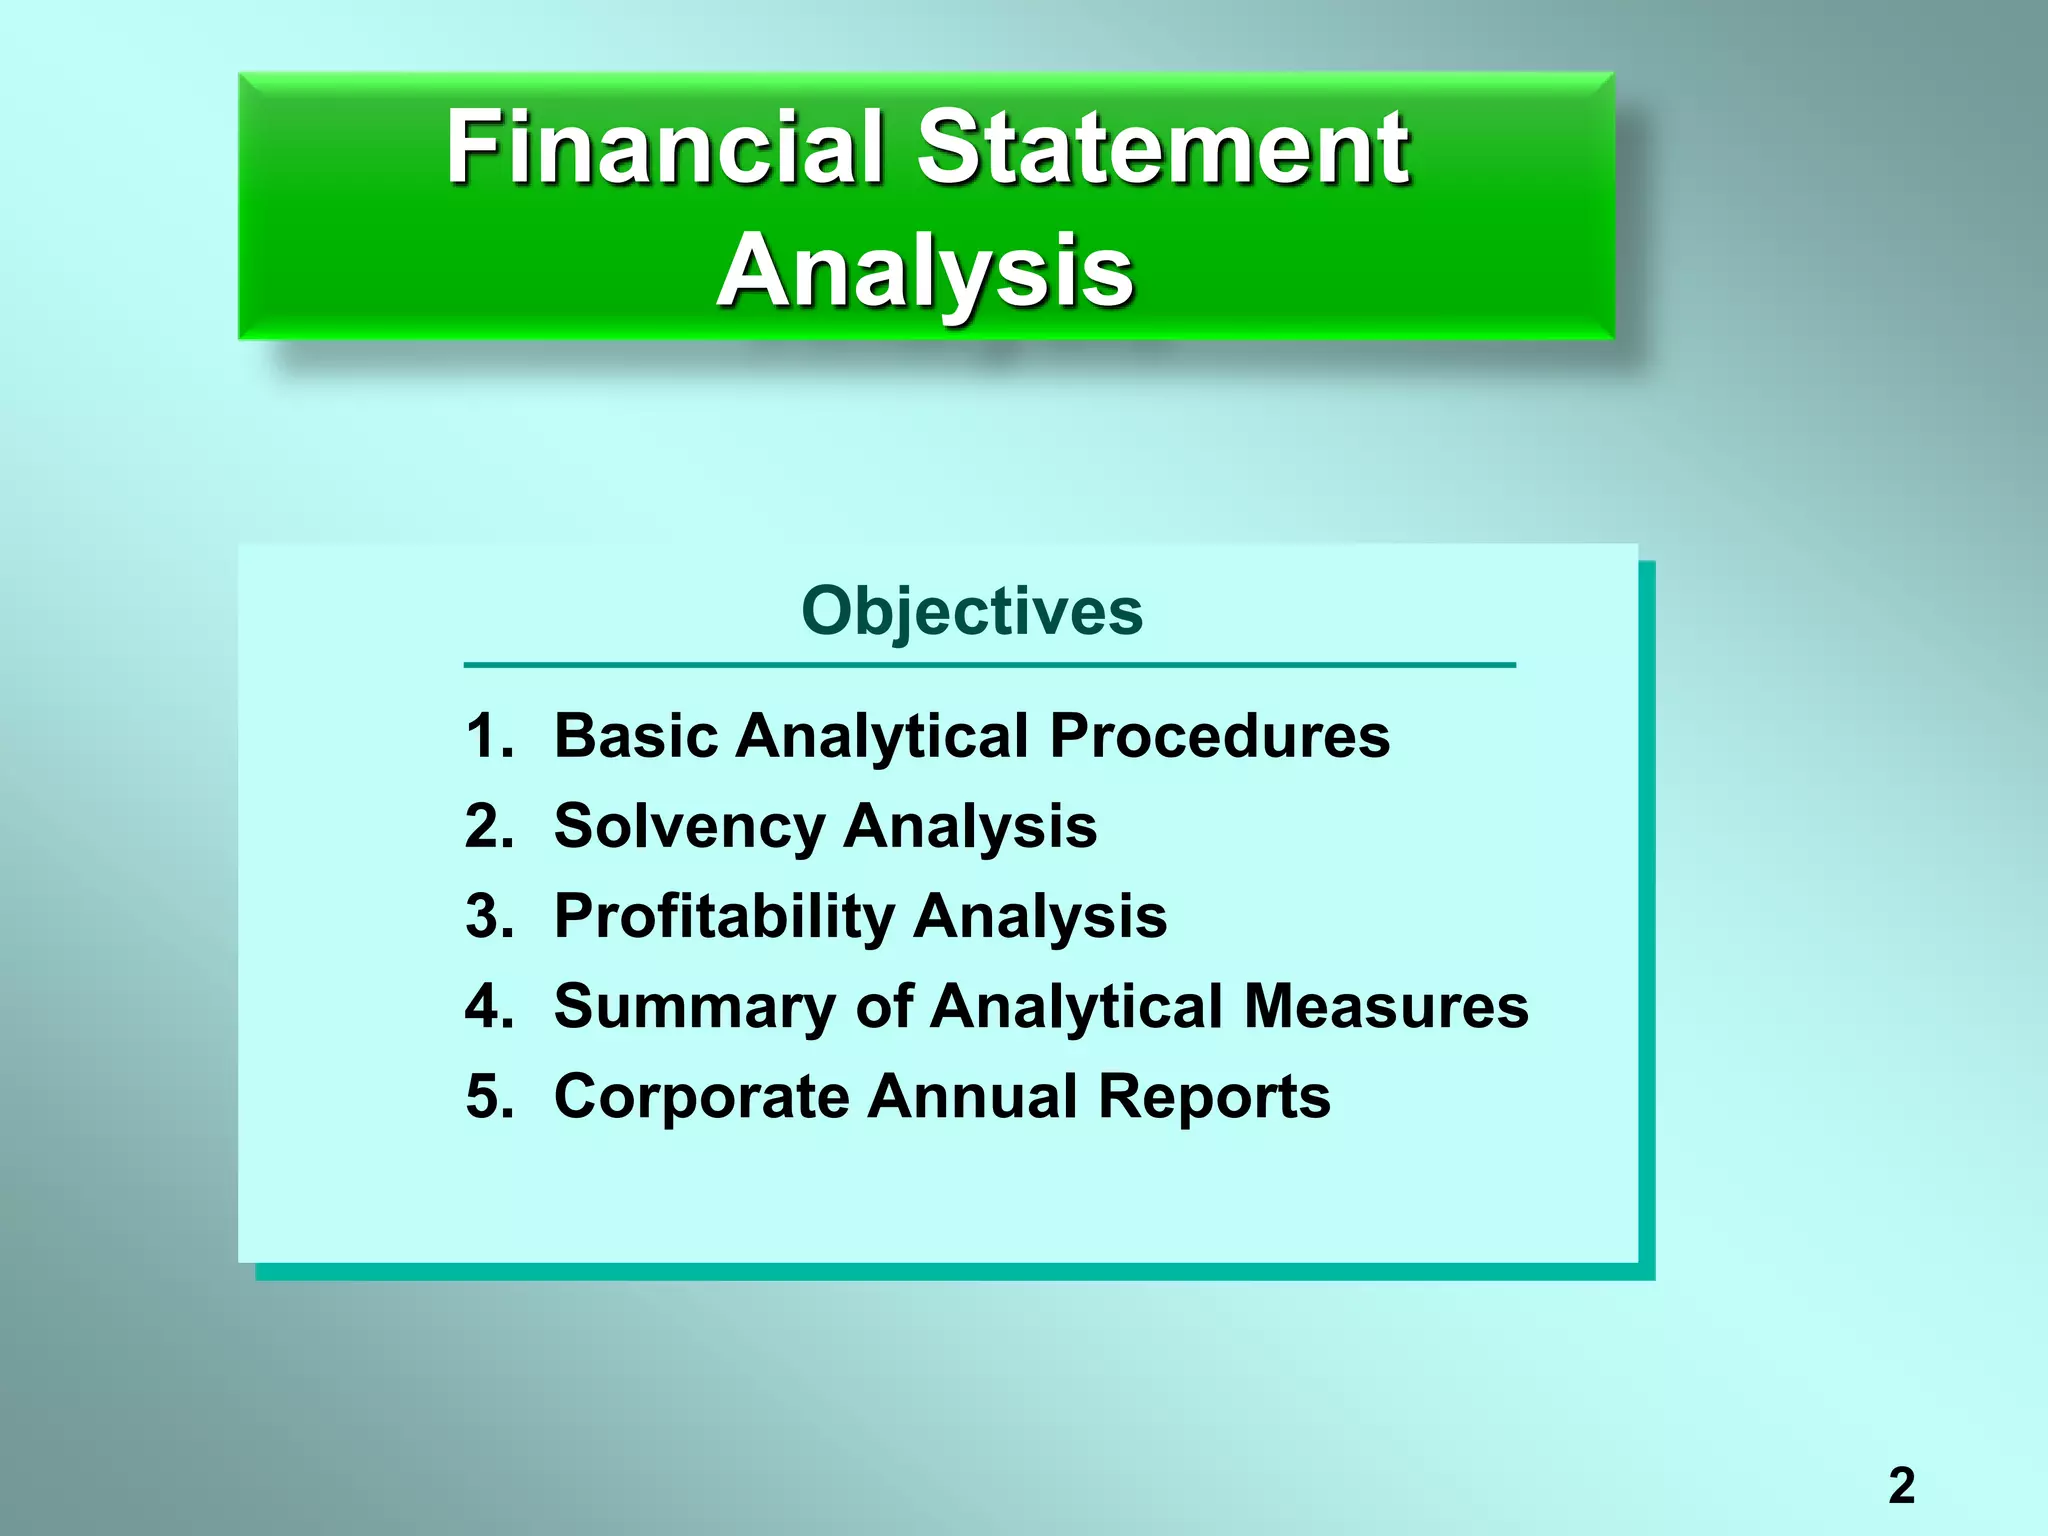
Financial Statement
Analysis
2
Objectives
1. Basic Analytical Procedures
2. Solvency Analysis
3. Profitability Analysis
4. Summary of Analytical Measures
5. Corporate Annual Reports
Financial Statement
Analysis
3
Lincoln Company
Comparative Balance Sheet
December 31, 2003 and 2002
Assets
Current assets $ 550,000 $ 533,000 $ 17,000 3.2%
Long-term investments 95,000 177,500 (82,500) (46.5%)
Fixed assets (net) 444,500 470,000 (25,500) (5.4%)
Intangible assets 50,000 50,000 —
$1,139,500 $1,230,500 $ (91,000) (7.4%)
Liabilities
Current liabilities $ 210,000 $ 243,000 $ (33,000) (13.6%)
Long-term liabilities 100,000 200,000 (100,000) (50.0%)
$ 310,000 $ 443,000 $(133,000) (30.0%)
Stockholders’ Equity
Preferred stock, $100 par $ 150,000 $ 150,000 —
Common stock, $10 par 500,000 500,000 —
Retained earnings 179,500 137,500 $42,000 30.5%
$ 829,500 $ 787,500 $42,000 5.3%
$1,139,500 $1230,500 $(91,000) (7.4%)
Increase (Decrease)
2003 2002 Amount Percent
4
Lincoln Company
Comparative Balance Sheet
December 31, 2003 and 2002
Assets
Current assets $ 550,000 $ 533,000 $ 17,000 3.2%
Long-term investments 95,000 177,500 (82,500) (46.5%)
Fixed assets (net) 444,500 470,000 (25,500) (5.4%)
Intangible assets 50,000 50,000 —
$1,139,500 $1,230,500 $ (91,000) (7.4%)
Liabilities
Current liabilities $ 210,000 $ 243,000 $ (33,000) (13.6%)
Long-term liabilities 100,000 200,000 (100,000) (50.0%)
$ 310,000 $ 443,000 $(133,000) (30.0%)
Stockholders’ Equity
Preferred stock, $100 par $ 150,000 $ 150,000 —
Common stock, $10 par 500,000 500,000 —
Retained earnings 179,500 137,500 $42,000 30.5%
$ 829,500 $ 787,500 $42,000 5.3%
$1,139,500 $1230,500 $(91,000) (7.4%)
Increase (Decrease)
2003 2002 Amount Percent
Horizontal Analysis:
Current year (2003) $550,000
Base year (2002) $533,000
= 103.2%
Increase amount $17,000
Base year (2002) $533,000
= 3.2%
5
Lincoln Company
Comparative Income Statement
December 31, 2003 and 2002
Sales $1,530,500 $1,234,000 $296,500 24.0%
Sales returns 32,500 34,000 (1,500) (4.4%)
Net sales $1,498,000 $1,200,000 $298,000) 24.8%
Cost of goods sold 1,043,000 820,000 223,000 27.2%
Gross profit $ 455,000 $ 380,000 $ 75,000 19.7%
Selling expenses $ 191,000 $ 147,000 $ 44,000 29.9%
Administrative expenses 104,000 97,400 6,600 6.8%
Total operating expenses $ 295,000 $ 244,400 $ 50,600 20.7%
Operating income $ 160,000 $ 135,600 $ 24,400 18.0%
Other income 8,500 11,000 (2,500) (22.7%)
$ 168,500 $ 146,600 $ 21,900 14.9%
Other expense 6,000 12,000 (6,000) (50.0%)
Income before income tax $ 162,500 $ 134,600 $ 27,900 20.7%
Income tax 71,500 58,100 13,400 23.1%
Net income $ 91,000 $ 76,500 $ 14,500 19.0%
Increase (Decrease)
2003 2002 Amount Percent
6
Lincoln Company
Comparative Income Statement
December 31, 2003 and 2002
Sales $1,530,500 $1,234,000 $296,500 24.0%
Sales returns 32,500 34,000 (1,500) (4.4%)
Net sales $1,498,000 $1,200,000 $298,000) 24.8%
Cost of goods sold 1,043,000 820,000 223,000 27.2%
Gross profit $ 455,000 $ 380,000 $ 75,000 19.7%
Selling expenses $ 191,000 $ 147,000 $ 44,000 29.9%
Administrative expenses 104,000 97,400 6,600 6.8%
Total operating expenses $ 295,000 $ 244,400 $ 50,600 20.7%
Operating income $ 160,000 $ 135,600 $ 24,400 18.0%
Other income 8,500 11,000 (2,500) (22.7%)
$ 168,500 $ 146,600 $ 21,900 14.9%
Other expense 6,000 12,000 (6,000) (50.0%)
Income before income tax $ 162,500 $ 134,600 $ 27,900 20.7%
Income tax 71,500 58,100 13,400 23.1%
Net income $ 91,000 $ 76,500 $ 14,500 19.0%
Increase (Decrease)
2003 2002 Amount Percent
Horizontal Analysis:
Current year (2003) $1,498,000
Base year (2002) $1,200,000
= 124.8%
Increase amount $298,000
Base year (2002) $1,200,000
= 24.8%
7
Lincoln Company
Comparative Balance Sheets
Assets
Current assets $ 550,000 48.3% $ 533,000 43.3%
Long-term investments 95,000 8.3 177,500 14.4
Fixed assets (net) 444,500 39.0 470,000 38.2
Intangible assets 50,000 4.4 50,000 4.1
$1,139,500 100.0% $1,230,500 100.0%
Liabilities
Current liabilities $ 210,000 18.4% $ 243,000 19.7%
Long-term liabilities 100,000 8.8 200,000 16.3
$ 310,000 27.2% $ 443,000 36.0%
Stockholders’ Equity
Preferred stock, $100 par $ 150,000 13.2% $ 150,000 12.2%
Common stock, $10 par 500,000 43.9 500,000 40.6
Retained earnings 179,500 15.7 137,500 11.2
$ 829,500 72.8% $ 787,500 64.0%
$1,139,500 100.0% $1230,500 100.0%
December 31, 2003 December 31, 2002
Amount Percent Amount Percent
8
Lincoln Company
Comparative Balance Sheets
Assets
Current assets $ 550,000 48.3% $ 533,000 43.3%
Long-term investments 95,000 8.3 177,500 14.4
Fixed assets (net) 444,500 39.0 470,000 38.2
Intangible assets 50,000 4.4 50,000 4.1
$1,139,500 100.0% $1,230,500 100.0%
Liabilities
Current liabilities $ 210,000 18.4% $ 243,000 19.7%
Long-term liabilities 100,000 8.8 200,000 16.3
$310,000 27.2% $ 443,000 36.0%
Stockholders’ Equity
Preferred stock, $100 par $ 150,000 13.2% $ 150,000 12.2%
Common stock, $10 par 500,000 43.9 500,000 40.6
Retained earnings 179,500 15.7 137,500 11.2
$829,500 72.8% $787,500 64.0%
$1,139,500 100.0% $1230,500 100.0%
December 31, 2003 December 31, 2002
Amount Percent Amount Percent
Vertical Analysis:
Current liabilities $210,000
Total assets $1,139,500
= 18.4%
9
Lincoln Company
Comparative Balance Sheets
Assets
Current assets $ 550,000 48.3% $ 533,000 43.3%
Long-term investments 95,000 8.3 177,500 14.4
Fixed assets (net) 444,500 39.0 470,000 38.2
Intangible assets 50,000 4.4 50,000 4.1
$1,139,500 100.0% $1,230,500 100.0%
Liabilities
Current liabilities $ 210,000 18.4% $ 243,000 19.7%
Long-term liabilities 100,000 8.8 200,000 16.3
$310,000 27.2% $ 443,000 36.0%
Stockholders’ Equity
Preferred stock, $100 par $ 150,000 13.2% $ 150,000 12.2%
Common stock, $10 par 500,000 43.9 500,000 40.6
Retained earnings 179,500 15.7 137,500 11.2
$829,500 72.8% $787,500 64.0%
$1,139,500 100.0% $1230,500 100.0%
December 31, 2003 December 31, 2002
Amount Percent Amount Percent
Common-Size Statements
10
Solvency Analysis
Solvency is the ability of a business to meet its
financial obligations (debts) as they are due.
Solvency analysis focuses on the ability of a
business to pay or otherwise satisfy its current
and noncurrent liabilities.
This ability is normally assessed by examining
balance sheet relationships.
11
Solvency Measures — The Short-Term Creditor
Current assets $550,000 $533,000
Current liabilities 210,000 243,000
Working capital $340,000 $290,000
Current ratio 2.6 2.2
Working Capital and Current Ratio
Use: To indicate the ability to meet
currently maturing obligations.
Divide
current
assets by
current
liabilities
2003 2002
12
Solvency Measures — The Short-Term Creditor
Acid-Test Ratio
Use: To indicate instant debt-paying ability.
2003 2002
Quick assets:
Cash $ 90,500 $ 64,700
Marketable securities 75,000 60,000
Accounts receivable (net) 115,000 120,000
Total $280,500 $244,700
Current liabilities $210,000 $243,000
Acid-test ratio 1.3 1.0
13
Solvency Measures — The Short-Term Creditor
Accounts Receivable Turnover
Use: To assess the efficiency in collecting
receivables and in the management of credit.
Net sales on account $1,498,000 $1,200,000
Accounts receivable (net):
Beginning of year $ 120,000 $ 140,000
End of year 115,500 120,000
Total $ 235,000 $ 260,000
Average $ 117,500 $ 130,000
Accts. receivable turnover 12.7 9.2
2003 2002
14
Solvency Measures — The Short-Term Creditor
Number of Days’ Sales in Receivables
Use: To assess the efficiency in collecting
receivables and in the management of credit.
2003 2002
Accounts receivable (net)
end of year $ 115,000 $ 120,000
Net sales on account $1,498,000 $1,200,000
Average daily sales on
on account (sales  365) $ 4,104 $ 3,288
Number of days’ sales in
receivables 28 36.5
15
Solvency Measures — The Short-Term Creditor
Inventory Turnover
Use: To assess the efficiency in the
management of inventory.
2003 2002
Cost of goods sold $1,043,000 $ 820,000
Inventories:
Beginning of year $ 283,000 $ 311,000
End of year 264,000 283,000
Total $ 547,000 $ 594,000
Average $ 273,500 $ 297,000
Inventory turnover 3.8 2.8
16
Solvency Measures — The Short-Term Creditor
Number of Days’ Sales in Inventory
Use: To assess the efficiency in the
management of inventory.
2003 2002
Inventories, end of year $ 264,000 $283,000
Cost of goods sold $1,043,000 $820,000
Average daily cost of
goods sold
(COGS  365) $ 2,858 $ 2,247
Number of days’ sales
in inventory 92.4 125.9
17
Solvency Measures — The Long-Term Creditor
Use: To indicate the margin of safety
to long-term creditors.
2003 2002
Fixed assets (net) $444,500 $470,000
Long-term liabilities $100,000 $200,000
Ratio of fixed assets to
long-term liabilities 4.4 2.4
Ratio of Fixed Assets to Long-Term Liabilities
18
Solvency Measures — The Long-Term Creditor
Ratio of Liabilities to Stockholders’ Equity
Use: To indicate the margin of safety to creditors.
2003 2002
Total liabilities $310,000 $443,000
Total stockholders’ equity $829,500 $787,500
Ratio of liabilities to
stockholders’ equity 0.37 0.56
19
Solvency Measures — The Long-Term Creditor
Number of Times Interest Charges Earned
Use: To assess the risk to debtholders in terms
of number of times interest charges were
earned.
2003 2002
Income before income tax $ 900,000 $ 800,000
Add interest expense 300,000 250,000
Amount available for interest $1,200,000 $1,050,000
Number of times earned 4.0 4.2
20
Profitability Analysis
Profitability is the ability of an entity to earn profits.
This ability to earn profits depends on the
effectiveness and efficiency of operations as well
as resources available.
Profitability analysis focuses primarily on the
relationship between operating results reported in
the income statement and resources reported in
the balance sheet.
21
Profitability Measures — The Common Stockholder
Ratio of Net Sales to Assets
2003 2002
Net sales $1,498,000 $1,200,000
Total assets:
Beginning of year $1,053,000 $1,010,000
End of year 1,044,500 1,053,000
Total $2,097,500 $2,063,000
Average $1,048,750 $1,031,500
Excludes long-term investments
22
Profitability Measures — The Common Stockholder
Ratio of Net Sales to Assets
Use: To assess the effectiveness
of the use of assets.
2003 2002
Net sales on account $1,498,000 $1,200,000
Total assets:
Beginning of year $1,053,000 $1,010,000
End of year 1,044,500 1,053,000
Total $2,097,500 $2,063,000
Average $1,048,750 $1,031,500
Ratio of net sales to assets 1.4 1.2
23
Profitability Measures — The Common Stockholder
Rate Earned on Total Assets
Use: To assess the profitability of the assets.
2003 2002
Net income $ 91,000 $ 76,500
Plus interest expense 6,000 12,000
Total $ 97,000 $ 88,500
Total assets:
Beginning of year $1,230,500 $1,187,500
End of year 1,139,500 1,230,500
Total $2,370,000 $2,418,000
Average $1,185,000 $1,209,000
Rate earned on total assets 8.2% 7.3%
24
Profitability Measures — The Common Stockholder
Rate Earned on Stockholders’ Equity
Use: To assess the profitability of the
investment by stockholders.
Net income $ 91,000 $ 76,500
Stockholders’ equity:
Beginning of year $ 787,500 $ 750,000
End of year 829,500 787,500
Total $1,617,000 $1,537,500
Average $ 808,500 $ 768,750
Rate earned on equity 11.3% 10.0%
2003 2002
25
Profitability Measures — The Common Stockholder
Rate Earned on Common Stockholders’ Equity
Use: To assess the profitability of the
investment by common stockholders.
2003 2002
Net income $ 91,000 $ 76,500
Less preferred dividends 9,000 9,000
Remainder—common stock $ 82,000 $ 67,500
Common stockholders’ equity:
Beginning of year $ 637,500 $ 600,000
End of year 679,500 637,500
Total $1,317,000 $1,237,500
Average $ 658,500 $ 618,750
Rate earned on common equity 12.5% 10.9%
26
Profitability Measures — The Common Stockholder
Earnings Per Share on Common Stock
2003 2002
Net income $ 91,000 $ 76,500
Less preferred dividends 9,000 9,000
Remainder—common stock $ 82,000 $ 67,500
Shares of common stock 50,000 50,000
Earnings per share on common $1.64 $1.35
Use: To assess the profitability of the
investment by common stockholders.
27
Profitability Measures — The Common Stockholder
Price-Earnings Ratio
Use: To indicate future earnings prospects,
based on the relationship between
market value of common stock and
earnings.
2003 2002
Market price per share of common $41.00 $27.00
Earnings per share on common $ 1.64 $ 1.35
Price-earnings ratio on common 25 20
28
Profitability Measures — The Common Stockholder
Dividend Yield
Use: To indicate the rate of return to common
stockholders in terms of dividends.
2003 2002
Dividends per share of common $ 0.80 $ 0.60
Market price per share of common $41.00 $27.00
Dividend yield on common stock 1.95% 2.22%
29
Corporate Annual Reports
1. Financial Highlights
2. President’s Letter to the Stockholders
3. Management Report
4. Independent Auditors’ Report
5. Historical Summary
In addition to financial statements, the
annual report includes:
30
The End

More Related Content

Similar to Financial Statement Analysis_01.ppt

Ch02 P14 Build a Model Spring 1, 201372212Chapter 2. Ch 02 P14.docx
 Ch02 P14 Build a Model Spring 1, 201372212Chapter 2.  Ch 02 P14.docx Ch02 P14 Build a Model Spring 1, 201372212Chapter 2.  Ch 02 P14.docx
Ch02 P14 Build a Model Spring 1, 201372212Chapter 2. Ch 02 P14.docx
arnit1
 
Financial HistorySTART HEREEnter data in the yellow cells only. Co.docx
Financial HistorySTART HEREEnter data in the yellow cells only. Co.docxFinancial HistorySTART HEREEnter data in the yellow cells only. Co.docx
Financial HistorySTART HEREEnter data in the yellow cells only. Co.docx
AKHIL969626
 
Fin 370 final exam set 3
Fin 370 final exam set 3Fin 370 final exam set 3
Fin 370 final exam set 3
smith54655
 
Fin 370 final exam set 3
Fin 370 final exam set 3Fin 370 final exam set 3
Fin 370 final exam set 3
Iphionesss
 
Fin 370 final exam set 3
Fin 370 final exam set 3Fin 370 final exam set 3
Fin 370 final exam set 3
gnffg
 
Fin 370 final exam set 3
Fin 370 final exam set 3Fin 370 final exam set 3
Fin 370 final exam set 3
nbvghytr657
 
Radio Shack Integrated Cash Flow Model_DCF
Radio Shack Integrated Cash Flow Model_DCFRadio Shack Integrated Cash Flow Model_DCF
Radio Shack Integrated Cash Flow Model_DCF
Dane Durham
 
dollar general annual reports 2002
dollar general annual reports 2002dollar general annual reports 2002
dollar general annual reports 2002
finance41
 
nationwide 1Q07 Statistical Supplement
nationwide 	1Q07 Statistical Supplementnationwide 	1Q07 Statistical Supplement
nationwide 1Q07 Statistical Supplement
finance11
 
ACG_Cup_-_Valuation
ACG_Cup_-_ValuationACG_Cup_-_Valuation
ACG_Cup_-_Valuation
Ike Ekeh
 
Final presentation-ver-4
Final presentation-ver-4Final presentation-ver-4
Final presentation-ver-4
Lê Anh
 

Similar to Financial Statement Analysis_01.ppt (20)

McDonalds Stock Market Project
McDonalds Stock Market ProjectMcDonalds Stock Market Project
McDonalds Stock Market Project
 
Bootstrapping Entrepeneurs & Their Business Ppt
Bootstrapping Entrepeneurs & Their Business PptBootstrapping Entrepeneurs & Their Business Ppt
Bootstrapping Entrepeneurs & Their Business Ppt
 
Ch02 P14 Build a Model Spring 1, 201372212Chapter 2. Ch 02 P14.docx
 Ch02 P14 Build a Model Spring 1, 201372212Chapter 2.  Ch 02 P14.docx Ch02 P14 Build a Model Spring 1, 201372212Chapter 2.  Ch 02 P14.docx
Ch02 P14 Build a Model Spring 1, 201372212Chapter 2. Ch 02 P14.docx
 
Financial HistorySTART HEREEnter data in the yellow cells only. Co.docx
Financial HistorySTART HEREEnter data in the yellow cells only. Co.docxFinancial HistorySTART HEREEnter data in the yellow cells only. Co.docx
Financial HistorySTART HEREEnter data in the yellow cells only. Co.docx
 
Fin 370 final exam set 3
Fin 370 final exam set 3Fin 370 final exam set 3
Fin 370 final exam set 3
 
Fin 370 final exam set 3
Fin 370 final exam set 3Fin 370 final exam set 3
Fin 370 final exam set 3
 
Fin 370 final exam set 3
Fin 370 final exam set 3Fin 370 final exam set 3
Fin 370 final exam set 3
 
Fin 370 final exam set 3
Fin 370 final exam set 3Fin 370 final exam set 3
Fin 370 final exam set 3
 
ACG Cup - Valuation
ACG Cup - ValuationACG Cup - Valuation
ACG Cup - Valuation
 
Fixed Investment Analysis PowerPoint Presentation Slides
Fixed Investment Analysis PowerPoint Presentation SlidesFixed Investment Analysis PowerPoint Presentation Slides
Fixed Investment Analysis PowerPoint Presentation Slides
 
Financial Planing PowerPoint Presentation Slides
Financial Planing PowerPoint Presentation Slides Financial Planing PowerPoint Presentation Slides
Financial Planing PowerPoint Presentation Slides
 
Financial Statement Analysis - Reading the Numbers Correctly
Financial Statement Analysis - Reading the Numbers CorrectlyFinancial Statement Analysis - Reading the Numbers Correctly
Financial Statement Analysis - Reading the Numbers Correctly
 
Radio Shack Integrated Cash Flow Model_DCF
Radio Shack Integrated Cash Flow Model_DCFRadio Shack Integrated Cash Flow Model_DCF
Radio Shack Integrated Cash Flow Model_DCF
 
Analysis of financial statements@ bec doms
Analysis of financial statements@ bec domsAnalysis of financial statements@ bec doms
Analysis of financial statements@ bec doms
 
Fixed Capital Evaluation PowerPoint Presentation Slides
Fixed Capital Evaluation PowerPoint Presentation SlidesFixed Capital Evaluation PowerPoint Presentation Slides
Fixed Capital Evaluation PowerPoint Presentation Slides
 
BSBA - FM- FINANCIAL STATEMENT ANALYSIS.pptx
BSBA - FM- FINANCIAL STATEMENT ANALYSIS.pptxBSBA - FM- FINANCIAL STATEMENT ANALYSIS.pptx
BSBA - FM- FINANCIAL STATEMENT ANALYSIS.pptx
 
dollar general annual reports 2002
dollar general annual reports 2002dollar general annual reports 2002
dollar general annual reports 2002
 
nationwide 1Q07 Statistical Supplement
nationwide 	1Q07 Statistical Supplementnationwide 	1Q07 Statistical Supplement
nationwide 1Q07 Statistical Supplement
 
ACG_Cup_-_Valuation
ACG_Cup_-_ValuationACG_Cup_-_Valuation
ACG_Cup_-_Valuation
 
Final presentation-ver-4
Final presentation-ver-4Final presentation-ver-4
Final presentation-ver-4
 

More from LayTekchhay2

Handout_Slide Industry 4.0 and Technology Trend P-2.pdf
Handout_Slide Industry 4.0 and Technology Trend P-2.pdfHandout_Slide Industry 4.0 and Technology Trend P-2.pdf
Handout_Slide Industry 4.0 and Technology Trend P-2.pdf
LayTekchhay2
 
(2)AMR Presentation on 29-30 Decemer Pheak 281222 2.pptx
(2)AMR Presentation on 29-30 Decemer Pheak 281222 2.pptx(2)AMR Presentation on 29-30 Decemer Pheak 281222 2.pptx
(2)AMR Presentation on 29-30 Decemer Pheak 281222 2.pptx
LayTekchhay2
 
12animalsigns2023_Takeaways.pdf
12animalsigns2023_Takeaways.pdf12animalsigns2023_Takeaways.pdf
12animalsigns2023_Takeaways.pdf
LayTekchhay2
 
200853941-Session-2-Raymond-Lo.ppt
200853941-Session-2-Raymond-Lo.ppt200853941-Session-2-Raymond-Lo.ppt
200853941-Session-2-Raymond-Lo.ppt
LayTekchhay2
 
1 Friends Profile - Khmer.pdf
1 Friends Profile - Khmer.pdf1 Friends Profile - Khmer.pdf
1 Friends Profile - Khmer.pdf
LayTekchhay2
 
Accounting for Branches and Combined Financial Statements.ppt
Accounting for Branches and Combined Financial Statements.pptAccounting for Branches and Combined Financial Statements.ppt
Accounting for Branches and Combined Financial Statements.ppt
LayTekchhay2
 
របាយការណ៍ចំណេញរក្សាទុក_Statement_of_retained.ppt
របាយការណ៍ចំណេញរក្សាទុក_Statement_of_retained.pptរបាយការណ៍ចំណេញរក្សាទុក_Statement_of_retained.ppt
របាយការណ៍ចំណេញរក្សាទុក_Statement_of_retained.ppt
LayTekchhay2
 

More from LayTekchhay2 (16)

Handout_Slide Industry 4.0 and Technology Trend P-2.pdf
Handout_Slide Industry 4.0 and Technology Trend P-2.pdfHandout_Slide Industry 4.0 and Technology Trend P-2.pdf
Handout_Slide Industry 4.0 and Technology Trend P-2.pdf
 
(2)AMR Presentation on 29-30 Decemer Pheak 281222 2.pptx
(2)AMR Presentation on 29-30 Decemer Pheak 281222 2.pptx(2)AMR Presentation on 29-30 Decemer Pheak 281222 2.pptx
(2)AMR Presentation on 29-30 Decemer Pheak 281222 2.pptx
 
12animalsigns2023_Takeaways.pdf
12animalsigns2023_Takeaways.pdf12animalsigns2023_Takeaways.pdf
12animalsigns2023_Takeaways.pdf
 
[01] Jan 2022.pdf
[01] Jan 2022.pdf[01] Jan 2022.pdf
[01] Jan 2022.pdf
 
200853941-Session-2-Raymond-Lo.ppt
200853941-Session-2-Raymond-Lo.ppt200853941-Session-2-Raymond-Lo.ppt
200853941-Session-2-Raymond-Lo.ppt
 
1 Friends Profile - Khmer.pdf
1 Friends Profile - Khmer.pdf1 Friends Profile - Khmer.pdf
1 Friends Profile - Khmer.pdf
 
List IAS & IFRS.pptx
List IAS & IFRS.pptxList IAS & IFRS.pptx
List IAS & IFRS.pptx
 
Activity Based Costing.ppt
Activity Based Costing.pptActivity Based Costing.ppt
Activity Based Costing.ppt
 
Profit Planning.ppt
Profit Planning.pptProfit Planning.ppt
Profit Planning.ppt
 
STATEMENT OF CASH FLOWS.ppt
STATEMENT OF CASH FLOWS.pptSTATEMENT OF CASH FLOWS.ppt
STATEMENT OF CASH FLOWS.ppt
 
Master Budget.pptx
Master Budget.pptxMaster Budget.pptx
Master Budget.pptx
 
Activity Based Costing (1).ppt
Activity Based Costing (1).pptActivity Based Costing (1).ppt
Activity Based Costing (1).ppt
 
Accounting for Branches and Combined Financial Statements.ppt
Accounting for Branches and Combined Financial Statements.pptAccounting for Branches and Combined Financial Statements.ppt
Accounting for Branches and Combined Financial Statements.ppt
 
របាយការណ៍ចំណេញរក្សាទុក_Statement_of_retained.ppt
របាយការណ៍ចំណេញរក្សាទុក_Statement_of_retained.pptរបាយការណ៍ចំណេញរក្សាទុក_Statement_of_retained.ppt
របាយការណ៍ចំណេញរក្សាទុក_Statement_of_retained.ppt
 
Dividend Journal Entry_01.pptx
Dividend Journal Entry_01.pptxDividend Journal Entry_01.pptx
Dividend Journal Entry_01.pptx
 
Accounting Errors.pptx
Accounting Errors.pptxAccounting Errors.pptx
Accounting Errors.pptx
 

Recently uploaded

Russian Call Girls In Rajiv Chowk Gurgaon ❤️8448577510 ⊹Best Escorts Service ...
Russian Call Girls In Rajiv Chowk Gurgaon ❤️8448577510 ⊹Best Escorts Service ...Russian Call Girls In Rajiv Chowk Gurgaon ❤️8448577510 ⊹Best Escorts Service ...
Russian Call Girls In Rajiv Chowk Gurgaon ❤️8448577510 ⊹Best Escorts Service ...
lizamodels9
 
Russian Call Girls In Gurgaon ❤️8448577510 ⊹Best Escorts Service In 24/7 Delh...
Russian Call Girls In Gurgaon ❤️8448577510 ⊹Best Escorts Service In 24/7 Delh...Russian Call Girls In Gurgaon ❤️8448577510 ⊹Best Escorts Service In 24/7 Delh...
Russian Call Girls In Gurgaon ❤️8448577510 ⊹Best Escorts Service In 24/7 Delh...
lizamodels9
 
Call Now ☎️🔝 9332606886🔝 Call Girls ❤ Service In Bhilwara Female Escorts Serv...
Call Now ☎️🔝 9332606886🔝 Call Girls ❤ Service In Bhilwara Female Escorts Serv...Call Now ☎️🔝 9332606886🔝 Call Girls ❤ Service In Bhilwara Female Escorts Serv...
Call Now ☎️🔝 9332606886🔝 Call Girls ❤ Service In Bhilwara Female Escorts Serv...
Anamikakaur10
 
The Abortion pills for sale in Qatar@Doha [+27737758557] []Deira Dubai Kuwait
The Abortion pills for sale in Qatar@Doha [+27737758557] []Deira Dubai KuwaitThe Abortion pills for sale in Qatar@Doha [+27737758557] []Deira Dubai Kuwait
The Abortion pills for sale in Qatar@Doha [+27737758557] []Deira Dubai Kuwait
daisycvs
 
Call Girls In Majnu Ka Tilla 959961~3876 Shot 2000 Night 8000
Call Girls In Majnu Ka Tilla 959961~3876 Shot 2000 Night 8000Call Girls In Majnu Ka Tilla 959961~3876 Shot 2000 Night 8000
Call Girls In Majnu Ka Tilla 959961~3876 Shot 2000 Night 8000
dlhescort
 
Call Girls From Pari Chowk Greater Noida ❤️8448577510 ⊹Best Escorts Service I...
Call Girls From Pari Chowk Greater Noida ❤️8448577510 ⊹Best Escorts Service I...Call Girls From Pari Chowk Greater Noida ❤️8448577510 ⊹Best Escorts Service I...
Call Girls From Pari Chowk Greater Noida ❤️8448577510 ⊹Best Escorts Service I...
lizamodels9
 
Call Girls In Noida 959961⊹3876 Independent Escort Service Noida
Call Girls In Noida 959961⊹3876 Independent Escort Service NoidaCall Girls In Noida 959961⊹3876 Independent Escort Service Noida
Call Girls In Noida 959961⊹3876 Independent Escort Service Noida
dlhescort
 
Call Girls Electronic City Just Call 👗 7737669865 👗 Top Class Call Girl Servi...
Call Girls Electronic City Just Call 👗 7737669865 👗 Top Class Call Girl Servi...Call Girls Electronic City Just Call 👗 7737669865 👗 Top Class Call Girl Servi...
Call Girls Electronic City Just Call 👗 7737669865 👗 Top Class Call Girl Servi...
amitlee9823
 
Call Girls in Delhi, Escort Service Available 24x7 in Delhi 959961-/-3876
Call Girls in Delhi, Escort Service Available 24x7 in Delhi 959961-/-3876Call Girls in Delhi, Escort Service Available 24x7 in Delhi 959961-/-3876
Call Girls in Delhi, Escort Service Available 24x7 in Delhi 959961-/-3876
dlhescort
 

Recently uploaded (20)

Value Proposition canvas- Customer needs and pains
Value Proposition canvas- Customer needs and painsValue Proposition canvas- Customer needs and pains
Value Proposition canvas- Customer needs and pains
 
Russian Call Girls In Rajiv Chowk Gurgaon ❤️8448577510 ⊹Best Escorts Service ...
Russian Call Girls In Rajiv Chowk Gurgaon ❤️8448577510 ⊹Best Escorts Service ...Russian Call Girls In Rajiv Chowk Gurgaon ❤️8448577510 ⊹Best Escorts Service ...
Russian Call Girls In Rajiv Chowk Gurgaon ❤️8448577510 ⊹Best Escorts Service ...
 
Russian Call Girls In Gurgaon ❤️8448577510 ⊹Best Escorts Service In 24/7 Delh...
Russian Call Girls In Gurgaon ❤️8448577510 ⊹Best Escorts Service In 24/7 Delh...Russian Call Girls In Gurgaon ❤️8448577510 ⊹Best Escorts Service In 24/7 Delh...
Russian Call Girls In Gurgaon ❤️8448577510 ⊹Best Escorts Service In 24/7 Delh...
 
Malegaon Call Girls Service ☎ ️82500–77686 ☎️ Enjoy 24/7 Escort Service
Malegaon Call Girls Service ☎ ️82500–77686 ☎️ Enjoy 24/7 Escort ServiceMalegaon Call Girls Service ☎ ️82500–77686 ☎️ Enjoy 24/7 Escort Service
Malegaon Call Girls Service ☎ ️82500–77686 ☎️ Enjoy 24/7 Escort Service
 
How to Get Started in Social Media for Art League City
How to Get Started in Social Media for Art League CityHow to Get Started in Social Media for Art League City
How to Get Started in Social Media for Art League City
 
Falcon Invoice Discounting platform in india
Falcon Invoice Discounting platform in indiaFalcon Invoice Discounting platform in india
Falcon Invoice Discounting platform in india
 
The Path to Product Excellence: Avoiding Common Pitfalls and Enhancing Commun...
The Path to Product Excellence: Avoiding Common Pitfalls and Enhancing Commun...The Path to Product Excellence: Avoiding Common Pitfalls and Enhancing Commun...
The Path to Product Excellence: Avoiding Common Pitfalls and Enhancing Commun...
 
Call Now ☎️🔝 9332606886🔝 Call Girls ❤ Service In Bhilwara Female Escorts Serv...
Call Now ☎️🔝 9332606886🔝 Call Girls ❤ Service In Bhilwara Female Escorts Serv...Call Now ☎️🔝 9332606886🔝 Call Girls ❤ Service In Bhilwara Female Escorts Serv...
Call Now ☎️🔝 9332606886🔝 Call Girls ❤ Service In Bhilwara Female Escorts Serv...
 
Phases of Negotiation .pptx
 Phases of Negotiation .pptx Phases of Negotiation .pptx
Phases of Negotiation .pptx
 
The Abortion pills for sale in Qatar@Doha [+27737758557] []Deira Dubai Kuwait
The Abortion pills for sale in Qatar@Doha [+27737758557] []Deira Dubai KuwaitThe Abortion pills for sale in Qatar@Doha [+27737758557] []Deira Dubai Kuwait
The Abortion pills for sale in Qatar@Doha [+27737758557] []Deira Dubai Kuwait
 
Call Girls In Majnu Ka Tilla 959961~3876 Shot 2000 Night 8000
Call Girls In Majnu Ka Tilla 959961~3876 Shot 2000 Night 8000Call Girls In Majnu Ka Tilla 959961~3876 Shot 2000 Night 8000
Call Girls In Majnu Ka Tilla 959961~3876 Shot 2000 Night 8000
 
Famous Olympic Siblings from the 21st Century
Famous Olympic Siblings from the 21st CenturyFamous Olympic Siblings from the 21st Century
Famous Olympic Siblings from the 21st Century
 
Uneak White's Personal Brand Exploration Presentation
Uneak White's Personal Brand Exploration PresentationUneak White's Personal Brand Exploration Presentation
Uneak White's Personal Brand Exploration Presentation
 
Call Girls From Pari Chowk Greater Noida ❤️8448577510 ⊹Best Escorts Service I...
Call Girls From Pari Chowk Greater Noida ❤️8448577510 ⊹Best Escorts Service I...Call Girls From Pari Chowk Greater Noida ❤️8448577510 ⊹Best Escorts Service I...
Call Girls From Pari Chowk Greater Noida ❤️8448577510 ⊹Best Escorts Service I...
 
Call Girls In Noida 959961⊹3876 Independent Escort Service Noida
Call Girls In Noida 959961⊹3876 Independent Escort Service NoidaCall Girls In Noida 959961⊹3876 Independent Escort Service Noida
Call Girls In Noida 959961⊹3876 Independent Escort Service Noida
 
Call Girls Ludhiana Just Call 98765-12871 Top Class Call Girl Service Available
Call Girls Ludhiana Just Call 98765-12871 Top Class Call Girl Service AvailableCall Girls Ludhiana Just Call 98765-12871 Top Class Call Girl Service Available
Call Girls Ludhiana Just Call 98765-12871 Top Class Call Girl Service Available
 
Katrina Personal Brand Project and portfolio 1
Katrina Personal Brand Project and portfolio 1Katrina Personal Brand Project and portfolio 1
Katrina Personal Brand Project and portfolio 1
 
Call Girls Electronic City Just Call 👗 7737669865 👗 Top Class Call Girl Servi...
Call Girls Electronic City Just Call 👗 7737669865 👗 Top Class Call Girl Servi...Call Girls Electronic City Just Call 👗 7737669865 👗 Top Class Call Girl Servi...
Call Girls Electronic City Just Call 👗 7737669865 👗 Top Class Call Girl Servi...
 
Cheap Rate Call Girls In Noida Sector 62 Metro 959961乂3876
Cheap Rate Call Girls In Noida Sector 62 Metro 959961乂3876Cheap Rate Call Girls In Noida Sector 62 Metro 959961乂3876
Cheap Rate Call Girls In Noida Sector 62 Metro 959961乂3876
 
Call Girls in Delhi, Escort Service Available 24x7 in Delhi 959961-/-3876
Call Girls in Delhi, Escort Service Available 24x7 in Delhi 959961-/-3876Call Girls in Delhi, Escort Service Available 24x7 in Delhi 959961-/-3876
Call Girls in Delhi, Escort Service Available 24x7 in Delhi 959961-/-3876
 

Financial Statement Analysis_01.ppt

  • 2. 2 Objectives 1. Basic Analytical Procedures 2. Solvency Analysis 3. Profitability Analysis 4. Summary of Analytical Measures 5. Corporate Annual Reports Financial Statement Analysis
  • 3. 3 Lincoln Company Comparative Balance Sheet December 31, 2003 and 2002 Assets Current assets $ 550,000 $ 533,000 $ 17,000 3.2% Long-term investments 95,000 177,500 (82,500) (46.5%) Fixed assets (net) 444,500 470,000 (25,500) (5.4%) Intangible assets 50,000 50,000 — $1,139,500 $1,230,500 $ (91,000) (7.4%) Liabilities Current liabilities $ 210,000 $ 243,000 $ (33,000) (13.6%) Long-term liabilities 100,000 200,000 (100,000) (50.0%) $ 310,000 $ 443,000 $(133,000) (30.0%) Stockholders’ Equity Preferred stock, $100 par $ 150,000 $ 150,000 — Common stock, $10 par 500,000 500,000 — Retained earnings 179,500 137,500 $42,000 30.5% $ 829,500 $ 787,500 $42,000 5.3% $1,139,500 $1230,500 $(91,000) (7.4%) Increase (Decrease) 2003 2002 Amount Percent
  • 4. 4 Lincoln Company Comparative Balance Sheet December 31, 2003 and 2002 Assets Current assets $ 550,000 $ 533,000 $ 17,000 3.2% Long-term investments 95,000 177,500 (82,500) (46.5%) Fixed assets (net) 444,500 470,000 (25,500) (5.4%) Intangible assets 50,000 50,000 — $1,139,500 $1,230,500 $ (91,000) (7.4%) Liabilities Current liabilities $ 210,000 $ 243,000 $ (33,000) (13.6%) Long-term liabilities 100,000 200,000 (100,000) (50.0%) $ 310,000 $ 443,000 $(133,000) (30.0%) Stockholders’ Equity Preferred stock, $100 par $ 150,000 $ 150,000 — Common stock, $10 par 500,000 500,000 — Retained earnings 179,500 137,500 $42,000 30.5% $ 829,500 $ 787,500 $42,000 5.3% $1,139,500 $1230,500 $(91,000) (7.4%) Increase (Decrease) 2003 2002 Amount Percent Horizontal Analysis: Current year (2003) $550,000 Base year (2002) $533,000 = 103.2% Increase amount $17,000 Base year (2002) $533,000 = 3.2%
  • 5. 5 Lincoln Company Comparative Income Statement December 31, 2003 and 2002 Sales $1,530,500 $1,234,000 $296,500 24.0% Sales returns 32,500 34,000 (1,500) (4.4%) Net sales $1,498,000 $1,200,000 $298,000) 24.8% Cost of goods sold 1,043,000 820,000 223,000 27.2% Gross profit $ 455,000 $ 380,000 $ 75,000 19.7% Selling expenses $ 191,000 $ 147,000 $ 44,000 29.9% Administrative expenses 104,000 97,400 6,600 6.8% Total operating expenses $ 295,000 $ 244,400 $ 50,600 20.7% Operating income $ 160,000 $ 135,600 $ 24,400 18.0% Other income 8,500 11,000 (2,500) (22.7%) $ 168,500 $ 146,600 $ 21,900 14.9% Other expense 6,000 12,000 (6,000) (50.0%) Income before income tax $ 162,500 $ 134,600 $ 27,900 20.7% Income tax 71,500 58,100 13,400 23.1% Net income $ 91,000 $ 76,500 $ 14,500 19.0% Increase (Decrease) 2003 2002 Amount Percent
  • 6. 6 Lincoln Company Comparative Income Statement December 31, 2003 and 2002 Sales $1,530,500 $1,234,000 $296,500 24.0% Sales returns 32,500 34,000 (1,500) (4.4%) Net sales $1,498,000 $1,200,000 $298,000) 24.8% Cost of goods sold 1,043,000 820,000 223,000 27.2% Gross profit $ 455,000 $ 380,000 $ 75,000 19.7% Selling expenses $ 191,000 $ 147,000 $ 44,000 29.9% Administrative expenses 104,000 97,400 6,600 6.8% Total operating expenses $ 295,000 $ 244,400 $ 50,600 20.7% Operating income $ 160,000 $ 135,600 $ 24,400 18.0% Other income 8,500 11,000 (2,500) (22.7%) $ 168,500 $ 146,600 $ 21,900 14.9% Other expense 6,000 12,000 (6,000) (50.0%) Income before income tax $ 162,500 $ 134,600 $ 27,900 20.7% Income tax 71,500 58,100 13,400 23.1% Net income $ 91,000 $ 76,500 $ 14,500 19.0% Increase (Decrease) 2003 2002 Amount Percent Horizontal Analysis: Current year (2003) $1,498,000 Base year (2002) $1,200,000 = 124.8% Increase amount $298,000 Base year (2002) $1,200,000 = 24.8%
  • 7. 7 Lincoln Company Comparative Balance Sheets Assets Current assets $ 550,000 48.3% $ 533,000 43.3% Long-term investments 95,000 8.3 177,500 14.4 Fixed assets (net) 444,500 39.0 470,000 38.2 Intangible assets 50,000 4.4 50,000 4.1 $1,139,500 100.0% $1,230,500 100.0% Liabilities Current liabilities $ 210,000 18.4% $ 243,000 19.7% Long-term liabilities 100,000 8.8 200,000 16.3 $ 310,000 27.2% $ 443,000 36.0% Stockholders’ Equity Preferred stock, $100 par $ 150,000 13.2% $ 150,000 12.2% Common stock, $10 par 500,000 43.9 500,000 40.6 Retained earnings 179,500 15.7 137,500 11.2 $ 829,500 72.8% $ 787,500 64.0% $1,139,500 100.0% $1230,500 100.0% December 31, 2003 December 31, 2002 Amount Percent Amount Percent
  • 8. 8 Lincoln Company Comparative Balance Sheets Assets Current assets $ 550,000 48.3% $ 533,000 43.3% Long-term investments 95,000 8.3 177,500 14.4 Fixed assets (net) 444,500 39.0 470,000 38.2 Intangible assets 50,000 4.4 50,000 4.1 $1,139,500 100.0% $1,230,500 100.0% Liabilities Current liabilities $ 210,000 18.4% $ 243,000 19.7% Long-term liabilities 100,000 8.8 200,000 16.3 $310,000 27.2% $ 443,000 36.0% Stockholders’ Equity Preferred stock, $100 par $ 150,000 13.2% $ 150,000 12.2% Common stock, $10 par 500,000 43.9 500,000 40.6 Retained earnings 179,500 15.7 137,500 11.2 $829,500 72.8% $787,500 64.0% $1,139,500 100.0% $1230,500 100.0% December 31, 2003 December 31, 2002 Amount Percent Amount Percent Vertical Analysis: Current liabilities $210,000 Total assets $1,139,500 = 18.4%
  • 9. 9 Lincoln Company Comparative Balance Sheets Assets Current assets $ 550,000 48.3% $ 533,000 43.3% Long-term investments 95,000 8.3 177,500 14.4 Fixed assets (net) 444,500 39.0 470,000 38.2 Intangible assets 50,000 4.4 50,000 4.1 $1,139,500 100.0% $1,230,500 100.0% Liabilities Current liabilities $ 210,000 18.4% $ 243,000 19.7% Long-term liabilities 100,000 8.8 200,000 16.3 $310,000 27.2% $ 443,000 36.0% Stockholders’ Equity Preferred stock, $100 par $ 150,000 13.2% $ 150,000 12.2% Common stock, $10 par 500,000 43.9 500,000 40.6 Retained earnings 179,500 15.7 137,500 11.2 $829,500 72.8% $787,500 64.0% $1,139,500 100.0% $1230,500 100.0% December 31, 2003 December 31, 2002 Amount Percent Amount Percent Common-Size Statements
  • 10. 10 Solvency Analysis Solvency is the ability of a business to meet its financial obligations (debts) as they are due. Solvency analysis focuses on the ability of a business to pay or otherwise satisfy its current and noncurrent liabilities. This ability is normally assessed by examining balance sheet relationships.
  • 11. 11 Solvency Measures — The Short-Term Creditor Current assets $550,000 $533,000 Current liabilities 210,000 243,000 Working capital $340,000 $290,000 Current ratio 2.6 2.2 Working Capital and Current Ratio Use: To indicate the ability to meet currently maturing obligations. Divide current assets by current liabilities 2003 2002
  • 12. 12 Solvency Measures — The Short-Term Creditor Acid-Test Ratio Use: To indicate instant debt-paying ability. 2003 2002 Quick assets: Cash $ 90,500 $ 64,700 Marketable securities 75,000 60,000 Accounts receivable (net) 115,000 120,000 Total $280,500 $244,700 Current liabilities $210,000 $243,000 Acid-test ratio 1.3 1.0
  • 13. 13 Solvency Measures — The Short-Term Creditor Accounts Receivable Turnover Use: To assess the efficiency in collecting receivables and in the management of credit. Net sales on account $1,498,000 $1,200,000 Accounts receivable (net): Beginning of year $ 120,000 $ 140,000 End of year 115,500 120,000 Total $ 235,000 $ 260,000 Average $ 117,500 $ 130,000 Accts. receivable turnover 12.7 9.2 2003 2002
  • 14. 14 Solvency Measures — The Short-Term Creditor Number of Days’ Sales in Receivables Use: To assess the efficiency in collecting receivables and in the management of credit. 2003 2002 Accounts receivable (net) end of year $ 115,000 $ 120,000 Net sales on account $1,498,000 $1,200,000 Average daily sales on on account (sales  365) $ 4,104 $ 3,288 Number of days’ sales in receivables 28 36.5
  • 15. 15 Solvency Measures — The Short-Term Creditor Inventory Turnover Use: To assess the efficiency in the management of inventory. 2003 2002 Cost of goods sold $1,043,000 $ 820,000 Inventories: Beginning of year $ 283,000 $ 311,000 End of year 264,000 283,000 Total $ 547,000 $ 594,000 Average $ 273,500 $ 297,000 Inventory turnover 3.8 2.8
  • 16. 16 Solvency Measures — The Short-Term Creditor Number of Days’ Sales in Inventory Use: To assess the efficiency in the management of inventory. 2003 2002 Inventories, end of year $ 264,000 $283,000 Cost of goods sold $1,043,000 $820,000 Average daily cost of goods sold (COGS  365) $ 2,858 $ 2,247 Number of days’ sales in inventory 92.4 125.9
  • 17. 17 Solvency Measures — The Long-Term Creditor Use: To indicate the margin of safety to long-term creditors. 2003 2002 Fixed assets (net) $444,500 $470,000 Long-term liabilities $100,000 $200,000 Ratio of fixed assets to long-term liabilities 4.4 2.4 Ratio of Fixed Assets to Long-Term Liabilities
  • 18. 18 Solvency Measures — The Long-Term Creditor Ratio of Liabilities to Stockholders’ Equity Use: To indicate the margin of safety to creditors. 2003 2002 Total liabilities $310,000 $443,000 Total stockholders’ equity $829,500 $787,500 Ratio of liabilities to stockholders’ equity 0.37 0.56
  • 19. 19 Solvency Measures — The Long-Term Creditor Number of Times Interest Charges Earned Use: To assess the risk to debtholders in terms of number of times interest charges were earned. 2003 2002 Income before income tax $ 900,000 $ 800,000 Add interest expense 300,000 250,000 Amount available for interest $1,200,000 $1,050,000 Number of times earned 4.0 4.2
  • 20. 20 Profitability Analysis Profitability is the ability of an entity to earn profits. This ability to earn profits depends on the effectiveness and efficiency of operations as well as resources available. Profitability analysis focuses primarily on the relationship between operating results reported in the income statement and resources reported in the balance sheet.
  • 21. 21 Profitability Measures — The Common Stockholder Ratio of Net Sales to Assets 2003 2002 Net sales $1,498,000 $1,200,000 Total assets: Beginning of year $1,053,000 $1,010,000 End of year 1,044,500 1,053,000 Total $2,097,500 $2,063,000 Average $1,048,750 $1,031,500 Excludes long-term investments
  • 22. 22 Profitability Measures — The Common Stockholder Ratio of Net Sales to Assets Use: To assess the effectiveness of the use of assets. 2003 2002 Net sales on account $1,498,000 $1,200,000 Total assets: Beginning of year $1,053,000 $1,010,000 End of year 1,044,500 1,053,000 Total $2,097,500 $2,063,000 Average $1,048,750 $1,031,500 Ratio of net sales to assets 1.4 1.2
  • 23. 23 Profitability Measures — The Common Stockholder Rate Earned on Total Assets Use: To assess the profitability of the assets. 2003 2002 Net income $ 91,000 $ 76,500 Plus interest expense 6,000 12,000 Total $ 97,000 $ 88,500 Total assets: Beginning of year $1,230,500 $1,187,500 End of year 1,139,500 1,230,500 Total $2,370,000 $2,418,000 Average $1,185,000 $1,209,000 Rate earned on total assets 8.2% 7.3%
  • 24. 24 Profitability Measures — The Common Stockholder Rate Earned on Stockholders’ Equity Use: To assess the profitability of the investment by stockholders. Net income $ 91,000 $ 76,500 Stockholders’ equity: Beginning of year $ 787,500 $ 750,000 End of year 829,500 787,500 Total $1,617,000 $1,537,500 Average $ 808,500 $ 768,750 Rate earned on equity 11.3% 10.0% 2003 2002
  • 25. 25 Profitability Measures — The Common Stockholder Rate Earned on Common Stockholders’ Equity Use: To assess the profitability of the investment by common stockholders. 2003 2002 Net income $ 91,000 $ 76,500 Less preferred dividends 9,000 9,000 Remainder—common stock $ 82,000 $ 67,500 Common stockholders’ equity: Beginning of year $ 637,500 $ 600,000 End of year 679,500 637,500 Total $1,317,000 $1,237,500 Average $ 658,500 $ 618,750 Rate earned on common equity 12.5% 10.9%
  • 26. 26 Profitability Measures — The Common Stockholder Earnings Per Share on Common Stock 2003 2002 Net income $ 91,000 $ 76,500 Less preferred dividends 9,000 9,000 Remainder—common stock $ 82,000 $ 67,500 Shares of common stock 50,000 50,000 Earnings per share on common $1.64 $1.35 Use: To assess the profitability of the investment by common stockholders.
  • 27. 27 Profitability Measures — The Common Stockholder Price-Earnings Ratio Use: To indicate future earnings prospects, based on the relationship between market value of common stock and earnings. 2003 2002 Market price per share of common $41.00 $27.00 Earnings per share on common $ 1.64 $ 1.35 Price-earnings ratio on common 25 20
  • 28. 28 Profitability Measures — The Common Stockholder Dividend Yield Use: To indicate the rate of return to common stockholders in terms of dividends. 2003 2002 Dividends per share of common $ 0.80 $ 0.60 Market price per share of common $41.00 $27.00 Dividend yield on common stock 1.95% 2.22%
  • 29. 29 Corporate Annual Reports 1. Financial Highlights 2. President’s Letter to the Stockholders 3. Management Report 4. Independent Auditors’ Report 5. Historical Summary In addition to financial statements, the annual report includes: