SlideShare a Scribd company logo
1 of 18
Download to read offline
1 | P a g e
Workshop on 8/9/10 Aug, 2020
Lecturer Note……….
VARIABLE ANALYSIS
What is Univariate Analysis?
Univariate analysis is the simplest form of analyzing data. “Uni” means “one”, so in other
words your data has only one variable. It doesn’t deal with causes or relationships (unlike
regression) and it’s major purpose is to describe; It takes data, summarizes that data and
finds patterns in the data.
This type of data consists of only one variable. The analysis of univariate data is
thus the simplest form of analysis since the information deals with only one quantity that
changes. It does not deal with causes or relationships and the main purpose of the
analysis is to describe the data and find patterns that exist within it. The example of a
univariate data can be height.
Table 1
Suppose that the heights of seven students of a class is recorded (Table 1 ), there is only
one variable that is height and it is not dealing with any cause or relationship. The
description of patterns found in this type of data can be made by drawing conclusions
using central tendency measures (mean, median and mode), dispersion or spread of data
2 | P a g e
Workshop on 8/9/10 Aug, 2020
(range, minimum, maximum, quartiles, variance and standard deviation) and by using
frequency distribution tables, histograms, pie charts, frequency polygon and bar charts.
What is a variable in Univariate Analysis?
A variable in univariate analysis is just a condition or subset that your data falls into. You
can think of it as a “category.” For example, the analysis might look at a variable of “age”
or it might look at “sales”, “height” or “weight”. However, it doesn’t look at more than one
variable at a time otherwise it becomes bivariate analysis (or in the case of 3 or more
variables it would be called multivariate analysis).
The following frequency distribution table (Table 2) shows one variable (left column)
and the count in the right column.
Table 2 Weekly sales
Sales (weekly) Amount (Rs)
Monday 25000
Tuesday 22000
Wednesday 23000
Thursday 22000
Friday 23000
Saturday 21000
Sunday 26000
Total 162000
You could have more than one variable in the above table. For example, you could add the
variable “Location”or “Age” or something else, and make a separate column for location
3 | P a g e
Workshop on 8/9/10 Aug, 2020
or age. In that case you would have bivariate data because you would then have two
variables.
Univariate Descriptive Statistics
Some ways you can describe patterns found in univariate data include central tendency
(mean, mode and median) and dispersion: range, variance, maximum, minimum,
quartiles (including the interquartile range), and standard deviation.
You have several options for describing data with univariate data. To represent the above
date, there are following way as follows.
Frequency Distribution Tables.
Bar Charts.
Histograms.
Frequency Polygons.
Pie Charts.
What is bivariate analysis?
Bivariate analysis is one of the statistical analysis where two variables are observed. One
variable here is dependent while the other is independent. These variables are usually
denoted by X and Y. So, here we analyse the changes occured between the two variables
and to what extent. Apart from bivariate, there are other two statistical analyses, which
are Univariate (for one variable) and Multivariate (for multiple variables).
Correlation and Regression
Covariance
4 | P a g e
Workshop on 8/9/10 Aug, 2020
Definition of Bivariate Analysis
Bivariate analysis is stated to be an analysis of any concurrent relation between two
variables or attributes. This study explores the relationship of two variables as well as
the depth of this relationship to figure out if there are any discrepancies between two
variables and any causes of this difference. Some of the examples are percentage table,
scatter plot, etc.
This type of data involves two different variables. The analysis of this type of data deals
with causes and relationships and the analysis is done to find out the relationship among
the two variables. Example of bivariate data can be temperature and ice cream sales in
summer season
Table 3
Suppose the temperature and ice cream sales are the two variables of a bivariate data
(Table 3). Here, the relationship is visible from the table that temperature and sales are
directly proportional to each other and thus related because as the temperature
increases, the sales also increase. Thus bivariate data analysis involves comparisons,
relationships, causes and explanations. These variables are often plotted on X and Y axis
5 | P a g e
Workshop on 8/9/10 Aug, 2020
on the graph for better understanding of data and one of these variables is independent
while the other is dependent.
It can be represented in better using scatter plot.
What is multivariate analysis?
When the data involves three or more variables, it is categorized under multivariate.
Example of this type of data is suppose an advertiser wants to compare the popularity of
four advertisements on a website, then their click rates could be measured for both men
and women and relationships between variables can then be examined.
It is similar to bivariate but contains more than one dependent variable. The ways to
perform analysis on this data depends on the goals to be achieved. Some of the techniques
are regression analysis, path analysis, factor analysis and multivariate analysis of
variance (MANOVA).
Multivariate analysis is used to study more complex sets of data than what Univariate
analysis methods can handle. This type of analysis is almost always performed with
software (i.e. SPSS or SAS, R, Gretl etc), as working with even the smallest of data sets can
be overwhelming by hand.
Multivariate analysis can reduce the likelihood of Type I errors. Sometimes, univariate
analysis is preferred as multivariate techniques can result in difficulty interpreting the
results of the test. For example, group differences on a linear combination of dependent
variables in MANOVA can be unclear. In addition, multivariate analysis is usually
unsuitable for small sets of data.
6 | P a g e
Workshop on 8/9/10 Aug, 2020
There are more than 20 different ways to perform multivariate analysis. Which one you
choose depends upon the type of data you have and what your goals are. For example, if
you have a single data set you have several choices:
Additive trees, multidimensional scaling, cluster analysis are appropriate for when the
rows and columns in your data table represent the same units and the measure is either
a similarity or a distance.
Principal component analysis (PCA) decomposes a data table with correlated measures
into a new set of uncorrelated measures.
Correspondence analysis is similar to PCA. However, it applies to contingency tables.
Although there are fairly clear boundaries with one data set (for example, if you have a
single data set in a contingency table your options are limited to correspondence
analysis), in most cases you’ll be able to choose from several methods. A few examples of
multivariate techniques are as follow:
Additive Tree.
Canonical Correlation Analysis.
Cluster Analysis.
Correspondence Analysis / Multiple
Correspondence Analysis.
Factor Analysis.
Independent Component Analysis.
MANOVA.
Multidimensional Scaling.
Multiple Regression Analysis.
Partial Least Square Regression.
Principal Component Analysis /
Regression / PARAFAC.
Redundancy Analysis.
7 | P a g e
Workshop on 8/9/10 Aug, 2020
8 | P a g e
Workshop on 8/9/10 Aug, 2020
DATA STRUCTURE
What is cross sectional data?
Cross sectional data is a part of the cross sectional study. A cross sectional data is data
collected by observing various subjects like (firms, countries, regions, individuals), at the
same point in time. A cross sectional data is analyzed by comparing the differences within
the subjects.
Basically, Cross sectional is a data which is collected from all the participants at the same
time. Time is not considered as a study variable during cross sectional research. Though,
this is also a fact that, during a cross sectional study, all the participants don’t give the
information at the same moment.
Cross sectional data is collected from the participants within a shorter time frame. This
time frame is also known as field period. Time only produces a variance in the results, but
it’s not biased.
If you expand your data collection process to involve daily sales revenue and expenses
over a span of time of few months, you will now be having a time series for expenditures
and sales.
Cross sectional data example
Take an example. Say, suppose you want to measure current blood pressure levels in a
population. 1000 people will be selected randomly from that population. It is also called
a cross section of that particular population range). Now, their Blood Pressure will be
measured. Their height, weight and other health factors will also be noted.
9 | P a g e
Workshop on 8/9/10 Aug, 2020
This cross sectional data provides you with a snapshot of that population. This data will
only provide the current proportion of the Blood pressure levels. On the basis of just one
cross sectional sample, you can’t judge whether the rate of Blood pressure raising is low
or high. But, it will surely give you an idea of the scenario.
Another cross sectional data example can be a cross sectional study performed on the
variations of ice cream flavours at a particular store and how people are responding to
those flavours. You can also obtain cross sectional data from a list of grades scored by a
class of students on a particular test.
Data collected on sales revenue, sales volume, expenses for the last month and number of
customers at a particular coffee shop. This is also a type of cross-sectional data. If you
expand your data collection process to involve daily sales revenue and expenses over a
span of time of a few months, you will now be having a time series for costs and sales.
What is a Time Series data?
A time series is a sequence of numerical data points in successive order. In investing, a
time series tracks the movement of the chosen data points, such as a security’s price, over
a specified period of time with data points recorded at regular intervals. There is no
minimum or maximum amount of time that must be included, allowing the data to be
gathered in a way that provides the information being sought by the investor or analyst
examining the activity.
[Important: Time series analysis can be useful to see how a given asset, security, or
economic variable changes over time.]
10 | P a g e
Workshop on 8/9/10 Aug, 2020
 Understanding Time Series
A time series can be taken on any variable that changes over time. This can be tracked
over the short term, such as the price of a security on the hour over the course of a
business day, or the long term, such as the price of a security at close on the last day of
every month over the course of five years.
 Time Series Analysis
Time series analysis can be useful to see how a given asset, security, or economic variable
changes over time. It can also be used to examine how the changes associated with the
chosen data point compare to shifts in other variables over the same time period.
For example, suppose you wanted to analyze a time series of daily closing stock prices for
a given stock over a period of one year. You would obtain a list of all the closing prices for
the stock from each day for the past year and list them in chronological order. This would
be a one-year daily closing price time series for the stock.
Delving a bit deeper, you might analyze time series data with technical analysis tools to
know whether the stock's time series shows any seasonality. This will help to determine
if the stock goes through peaks and troughs at regular times each year. Analysis in this
area would require taking the observed prices and correlating them to a chosen season.
This can include traditional calendar seasons, such as summer and winter, or retail
seasons, such as holiday seasons.
Alternatively, you can record a stock's share price changes as it relates to an economic
variable, such as the unemployment rate. By correlating the data points with information
relating to the selected economic variable, you can observe patterns in situations
exhibiting dependency between the data points and the chosen variable.
11 | P a g e
Workshop on 8/9/10 Aug, 2020
 Time Series Forecasting
Time series forecasting uses information regarding historical values and associated
patterns to predict future activity. Most often, this relates to trend analysis, cyclical
fluctuation analysis, and issues of seasonality. As with all forecasting methods, success is
not guaranteed.
Time Series Analysis is used for many applications such as:
Economic Forecasting
Sales Forecasting
Budgetary Analysis
Stock Market Analysis
Yield Projections
Process and Quality Control
Inventory Studies
Workload Projections
Utility Studies
Census Analysis
 Cross Sectional Data vs. Time Series Data
Data comes in various sizes and shapes. This data measures many things at different
times. Well, both time-series data and cross-sectional data are a specific interest of
financial analysts.
Various methods are used to analyze different types of data. It is, therefore, crucial to be
able to identify both time series and cross sectional data sets. Let’s discuss both one by
one and analyze the difference between both.
12 | P a g e
Workshop on 8/9/10 Aug, 2020
 Cross sectional data
These are the observations which come from different groups or individuals at a single
point of time. The underlying population should have members with similar
characteristics. For example, if you want to know how many companies are spending
their money on development and research?
Some of the companies spend less amount, and some spend a lot of research and
development. This will provide different data as there are various companies belonging
to different groups. Rather, you can analyze the companies belonging to a similar group
and then do a cross sectional analyses on them. Let’s now talk about Time-series data.
 Time-series data
These are observations which are collected at equally spaced time intervals. For example,
you can consider the daily closing price of a particular stock recorded over the past four
weeks. One thing is to be noted, and that is, too short or too long time can lead towards
time bias.
Other examples of Time series data can be, weekly sales graph of an ice-cream sold during
a holiday period at some shop. Another example can be, staff numbers noted at a college,
which was taken on a monthly basis. It was done to assess the turnover rates of the staff.
These examples can be used to showcase data patterns in the near future.
Let’s make it easier to understand. When the data is collected for the same variable over
time, like months, years, then this type of data is called as time-series data. The data might
be collected over months, years, but virtually, any time interval can be seen.
 Uses of Cross sectional data
13 | P a g e
Workshop on 8/9/10 Aug, 2020
Cross-sectional data is used in differential equations and statistical techniques. Primarily
it is used for cross-sectional regression. It is a kind of regression analysis for this data.
For instance, each individuals’ usage expenditure in a specific month can be regressed on
the basis of different aspects.
These aspects can be; incomes, wealth and their various demographic characteristics as
well. It is to judge how distinctions amongst those characteristics, result in the ultimate
behaviour of the consumers.
 Some practical examples of cross-sectional data
 Cross-sectional datasets are utilized mostly in Finance, economics and various
areas of social sciences.
 In applied microeconomics, cross-sectional data is used to study labour markets,
public funds, industrial organization theory, and health finance.
 Political researchers utilize cross-sectional information to break down
demography and electoral engagements.
 Cross-sectional data also has a role in comparing financial statements of two or
more companies. Financial analysts carry out this job. In a cross-sectional analysis,
the comparison is carried out at the same time. Whereas in time series data
analysis, a comparison between the financial statement of the company takes
place in several time periods.
 In retail, cross-sectional data plays a significant role. It can study the expenditure
trend of males and females of any age group.
14 | P a g e
Workshop on 8/9/10 Aug, 2020
 In business, cross-sectional data can be used to study the response to a single
change from people coming from different socio-economic status from a specific
geographical section.
 In medical and healthcare also cross-sectional data can be used to analyze how
many kids of age between 4 to 14 are prone to low calcium deficiency.
 Cross-sectional data allows collecting large information that further helps in quick
decision making.
The concept behind Rolling Cross-Section
In case of a rolling cross-section, the existence of an individual in a sample along with the
time period at which he was enrolled in that sample, both are defined through random
techniques.
The individual is chosen through a random technique from the existing population. After
the selection, a random date is allotted to each. It is a random data on whose basis an
individual’s interview is conducted and hence, it is made a part of the survey.
What is Panel data?
Panel data, also known as longitudinal data or cross-sectional time series data in some
special cases, is data that is derived from a (usually small) number of observations over
time on a (usually large) number of cross-sectional units like individuals, households,
firms, or governments.
In the disciplines of econometrics and statistics, panel data refers to multi-dimensional
data that generally involves measurements over some period of time. As such, panel data
consists of researcher's observations of numerous phenomena that were collected over
15 | P a g e
Workshop on 8/9/10 Aug, 2020
several time periods for the same group of units or entities. For example, a panel data set
may be one that follows a given sample of individuals over time and records observations
or information on each individual in the sample.
Basic Examples of Panel Data Sets
The following are very basic examples of two panel data sets for two to three individuals
over the course of several years in which the data collected or observed includes income,
age, and sex:
Panel Data Set A
Person Year Income (Rs) Age Sex
1 2016 20000 23 F
1 2017 25000 24 F
1 2018 27500 25 F
2 2016 35000 27 M
2 2017 42500 28 M
2 2018 50000 29 M
Panel Data Set B
Person Year Income (Rs) Age Sex
1 2016 20000 23 F
1 2017 25000 24 F
2 2016 27500 25 M
2 2017 35000 27 M
16 | P a g e
Workshop on 8/9/10 Aug, 2020
2 2018 42500 28 M
3 2016 50000 29 F
Both Panel Data Set A and Panel Data Set B above show the data collected (the
characteristics of income, age, and sex) over the course of several years for different
people. Panel Data Set A shows the data collected for two people (person 1 and person 2)
over the course of three years (2016, 2017, and 2018). This example data set would be
considered a balanced panel because each person is observed for the defined
characteristics of income, age, and sex each year of the study. Panel Data Set B, on the
other hand, would be considered an unbalanced panel as data does not exist for each
person each year. Characteristics of person 1 and person 2 were collected in 2016 and
2017, but person 3 is only observed in 2016, not 2017 and 2018.
 Analysis of Panel Data in Economic Research
There are two distinct sets of information that can be derived from cross-sectional time
series data. The cross-sectional component of the data set reflects the differences
observed between the individual subjects or entities whereas the time series component
which reflects the differences observed for one subject over time. For instance,
researchers could focus on the differences in data between each person in a panel study
and/or the changes in observed phenomena for one person over the course of the study
(e.g., the changes in income over time of person 1 in Panel Data Set A above).
It is panel data regression methods that permit economists to use these various sets of
information provided by panel data. As such, analysis of panel data can become extremely
complex. But this flexibility is precisely the advantage of panel data sets for economic
research as opposed to conventional cross-sectional or time series data. Panel data gives
17 | P a g e
Workshop on 8/9/10 Aug, 2020
researchers a large number of unique data points, which increases the researcher's
degree of freedom to explore explanatory variables and relationships.
 Example for a balanced panel:
The CSO in India is a household, survey, with the same size of 22,500 each quarter. Each
household has to record its consumption expenditures for 5 quarters. So each quarter
4500 members enter/leave the CSO. This is a balanced panel.
What is Pooled Data?
In pooled cross section, we will take random samples in different time periods, of
different units, i.e. each sample we take, will be populated by different individuals. This
is often used to see the impact of policy or programmes. For example we will take
household income data on households X, Y and Z, in 2000. And then we will take the same
income data on households G, F and A in 2005. Although we are interested in the same
data, we are taking different samples (using different households) in different time
periods.
Pooling data refers to two or more independent data sets of the same type.
 Pooled time series
We observe e.g. return series of several sectors, which are assumed to be independent of
each other, together with explanatory variables. The number of sectors, N, is usually
small. Observations are viewed as repeated measures at each point of time. So
parameters can be estimated with higher precision due to an increased sample size.
 Pooled cross sections
18 | P a g e
Workshop on 8/9/10 Aug, 2020
Mostly these type of data arise in surveys, where people are asked about e.g. their
attitudes to political parties. This survey is repeated, T times, before elections every week.
T is usually small. So we have several cross sections, but the persons asked are chosen
randomly. Hardly any person of one cross section is member of another one. The cross
sections are independent. Only overall questions can be answered, like the attitudes
within males or women, but no individual (even anonymous) paths can be identified.

More Related Content

What's hot

applied multivariate statistical techniques in agriculture and plant science 2
applied multivariate statistical techniques in agriculture and plant science 2applied multivariate statistical techniques in agriculture and plant science 2
applied multivariate statistical techniques in agriculture and plant science 2amir rahmani
 
Basic Statistical Concepts and Methods
Basic Statistical Concepts and MethodsBasic Statistical Concepts and Methods
Basic Statistical Concepts and MethodsAhmed-Refat Refat
 
data analysis techniques and statistical softwares
data analysis techniques and statistical softwaresdata analysis techniques and statistical softwares
data analysis techniques and statistical softwaresDr.ammara khakwani
 
Data Analysis using SPSS: Part 1
Data Analysis using SPSS: Part 1Data Analysis using SPSS: Part 1
Data Analysis using SPSS: Part 1Taddesse Kassahun
 
Statistical analysis using spss
Statistical analysis using spssStatistical analysis using spss
Statistical analysis using spssjpcagphil
 
Scale of measurement
Scale of measurementScale of measurement
Scale of measurementHennaAnsari
 
Scope and objective of the assignment
Scope and objective of the assignmentScope and objective of the assignment
Scope and objective of the assignmentGourab Chakraborty
 
Statistical Analysis Overview
Statistical Analysis OverviewStatistical Analysis Overview
Statistical Analysis OverviewEcumene
 
Introduction to Statistics
Introduction to StatisticsIntroduction to Statistics
Introduction to StatisticsSaurav Shrestha
 
Statistical Data Analysis | Data Analysis | Statistics Services | Data Collec...
Statistical Data Analysis | Data Analysis | Statistics Services | Data Collec...Statistical Data Analysis | Data Analysis | Statistics Services | Data Collec...
Statistical Data Analysis | Data Analysis | Statistics Services | Data Collec...Stats Statswork
 
Basic statistics by Neeraj Bhandari ( Surkhet.Nepal )
Basic statistics by Neeraj Bhandari ( Surkhet.Nepal )Basic statistics by Neeraj Bhandari ( Surkhet.Nepal )
Basic statistics by Neeraj Bhandari ( Surkhet.Nepal )Neeraj Bhandari
 
Introduction to statistics 1
Introduction to statistics 1Introduction to statistics 1
Introduction to statistics 1Anwar Afridi
 
Applied Statistical Methods - Question & Answer on SPSS
Applied Statistical Methods - Question & Answer on SPSSApplied Statistical Methods - Question & Answer on SPSS
Applied Statistical Methods - Question & Answer on SPSSGökhan Ayrancıoğlu
 
SPSS statistics - how to use SPSS
SPSS statistics - how to use SPSSSPSS statistics - how to use SPSS
SPSS statistics - how to use SPSScsula its training
 

What's hot (19)

applied multivariate statistical techniques in agriculture and plant science 2
applied multivariate statistical techniques in agriculture and plant science 2applied multivariate statistical techniques in agriculture and plant science 2
applied multivariate statistical techniques in agriculture and plant science 2
 
Basic Statistical Concepts and Methods
Basic Statistical Concepts and MethodsBasic Statistical Concepts and Methods
Basic Statistical Concepts and Methods
 
data analysis techniques and statistical softwares
data analysis techniques and statistical softwaresdata analysis techniques and statistical softwares
data analysis techniques and statistical softwares
 
Data Analysis using SPSS: Part 1
Data Analysis using SPSS: Part 1Data Analysis using SPSS: Part 1
Data Analysis using SPSS: Part 1
 
Statistical analysis using spss
Statistical analysis using spssStatistical analysis using spss
Statistical analysis using spss
 
Scale of measurement
Scale of measurementScale of measurement
Scale of measurement
 
Scope and objective of the assignment
Scope and objective of the assignmentScope and objective of the assignment
Scope and objective of the assignment
 
Statistical Analysis Overview
Statistical Analysis OverviewStatistical Analysis Overview
Statistical Analysis Overview
 
Chapter One Introduction To Business Statistics
Chapter One Introduction To Business StatisticsChapter One Introduction To Business Statistics
Chapter One Introduction To Business Statistics
 
Panel slides
Panel slidesPanel slides
Panel slides
 
Introduction to Statistics
Introduction to StatisticsIntroduction to Statistics
Introduction to Statistics
 
Statistical Data Analysis | Data Analysis | Statistics Services | Data Collec...
Statistical Data Analysis | Data Analysis | Statistics Services | Data Collec...Statistical Data Analysis | Data Analysis | Statistics Services | Data Collec...
Statistical Data Analysis | Data Analysis | Statistics Services | Data Collec...
 
Basic statistics by Neeraj Bhandari ( Surkhet.Nepal )
Basic statistics by Neeraj Bhandari ( Surkhet.Nepal )Basic statistics by Neeraj Bhandari ( Surkhet.Nepal )
Basic statistics by Neeraj Bhandari ( Surkhet.Nepal )
 
Data presenatation
Data presenatationData presenatation
Data presenatation
 
Lecture 1
Lecture 1Lecture 1
Lecture 1
 
Introduction to statistics 1
Introduction to statistics 1Introduction to statistics 1
Introduction to statistics 1
 
Applied Statistical Methods - Question & Answer on SPSS
Applied Statistical Methods - Question & Answer on SPSSApplied Statistical Methods - Question & Answer on SPSS
Applied Statistical Methods - Question & Answer on SPSS
 
Panel data content
Panel data contentPanel data content
Panel data content
 
SPSS statistics - how to use SPSS
SPSS statistics - how to use SPSSSPSS statistics - how to use SPSS
SPSS statistics - how to use SPSS
 

Similar to Data structure

Unit III - Statistical Process Control (SPC)
Unit III - Statistical Process Control (SPC)Unit III - Statistical Process Control (SPC)
Unit III - Statistical Process Control (SPC)Dr.Raja R
 
Data Analysis, Presentation and Interpretation of Data
Data Analysis, Presentation and Interpretation of DataData Analysis, Presentation and Interpretation of Data
Data Analysis, Presentation and Interpretation of DataRoqui Malijan
 
A review of statistics
A review of statisticsA review of statistics
A review of statisticsedisonre
 
Edisons Statistics
Edisons StatisticsEdisons Statistics
Edisons Statisticsteresa_soto
 
Edison S Statistics
Edison S StatisticsEdison S Statistics
Edison S Statisticsteresa_soto
 
Statistics  What you Need to KnowIntroductionOften, when peop.docx
Statistics  What you Need to KnowIntroductionOften, when peop.docxStatistics  What you Need to KnowIntroductionOften, when peop.docx
Statistics  What you Need to KnowIntroductionOften, when peop.docxdessiechisomjj4
 
Level of Measurement, Frequency Distribution,Stem & Leaf
Level of Measurement, Frequency Distribution,Stem & Leaf   Level of Measurement, Frequency Distribution,Stem & Leaf
Level of Measurement, Frequency Distribution,Stem & Leaf Qasim Raza
 
General Statistics boa
General Statistics boaGeneral Statistics boa
General Statistics boaraileeanne
 
Data science notes for ASDS calicut 2.pptx
Data science notes for ASDS calicut 2.pptxData science notes for ASDS calicut 2.pptx
Data science notes for ASDS calicut 2.pptxswapnaraghav
 
analysing_data_using_spss.pdf
analysing_data_using_spss.pdfanalysing_data_using_spss.pdf
analysing_data_using_spss.pdfDrAnilKannur1
 
Analysis Of Data Using SPSS
Analysis Of Data Using SPSSAnalysis Of Data Using SPSS
Analysis Of Data Using SPSSBrittany Brown
 
Business statistics (Basics)
Business statistics (Basics)Business statistics (Basics)
Business statistics (Basics)AhmedToheed3
 
MELJUN CORTES research lectures_evaluating_data_statistical_treatment
MELJUN CORTES research lectures_evaluating_data_statistical_treatmentMELJUN CORTES research lectures_evaluating_data_statistical_treatment
MELJUN CORTES research lectures_evaluating_data_statistical_treatmentMELJUN CORTES
 
SOC2002 Lecture 11
SOC2002 Lecture 11SOC2002 Lecture 11
SOC2002 Lecture 11Bonnie Green
 
Advice On Statistical Analysis For Circulation Research
Advice On Statistical Analysis For Circulation ResearchAdvice On Statistical Analysis For Circulation Research
Advice On Statistical Analysis For Circulation ResearchNancy Ideker
 
Statistics as a discipline
Statistics as a disciplineStatistics as a discipline
Statistics as a disciplineRosalinaTPayumo
 
n 2 3 n99 2.58 95 1.96 90 1.645.docx
n 2 3 n99 2.58 95 1.96 90 1.645.docxn 2 3 n99 2.58 95 1.96 90 1.645.docx
n 2 3 n99 2.58 95 1.96 90 1.645.docxgilpinleeanna
 

Similar to Data structure (20)

Medical Statistics.pptx
Medical Statistics.pptxMedical Statistics.pptx
Medical Statistics.pptx
 
Unit III - Statistical Process Control (SPC)
Unit III - Statistical Process Control (SPC)Unit III - Statistical Process Control (SPC)
Unit III - Statistical Process Control (SPC)
 
Data Analysis, Presentation and Interpretation of Data
Data Analysis, Presentation and Interpretation of DataData Analysis, Presentation and Interpretation of Data
Data Analysis, Presentation and Interpretation of Data
 
A review of statistics
A review of statisticsA review of statistics
A review of statistics
 
Edisons Statistics
Edisons StatisticsEdisons Statistics
Edisons Statistics
 
Edison S Statistics
Edison S StatisticsEdison S Statistics
Edison S Statistics
 
Statistics  What you Need to KnowIntroductionOften, when peop.docx
Statistics  What you Need to KnowIntroductionOften, when peop.docxStatistics  What you Need to KnowIntroductionOften, when peop.docx
Statistics  What you Need to KnowIntroductionOften, when peop.docx
 
Level of Measurement, Frequency Distribution,Stem & Leaf
Level of Measurement, Frequency Distribution,Stem & Leaf   Level of Measurement, Frequency Distribution,Stem & Leaf
Level of Measurement, Frequency Distribution,Stem & Leaf
 
General Statistics boa
General Statistics boaGeneral Statistics boa
General Statistics boa
 
Data science notes for ASDS calicut 2.pptx
Data science notes for ASDS calicut 2.pptxData science notes for ASDS calicut 2.pptx
Data science notes for ASDS calicut 2.pptx
 
analysing_data_using_spss.pdf
analysing_data_using_spss.pdfanalysing_data_using_spss.pdf
analysing_data_using_spss.pdf
 
analysing_data_using_spss.pdf
analysing_data_using_spss.pdfanalysing_data_using_spss.pdf
analysing_data_using_spss.pdf
 
Analysis Of Data Using SPSS
Analysis Of Data Using SPSSAnalysis Of Data Using SPSS
Analysis Of Data Using SPSS
 
Business statistics (Basics)
Business statistics (Basics)Business statistics (Basics)
Business statistics (Basics)
 
MELJUN CORTES research lectures_evaluating_data_statistical_treatment
MELJUN CORTES research lectures_evaluating_data_statistical_treatmentMELJUN CORTES research lectures_evaluating_data_statistical_treatment
MELJUN CORTES research lectures_evaluating_data_statistical_treatment
 
SOC2002 Lecture 11
SOC2002 Lecture 11SOC2002 Lecture 11
SOC2002 Lecture 11
 
Advice On Statistical Analysis For Circulation Research
Advice On Statistical Analysis For Circulation ResearchAdvice On Statistical Analysis For Circulation Research
Advice On Statistical Analysis For Circulation Research
 
Correlational Study
Correlational StudyCorrelational Study
Correlational Study
 
Statistics as a discipline
Statistics as a disciplineStatistics as a discipline
Statistics as a discipline
 
n 2 3 n99 2.58 95 1.96 90 1.645.docx
n 2 3 n99 2.58 95 1.96 90 1.645.docxn 2 3 n99 2.58 95 1.96 90 1.645.docx
n 2 3 n99 2.58 95 1.96 90 1.645.docx
 

Recently uploaded

NLP Project PPT: Flipkart Product Reviews through NLP Data Science.pptx
NLP Project PPT: Flipkart Product Reviews through NLP Data Science.pptxNLP Project PPT: Flipkart Product Reviews through NLP Data Science.pptx
NLP Project PPT: Flipkart Product Reviews through NLP Data Science.pptxBoston Institute of Analytics
 
专业一比一美国俄亥俄大学毕业证成绩单pdf电子版制作修改
专业一比一美国俄亥俄大学毕业证成绩单pdf电子版制作修改专业一比一美国俄亥俄大学毕业证成绩单pdf电子版制作修改
专业一比一美国俄亥俄大学毕业证成绩单pdf电子版制作修改yuu sss
 
Customer Service Analytics - Make Sense of All Your Data.pptx
Customer Service Analytics - Make Sense of All Your Data.pptxCustomer Service Analytics - Make Sense of All Your Data.pptx
Customer Service Analytics - Make Sense of All Your Data.pptxEmmanuel Dauda
 
Industrialised data - the key to AI success.pdf
Industrialised data - the key to AI success.pdfIndustrialised data - the key to AI success.pdf
Industrialised data - the key to AI success.pdfLars Albertsson
 
办理学位证中佛罗里达大学毕业证,UCF成绩单原版一比一
办理学位证中佛罗里达大学毕业证,UCF成绩单原版一比一办理学位证中佛罗里达大学毕业证,UCF成绩单原版一比一
办理学位证中佛罗里达大学毕业证,UCF成绩单原版一比一F sss
 
办理学位证纽约大学毕业证(NYU毕业证书)原版一比一
办理学位证纽约大学毕业证(NYU毕业证书)原版一比一办理学位证纽约大学毕业证(NYU毕业证书)原版一比一
办理学位证纽约大学毕业证(NYU毕业证书)原版一比一fhwihughh
 
Call Us ➥97111√47426🤳Call Girls in Aerocity (Delhi NCR)
Call Us ➥97111√47426🤳Call Girls in Aerocity (Delhi NCR)Call Us ➥97111√47426🤳Call Girls in Aerocity (Delhi NCR)
Call Us ➥97111√47426🤳Call Girls in Aerocity (Delhi NCR)jennyeacort
 
How we prevented account sharing with MFA
How we prevented account sharing with MFAHow we prevented account sharing with MFA
How we prevented account sharing with MFAAndrei Kaleshka
 
04242024_CCC TUG_Joins and Relationships
04242024_CCC TUG_Joins and Relationships04242024_CCC TUG_Joins and Relationships
04242024_CCC TUG_Joins and Relationshipsccctableauusergroup
 
Call Girls In Dwarka 9654467111 Escorts Service
Call Girls In Dwarka 9654467111 Escorts ServiceCall Girls In Dwarka 9654467111 Escorts Service
Call Girls In Dwarka 9654467111 Escorts ServiceSapana Sha
 
Dubai Call Girls Wifey O52&786472 Call Girls Dubai
Dubai Call Girls Wifey O52&786472 Call Girls DubaiDubai Call Girls Wifey O52&786472 Call Girls Dubai
Dubai Call Girls Wifey O52&786472 Call Girls Dubaihf8803863
 
RadioAdProWritingCinderellabyButleri.pdf
RadioAdProWritingCinderellabyButleri.pdfRadioAdProWritingCinderellabyButleri.pdf
RadioAdProWritingCinderellabyButleri.pdfgstagge
 
Kantar AI Summit- Under Embargo till Wednesday, 24th April 2024, 4 PM, IST.pdf
Kantar AI Summit- Under Embargo till Wednesday, 24th April 2024, 4 PM, IST.pdfKantar AI Summit- Under Embargo till Wednesday, 24th April 2024, 4 PM, IST.pdf
Kantar AI Summit- Under Embargo till Wednesday, 24th April 2024, 4 PM, IST.pdfSocial Samosa
 
Effects of Smartphone Addiction on the Academic Performances of Grades 9 to 1...
Effects of Smartphone Addiction on the Academic Performances of Grades 9 to 1...Effects of Smartphone Addiction on the Academic Performances of Grades 9 to 1...
Effects of Smartphone Addiction on the Academic Performances of Grades 9 to 1...limedy534
 
办理(Vancouver毕业证书)加拿大温哥华岛大学毕业证成绩单原版一比一
办理(Vancouver毕业证书)加拿大温哥华岛大学毕业证成绩单原版一比一办理(Vancouver毕业证书)加拿大温哥华岛大学毕业证成绩单原版一比一
办理(Vancouver毕业证书)加拿大温哥华岛大学毕业证成绩单原版一比一F La
 
原版1:1定制南十字星大学毕业证(SCU毕业证)#文凭成绩单#真实留信学历认证永久存档
原版1:1定制南十字星大学毕业证(SCU毕业证)#文凭成绩单#真实留信学历认证永久存档原版1:1定制南十字星大学毕业证(SCU毕业证)#文凭成绩单#真实留信学历认证永久存档
原版1:1定制南十字星大学毕业证(SCU毕业证)#文凭成绩单#真实留信学历认证永久存档208367051
 
Indian Call Girls in Abu Dhabi O5286O24O8 Call Girls in Abu Dhabi By Independ...
Indian Call Girls in Abu Dhabi O5286O24O8 Call Girls in Abu Dhabi By Independ...Indian Call Girls in Abu Dhabi O5286O24O8 Call Girls in Abu Dhabi By Independ...
Indian Call Girls in Abu Dhabi O5286O24O8 Call Girls in Abu Dhabi By Independ...dajasot375
 
Predicting Salary Using Data Science: A Comprehensive Analysis.pdf
Predicting Salary Using Data Science: A Comprehensive Analysis.pdfPredicting Salary Using Data Science: A Comprehensive Analysis.pdf
Predicting Salary Using Data Science: A Comprehensive Analysis.pdfBoston Institute of Analytics
 

Recently uploaded (20)

NLP Project PPT: Flipkart Product Reviews through NLP Data Science.pptx
NLP Project PPT: Flipkart Product Reviews through NLP Data Science.pptxNLP Project PPT: Flipkart Product Reviews through NLP Data Science.pptx
NLP Project PPT: Flipkart Product Reviews through NLP Data Science.pptx
 
专业一比一美国俄亥俄大学毕业证成绩单pdf电子版制作修改
专业一比一美国俄亥俄大学毕业证成绩单pdf电子版制作修改专业一比一美国俄亥俄大学毕业证成绩单pdf电子版制作修改
专业一比一美国俄亥俄大学毕业证成绩单pdf电子版制作修改
 
Customer Service Analytics - Make Sense of All Your Data.pptx
Customer Service Analytics - Make Sense of All Your Data.pptxCustomer Service Analytics - Make Sense of All Your Data.pptx
Customer Service Analytics - Make Sense of All Your Data.pptx
 
Industrialised data - the key to AI success.pdf
Industrialised data - the key to AI success.pdfIndustrialised data - the key to AI success.pdf
Industrialised data - the key to AI success.pdf
 
办理学位证中佛罗里达大学毕业证,UCF成绩单原版一比一
办理学位证中佛罗里达大学毕业证,UCF成绩单原版一比一办理学位证中佛罗里达大学毕业证,UCF成绩单原版一比一
办理学位证中佛罗里达大学毕业证,UCF成绩单原版一比一
 
办理学位证纽约大学毕业证(NYU毕业证书)原版一比一
办理学位证纽约大学毕业证(NYU毕业证书)原版一比一办理学位证纽约大学毕业证(NYU毕业证书)原版一比一
办理学位证纽约大学毕业证(NYU毕业证书)原版一比一
 
Deep Generative Learning for All - The Gen AI Hype (Spring 2024)
Deep Generative Learning for All - The Gen AI Hype (Spring 2024)Deep Generative Learning for All - The Gen AI Hype (Spring 2024)
Deep Generative Learning for All - The Gen AI Hype (Spring 2024)
 
Call Us ➥97111√47426🤳Call Girls in Aerocity (Delhi NCR)
Call Us ➥97111√47426🤳Call Girls in Aerocity (Delhi NCR)Call Us ➥97111√47426🤳Call Girls in Aerocity (Delhi NCR)
Call Us ➥97111√47426🤳Call Girls in Aerocity (Delhi NCR)
 
How we prevented account sharing with MFA
How we prevented account sharing with MFAHow we prevented account sharing with MFA
How we prevented account sharing with MFA
 
04242024_CCC TUG_Joins and Relationships
04242024_CCC TUG_Joins and Relationships04242024_CCC TUG_Joins and Relationships
04242024_CCC TUG_Joins and Relationships
 
Call Girls In Dwarka 9654467111 Escorts Service
Call Girls In Dwarka 9654467111 Escorts ServiceCall Girls In Dwarka 9654467111 Escorts Service
Call Girls In Dwarka 9654467111 Escorts Service
 
Dubai Call Girls Wifey O52&786472 Call Girls Dubai
Dubai Call Girls Wifey O52&786472 Call Girls DubaiDubai Call Girls Wifey O52&786472 Call Girls Dubai
Dubai Call Girls Wifey O52&786472 Call Girls Dubai
 
RadioAdProWritingCinderellabyButleri.pdf
RadioAdProWritingCinderellabyButleri.pdfRadioAdProWritingCinderellabyButleri.pdf
RadioAdProWritingCinderellabyButleri.pdf
 
Kantar AI Summit- Under Embargo till Wednesday, 24th April 2024, 4 PM, IST.pdf
Kantar AI Summit- Under Embargo till Wednesday, 24th April 2024, 4 PM, IST.pdfKantar AI Summit- Under Embargo till Wednesday, 24th April 2024, 4 PM, IST.pdf
Kantar AI Summit- Under Embargo till Wednesday, 24th April 2024, 4 PM, IST.pdf
 
Effects of Smartphone Addiction on the Academic Performances of Grades 9 to 1...
Effects of Smartphone Addiction on the Academic Performances of Grades 9 to 1...Effects of Smartphone Addiction on the Academic Performances of Grades 9 to 1...
Effects of Smartphone Addiction on the Academic Performances of Grades 9 to 1...
 
办理(Vancouver毕业证书)加拿大温哥华岛大学毕业证成绩单原版一比一
办理(Vancouver毕业证书)加拿大温哥华岛大学毕业证成绩单原版一比一办理(Vancouver毕业证书)加拿大温哥华岛大学毕业证成绩单原版一比一
办理(Vancouver毕业证书)加拿大温哥华岛大学毕业证成绩单原版一比一
 
原版1:1定制南十字星大学毕业证(SCU毕业证)#文凭成绩单#真实留信学历认证永久存档
原版1:1定制南十字星大学毕业证(SCU毕业证)#文凭成绩单#真实留信学历认证永久存档原版1:1定制南十字星大学毕业证(SCU毕业证)#文凭成绩单#真实留信学历认证永久存档
原版1:1定制南十字星大学毕业证(SCU毕业证)#文凭成绩单#真实留信学历认证永久存档
 
Indian Call Girls in Abu Dhabi O5286O24O8 Call Girls in Abu Dhabi By Independ...
Indian Call Girls in Abu Dhabi O5286O24O8 Call Girls in Abu Dhabi By Independ...Indian Call Girls in Abu Dhabi O5286O24O8 Call Girls in Abu Dhabi By Independ...
Indian Call Girls in Abu Dhabi O5286O24O8 Call Girls in Abu Dhabi By Independ...
 
Predicting Salary Using Data Science: A Comprehensive Analysis.pdf
Predicting Salary Using Data Science: A Comprehensive Analysis.pdfPredicting Salary Using Data Science: A Comprehensive Analysis.pdf
Predicting Salary Using Data Science: A Comprehensive Analysis.pdf
 
E-Commerce Order PredictionShraddha Kamble.pptx
E-Commerce Order PredictionShraddha Kamble.pptxE-Commerce Order PredictionShraddha Kamble.pptx
E-Commerce Order PredictionShraddha Kamble.pptx
 

Data structure

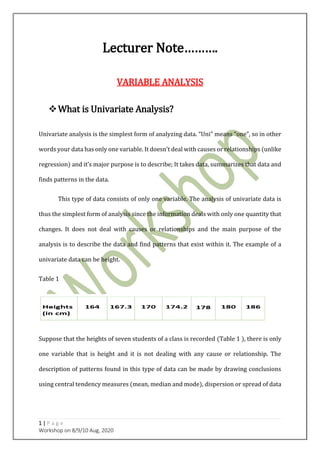
  • 1. 1 | P a g e Workshop on 8/9/10 Aug, 2020 Lecturer Note………. VARIABLE ANALYSIS What is Univariate Analysis? Univariate analysis is the simplest form of analyzing data. “Uni” means “one”, so in other words your data has only one variable. It doesn’t deal with causes or relationships (unlike regression) and it’s major purpose is to describe; It takes data, summarizes that data and finds patterns in the data. This type of data consists of only one variable. The analysis of univariate data is thus the simplest form of analysis since the information deals with only one quantity that changes. It does not deal with causes or relationships and the main purpose of the analysis is to describe the data and find patterns that exist within it. The example of a univariate data can be height. Table 1 Suppose that the heights of seven students of a class is recorded (Table 1 ), there is only one variable that is height and it is not dealing with any cause or relationship. The description of patterns found in this type of data can be made by drawing conclusions using central tendency measures (mean, median and mode), dispersion or spread of data
  • 2. 2 | P a g e Workshop on 8/9/10 Aug, 2020 (range, minimum, maximum, quartiles, variance and standard deviation) and by using frequency distribution tables, histograms, pie charts, frequency polygon and bar charts. What is a variable in Univariate Analysis? A variable in univariate analysis is just a condition or subset that your data falls into. You can think of it as a “category.” For example, the analysis might look at a variable of “age” or it might look at “sales”, “height” or “weight”. However, it doesn’t look at more than one variable at a time otherwise it becomes bivariate analysis (or in the case of 3 or more variables it would be called multivariate analysis). The following frequency distribution table (Table 2) shows one variable (left column) and the count in the right column. Table 2 Weekly sales Sales (weekly) Amount (Rs) Monday 25000 Tuesday 22000 Wednesday 23000 Thursday 22000 Friday 23000 Saturday 21000 Sunday 26000 Total 162000 You could have more than one variable in the above table. For example, you could add the variable “Location”or “Age” or something else, and make a separate column for location
  • 3. 3 | P a g e Workshop on 8/9/10 Aug, 2020 or age. In that case you would have bivariate data because you would then have two variables. Univariate Descriptive Statistics Some ways you can describe patterns found in univariate data include central tendency (mean, mode and median) and dispersion: range, variance, maximum, minimum, quartiles (including the interquartile range), and standard deviation. You have several options for describing data with univariate data. To represent the above date, there are following way as follows. Frequency Distribution Tables. Bar Charts. Histograms. Frequency Polygons. Pie Charts. What is bivariate analysis? Bivariate analysis is one of the statistical analysis where two variables are observed. One variable here is dependent while the other is independent. These variables are usually denoted by X and Y. So, here we analyse the changes occured between the two variables and to what extent. Apart from bivariate, there are other two statistical analyses, which are Univariate (for one variable) and Multivariate (for multiple variables). Correlation and Regression Covariance
  • 4. 4 | P a g e Workshop on 8/9/10 Aug, 2020 Definition of Bivariate Analysis Bivariate analysis is stated to be an analysis of any concurrent relation between two variables or attributes. This study explores the relationship of two variables as well as the depth of this relationship to figure out if there are any discrepancies between two variables and any causes of this difference. Some of the examples are percentage table, scatter plot, etc. This type of data involves two different variables. The analysis of this type of data deals with causes and relationships and the analysis is done to find out the relationship among the two variables. Example of bivariate data can be temperature and ice cream sales in summer season Table 3 Suppose the temperature and ice cream sales are the two variables of a bivariate data (Table 3). Here, the relationship is visible from the table that temperature and sales are directly proportional to each other and thus related because as the temperature increases, the sales also increase. Thus bivariate data analysis involves comparisons, relationships, causes and explanations. These variables are often plotted on X and Y axis
  • 5. 5 | P a g e Workshop on 8/9/10 Aug, 2020 on the graph for better understanding of data and one of these variables is independent while the other is dependent. It can be represented in better using scatter plot. What is multivariate analysis? When the data involves three or more variables, it is categorized under multivariate. Example of this type of data is suppose an advertiser wants to compare the popularity of four advertisements on a website, then their click rates could be measured for both men and women and relationships between variables can then be examined. It is similar to bivariate but contains more than one dependent variable. The ways to perform analysis on this data depends on the goals to be achieved. Some of the techniques are regression analysis, path analysis, factor analysis and multivariate analysis of variance (MANOVA). Multivariate analysis is used to study more complex sets of data than what Univariate analysis methods can handle. This type of analysis is almost always performed with software (i.e. SPSS or SAS, R, Gretl etc), as working with even the smallest of data sets can be overwhelming by hand. Multivariate analysis can reduce the likelihood of Type I errors. Sometimes, univariate analysis is preferred as multivariate techniques can result in difficulty interpreting the results of the test. For example, group differences on a linear combination of dependent variables in MANOVA can be unclear. In addition, multivariate analysis is usually unsuitable for small sets of data.
  • 6. 6 | P a g e Workshop on 8/9/10 Aug, 2020 There are more than 20 different ways to perform multivariate analysis. Which one you choose depends upon the type of data you have and what your goals are. For example, if you have a single data set you have several choices: Additive trees, multidimensional scaling, cluster analysis are appropriate for when the rows and columns in your data table represent the same units and the measure is either a similarity or a distance. Principal component analysis (PCA) decomposes a data table with correlated measures into a new set of uncorrelated measures. Correspondence analysis is similar to PCA. However, it applies to contingency tables. Although there are fairly clear boundaries with one data set (for example, if you have a single data set in a contingency table your options are limited to correspondence analysis), in most cases you’ll be able to choose from several methods. A few examples of multivariate techniques are as follow: Additive Tree. Canonical Correlation Analysis. Cluster Analysis. Correspondence Analysis / Multiple Correspondence Analysis. Factor Analysis. Independent Component Analysis. MANOVA. Multidimensional Scaling. Multiple Regression Analysis. Partial Least Square Regression. Principal Component Analysis / Regression / PARAFAC. Redundancy Analysis.
  • 7. 7 | P a g e Workshop on 8/9/10 Aug, 2020
  • 8. 8 | P a g e Workshop on 8/9/10 Aug, 2020 DATA STRUCTURE What is cross sectional data? Cross sectional data is a part of the cross sectional study. A cross sectional data is data collected by observing various subjects like (firms, countries, regions, individuals), at the same point in time. A cross sectional data is analyzed by comparing the differences within the subjects. Basically, Cross sectional is a data which is collected from all the participants at the same time. Time is not considered as a study variable during cross sectional research. Though, this is also a fact that, during a cross sectional study, all the participants don’t give the information at the same moment. Cross sectional data is collected from the participants within a shorter time frame. This time frame is also known as field period. Time only produces a variance in the results, but it’s not biased. If you expand your data collection process to involve daily sales revenue and expenses over a span of time of few months, you will now be having a time series for expenditures and sales. Cross sectional data example Take an example. Say, suppose you want to measure current blood pressure levels in a population. 1000 people will be selected randomly from that population. It is also called a cross section of that particular population range). Now, their Blood Pressure will be measured. Their height, weight and other health factors will also be noted.
  • 9. 9 | P a g e Workshop on 8/9/10 Aug, 2020 This cross sectional data provides you with a snapshot of that population. This data will only provide the current proportion of the Blood pressure levels. On the basis of just one cross sectional sample, you can’t judge whether the rate of Blood pressure raising is low or high. But, it will surely give you an idea of the scenario. Another cross sectional data example can be a cross sectional study performed on the variations of ice cream flavours at a particular store and how people are responding to those flavours. You can also obtain cross sectional data from a list of grades scored by a class of students on a particular test. Data collected on sales revenue, sales volume, expenses for the last month and number of customers at a particular coffee shop. This is also a type of cross-sectional data. If you expand your data collection process to involve daily sales revenue and expenses over a span of time of a few months, you will now be having a time series for costs and sales. What is a Time Series data? A time series is a sequence of numerical data points in successive order. In investing, a time series tracks the movement of the chosen data points, such as a security’s price, over a specified period of time with data points recorded at regular intervals. There is no minimum or maximum amount of time that must be included, allowing the data to be gathered in a way that provides the information being sought by the investor or analyst examining the activity. [Important: Time series analysis can be useful to see how a given asset, security, or economic variable changes over time.]
  • 10. 10 | P a g e Workshop on 8/9/10 Aug, 2020  Understanding Time Series A time series can be taken on any variable that changes over time. This can be tracked over the short term, such as the price of a security on the hour over the course of a business day, or the long term, such as the price of a security at close on the last day of every month over the course of five years.  Time Series Analysis Time series analysis can be useful to see how a given asset, security, or economic variable changes over time. It can also be used to examine how the changes associated with the chosen data point compare to shifts in other variables over the same time period. For example, suppose you wanted to analyze a time series of daily closing stock prices for a given stock over a period of one year. You would obtain a list of all the closing prices for the stock from each day for the past year and list them in chronological order. This would be a one-year daily closing price time series for the stock. Delving a bit deeper, you might analyze time series data with technical analysis tools to know whether the stock's time series shows any seasonality. This will help to determine if the stock goes through peaks and troughs at regular times each year. Analysis in this area would require taking the observed prices and correlating them to a chosen season. This can include traditional calendar seasons, such as summer and winter, or retail seasons, such as holiday seasons. Alternatively, you can record a stock's share price changes as it relates to an economic variable, such as the unemployment rate. By correlating the data points with information relating to the selected economic variable, you can observe patterns in situations exhibiting dependency between the data points and the chosen variable.
  • 11. 11 | P a g e Workshop on 8/9/10 Aug, 2020  Time Series Forecasting Time series forecasting uses information regarding historical values and associated patterns to predict future activity. Most often, this relates to trend analysis, cyclical fluctuation analysis, and issues of seasonality. As with all forecasting methods, success is not guaranteed. Time Series Analysis is used for many applications such as: Economic Forecasting Sales Forecasting Budgetary Analysis Stock Market Analysis Yield Projections Process and Quality Control Inventory Studies Workload Projections Utility Studies Census Analysis  Cross Sectional Data vs. Time Series Data Data comes in various sizes and shapes. This data measures many things at different times. Well, both time-series data and cross-sectional data are a specific interest of financial analysts. Various methods are used to analyze different types of data. It is, therefore, crucial to be able to identify both time series and cross sectional data sets. Let’s discuss both one by one and analyze the difference between both.
  • 12. 12 | P a g e Workshop on 8/9/10 Aug, 2020  Cross sectional data These are the observations which come from different groups or individuals at a single point of time. The underlying population should have members with similar characteristics. For example, if you want to know how many companies are spending their money on development and research? Some of the companies spend less amount, and some spend a lot of research and development. This will provide different data as there are various companies belonging to different groups. Rather, you can analyze the companies belonging to a similar group and then do a cross sectional analyses on them. Let’s now talk about Time-series data.  Time-series data These are observations which are collected at equally spaced time intervals. For example, you can consider the daily closing price of a particular stock recorded over the past four weeks. One thing is to be noted, and that is, too short or too long time can lead towards time bias. Other examples of Time series data can be, weekly sales graph of an ice-cream sold during a holiday period at some shop. Another example can be, staff numbers noted at a college, which was taken on a monthly basis. It was done to assess the turnover rates of the staff. These examples can be used to showcase data patterns in the near future. Let’s make it easier to understand. When the data is collected for the same variable over time, like months, years, then this type of data is called as time-series data. The data might be collected over months, years, but virtually, any time interval can be seen.  Uses of Cross sectional data
  • 13. 13 | P a g e Workshop on 8/9/10 Aug, 2020 Cross-sectional data is used in differential equations and statistical techniques. Primarily it is used for cross-sectional regression. It is a kind of regression analysis for this data. For instance, each individuals’ usage expenditure in a specific month can be regressed on the basis of different aspects. These aspects can be; incomes, wealth and their various demographic characteristics as well. It is to judge how distinctions amongst those characteristics, result in the ultimate behaviour of the consumers.  Some practical examples of cross-sectional data  Cross-sectional datasets are utilized mostly in Finance, economics and various areas of social sciences.  In applied microeconomics, cross-sectional data is used to study labour markets, public funds, industrial organization theory, and health finance.  Political researchers utilize cross-sectional information to break down demography and electoral engagements.  Cross-sectional data also has a role in comparing financial statements of two or more companies. Financial analysts carry out this job. In a cross-sectional analysis, the comparison is carried out at the same time. Whereas in time series data analysis, a comparison between the financial statement of the company takes place in several time periods.  In retail, cross-sectional data plays a significant role. It can study the expenditure trend of males and females of any age group.
  • 14. 14 | P a g e Workshop on 8/9/10 Aug, 2020  In business, cross-sectional data can be used to study the response to a single change from people coming from different socio-economic status from a specific geographical section.  In medical and healthcare also cross-sectional data can be used to analyze how many kids of age between 4 to 14 are prone to low calcium deficiency.  Cross-sectional data allows collecting large information that further helps in quick decision making. The concept behind Rolling Cross-Section In case of a rolling cross-section, the existence of an individual in a sample along with the time period at which he was enrolled in that sample, both are defined through random techniques. The individual is chosen through a random technique from the existing population. After the selection, a random date is allotted to each. It is a random data on whose basis an individual’s interview is conducted and hence, it is made a part of the survey. What is Panel data? Panel data, also known as longitudinal data or cross-sectional time series data in some special cases, is data that is derived from a (usually small) number of observations over time on a (usually large) number of cross-sectional units like individuals, households, firms, or governments. In the disciplines of econometrics and statistics, panel data refers to multi-dimensional data that generally involves measurements over some period of time. As such, panel data consists of researcher's observations of numerous phenomena that were collected over
  • 15. 15 | P a g e Workshop on 8/9/10 Aug, 2020 several time periods for the same group of units or entities. For example, a panel data set may be one that follows a given sample of individuals over time and records observations or information on each individual in the sample. Basic Examples of Panel Data Sets The following are very basic examples of two panel data sets for two to three individuals over the course of several years in which the data collected or observed includes income, age, and sex: Panel Data Set A Person Year Income (Rs) Age Sex 1 2016 20000 23 F 1 2017 25000 24 F 1 2018 27500 25 F 2 2016 35000 27 M 2 2017 42500 28 M 2 2018 50000 29 M Panel Data Set B Person Year Income (Rs) Age Sex 1 2016 20000 23 F 1 2017 25000 24 F 2 2016 27500 25 M 2 2017 35000 27 M
  • 16. 16 | P a g e Workshop on 8/9/10 Aug, 2020 2 2018 42500 28 M 3 2016 50000 29 F Both Panel Data Set A and Panel Data Set B above show the data collected (the characteristics of income, age, and sex) over the course of several years for different people. Panel Data Set A shows the data collected for two people (person 1 and person 2) over the course of three years (2016, 2017, and 2018). This example data set would be considered a balanced panel because each person is observed for the defined characteristics of income, age, and sex each year of the study. Panel Data Set B, on the other hand, would be considered an unbalanced panel as data does not exist for each person each year. Characteristics of person 1 and person 2 were collected in 2016 and 2017, but person 3 is only observed in 2016, not 2017 and 2018.  Analysis of Panel Data in Economic Research There are two distinct sets of information that can be derived from cross-sectional time series data. The cross-sectional component of the data set reflects the differences observed between the individual subjects or entities whereas the time series component which reflects the differences observed for one subject over time. For instance, researchers could focus on the differences in data between each person in a panel study and/or the changes in observed phenomena for one person over the course of the study (e.g., the changes in income over time of person 1 in Panel Data Set A above). It is panel data regression methods that permit economists to use these various sets of information provided by panel data. As such, analysis of panel data can become extremely complex. But this flexibility is precisely the advantage of panel data sets for economic research as opposed to conventional cross-sectional or time series data. Panel data gives
  • 17. 17 | P a g e Workshop on 8/9/10 Aug, 2020 researchers a large number of unique data points, which increases the researcher's degree of freedom to explore explanatory variables and relationships.  Example for a balanced panel: The CSO in India is a household, survey, with the same size of 22,500 each quarter. Each household has to record its consumption expenditures for 5 quarters. So each quarter 4500 members enter/leave the CSO. This is a balanced panel. What is Pooled Data? In pooled cross section, we will take random samples in different time periods, of different units, i.e. each sample we take, will be populated by different individuals. This is often used to see the impact of policy or programmes. For example we will take household income data on households X, Y and Z, in 2000. And then we will take the same income data on households G, F and A in 2005. Although we are interested in the same data, we are taking different samples (using different households) in different time periods. Pooling data refers to two or more independent data sets of the same type.  Pooled time series We observe e.g. return series of several sectors, which are assumed to be independent of each other, together with explanatory variables. The number of sectors, N, is usually small. Observations are viewed as repeated measures at each point of time. So parameters can be estimated with higher precision due to an increased sample size.  Pooled cross sections
  • 18. 18 | P a g e Workshop on 8/9/10 Aug, 2020 Mostly these type of data arise in surveys, where people are asked about e.g. their attitudes to political parties. This survey is repeated, T times, before elections every week. T is usually small. So we have several cross sections, but the persons asked are chosen randomly. Hardly any person of one cross section is member of another one. The cross sections are independent. Only overall questions can be answered, like the attitudes within males or women, but no individual (even anonymous) paths can be identified.