QNBFS Daily Market Report April 19, 2021
•
0 likes•82 views

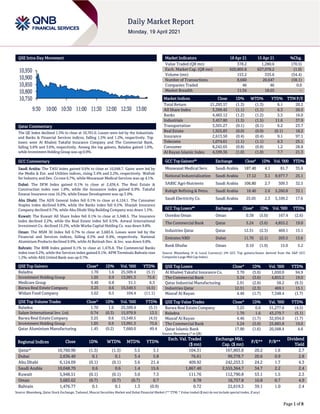
The QE Index declined 1.3% to close at 10,761.0. Losses were led by the Industrials and Banks & Financial Services indices, falling 1.5% and 1.2%, respectively.

Recommended
Recommended
More Related Content
What's hot
What's hot (20)
Similar to QNBFS Daily Market Report April 19, 2021
Similar to QNBFS Daily Market Report April 19, 2021 (20)
More from QNB Group
More from QNB Group (20)
Recently uploaded
Recently uploaded (20)
QNBFS Daily Market Report April 19, 2021
- 1. Page 1 of 8 QSE Intra-Day Movement Qatar Commentary The QE Index declined 1.3% to close at 10,761.0. Losses were led by the Industrials and Banks & Financial Services indices, falling 1.5% and 1.2%, respectively. Top losers were Al Khaleej Takaful Insurance Company and The Commercial Bank, falling 5.6% and 3.6%, respectively. Among the top gainers, Baladna gained 1.6%, while Investment Holding Group was up 0.9%. GCC Commentary Saudi Arabia: The TASI Index gained 0.6% to close at 10,048.7. Gains were led by the Media & Ent. and Utilities indices, rising 3.4% and 2.2%, respectively. Wafrah for Industry and Dev. Co rose 6.7%, while Mouwasat Medical Services was up 4.1%. Dubai: The DFM Index gained 0.1% to close at 2,636.4. The Real Estate & Construction index rose 1.8%, while the Insurance index gained 0.9%. Takaful Emarat Insurance rose 10.2%, while Emaar Development was up 3.0%. Abu Dhabi: The ADX General Index fell 0.1% to close at 6,124.1. The Consumer Staples index declined 0.8%, while the Banks index fell 0.5%. Sharjah Insurance Company declined 9.7%, while Abu Dhabi Ship Building Company was down 1.5%. Kuwait: The Kuwait All Share Index fell 0.1% to close at 5,948.5. The Insurance index declined 2.2%, while the Real Estate index fell 0.5%. Amwal International Investment Co. declined 15.2%, while Warba Capital Holding Co. was down 9.8%. Oman: The MSM 30 Index fell 0.7% to close at 3,683.6. Losses were led by the Financial and Services indices, falling 0.5% and 0.4%, respectively. National Aluminium Products declined 9.9%, while Al Batinah Dev. & Inv. was down 9.8%. Bahrain: The BHB Index gained 0.1% to close at 1,476.8. The Commercial Banks index rose 0.2%, while the Services index gained 0.1%. APM Terminals Bahrain rose 1.2%, while Ahli United Bank was up 0.7%. QSE Top Gainers Close* 1D% Vol. ‘000 YTD% Baladna 1.70 1.6 25,509.4 (5.1) Investment Holding Group 1.05 0.9 13,991.3 75.6 Medicare Group 9.40 0.8 51.1 6.3 Barwa Real Estate Company 3.25 0.6 15,549.5 (4.5) Widam Food Company 5.62 0.5 104.4 (11.1) QSE Top Volume Trades Close* 1D% Vol. ‘000 YTD% Baladna 1.70 1.6 25,509.4 (5.1) Salam International Inv. Ltd. 0.74 (0.3) 15,979.9 13.5 Barwa Real Estate Company 3.25 0.6 15,549.5 (4.5) Investment Holding Group 1.05 0.9 13,991.3 75.6 Qatar Aluminium Manufacturing 1.45 (0.2) 7,660.0 49.4 Market Indicators 18 Apr 21 15 Apr 21 %Chg. Value Traded (QR mn) 378.2 1,280.6 (70.5) Exch. Market Cap. (QR mn) 620,805.8 627,078.2 (1.0) Volume (mn) 153.2 335.6 (54.4) Number of Transactions 8,660 20,647 (58.1) Companies Traded 46 46 0.0 Market Breadth 11:34 18:25 – Market Indices Close 1D% WTD% YTD% TTM P/E Total Return 21,293.57 (1.3) (1.3) 6.1 20.2 All Share Index 3,399.45 (1.1) (1.1) 6.3 20.5 Banks 4,483.12 (1.2) (1.2) 5.5 16.0 Industrials 3,457.80 (1.5) (1.5) 11.6 37.9 Transportation 3,501.27 (0.1) (0.1) 6.2 23.7 Real Estate 1,925.83 (0.0) (0.0) (0.1) 18.2 Insurance 2,613.50 (0.4) (0.4) 9.1 97.1 Telecoms 1,074.61 (1.1) (1.1) 6.3 25.1 Consumer 8,242.65 (0.8) (0.8) 1.2 28.8 Al Rayan Islamic Index 4,599.36 (1.0) (1.0) 7.7 21.3 GCC Top Gainers## Exchange Close# 1D% Vol. ‘000 YTD% Mouwasat Medical Serv. Saudi Arabia 187.40 4.1 81.7 35.8 National Industrialization Saudi Arabia 17.12 3.1 8,977.7 25.1 SABIC Agri-Nutrients Saudi Arabia 106.80 2.7 309.3 32.5 Rabigh Refining & Petro. Saudi Arabia 18.40 2.6 5,260.8 33.1 Saudi Electricity Co. Saudi Arabia 25.05 2.3 5,109.2 17.6 GCC Top Losers## Exchange Close# 1D% Vol. ‘000 YTD% Ooredoo Oman Oman 0.38 (5.0) 167.4 (2.6) The Commercial Bank Qatar 5.24 (3.6) 4,855.2 19.0 Industries Qatar Qatar 12.51 (2.3) 469.1 15.1 Emirates NBD Dubai 11.70 (2.1) 203.5 13.6 Bank Dhofar Oman 0.10 (1.9) 15.0 5.2 Source: Bloomberg (# in Local Currency) (## GCC Top gainers/losers derived from the S&P GCC Composite Large Mid Cap Index) QSE Top Losers Close* 1D% Vol. ‘000 YTD% Al Khaleej Takaful Insurance Co. 3.70 (5.6) 1,650.0 94.9 The Commercial Bank 5.24 (3.6) 4,855.2 19.0 Qatar Industrial Manufacturing 2.91 (2.8) 58.2 (9.3) Industries Qatar 12.51 (2.3) 469.1 15.1 Masraf Al Rayan 4.46 (1.7) 7,348.4 (1.7) QSE Top Value Trades Close* 1D% Val. ‘000 YTD% Barwa Real Estate Company 3.25 0.6 51,277.6 (4.5) Baladna 1.70 1.6 43,279.7 (5.1) Masraf Al Rayan 4.46 (1.7) 32,934.0 (1.7) The Commercial Bank 5.24 (3.6) 25,883.8 19.0 Qatar Islamic Bank 17.90 (1.6) 20,568.4 4.6 Source: Bloomberg (* in QR) Regional Indices Close 1D% WTD% MTD% YTD% Exch. Val. Traded ($ mn) Exchange Mkt. Cap. ($ mn) P/E** P/B** Dividend Yield Qatar* 10,760.96 (1.3) (1.3) 3.5 3.1 104.31 167,803.8 20.2 1.6 2.7 Dubai 2,636.40 0.1 0.1 3.4 5.8 76.61 99,378.7 20.6 0.9 2.8 Abu Dhabi 6,124.09 (0.1) (0.1) 3.6 21.4 409.92 242,253.3 24.2 1.7 4.3 Saudi Arabia 10,048.70 0.6 0.6 1.4 15.6 1,867.40 2,555,364.7 34.7 2.2 2.4 Kuwait 5,948.51 (0.1) (0.1) 3.0 7.3 111.76 112,790.8 53.1 1.5 2.3 Oman 3,683.62 (0.7) (0.7) (0.7) 0.7 8.78 16,757.8 10.8 0.7 4.9 Bahrain 1,476.77 0.1 0.1 1.3 (0.9) 0.72 22,619.3 39.1 1.0 2.4 Source: Bloomberg, Qatar Stock Exchange, Tadawul, Muscat Securities Market and Dubai Financial Market (** TTM; * Value traded ($ mn) do not include special trades, if any) 10,750 10,800 10,850 10,900 10,950 9:30 10:00 10:30 11:00 11:30 12:00 12:30 13:00
- 2. Page 2 of 8 Qatar Market Commentary The QE Index declined 1.3% to close at 10,761.0. The Industrials and Banks & Financial Services indices led the losses. The index fell on the back of selling pressure from Qatari and GCC shareholders despite buying support from Arab and Foreign shareholders. Al Khaleej Takaful Insurance Company and The Commercial Bank were the top losers, falling 5.6% and 3.6%, respectively. Among the top gainers, Baladna gained 1.6%, while Investment Holding Group was up 0.9%. Volume of shares traded on Sunday fell by 54.4% to 153.2mn from 335.6mn on Thursday. Further, as compared to the 30-day moving average of 294.4mn, volume for the day was 48.0% lower. Baladna and Salam International Investment Limited were the most active stocks, contributing 16.7% and 10.4% to the total volume, respectively. Source: Qatar Stock Exchange (*as a % of traded value) Earnings Releases and Earnings Calendar Earnings Releases Company Market Currency Revenue (mn) 1Q2021 % Change YoY Operating Profit (mn) 1Q2021 % Change YoY Net Profit (mn) 1Q2021 % Change YoY Dhofar Fisheries & Food Industries Co. Oman OMR 3.6 20.1% – – (0.2) N/A National Gas Co. Oman OMR 20.3 -0.5% – – (0.1) N/A Muscat Insurance Co. Oman OMR 7.2 -6.2% – – 0.3 N/A Al Hassan Engineering Co. Oman OMR 2.5 -67.5% – – (1.3) N/A Vision Insurance Oman OMR 4.6 -49.3% – – 0.02 -93.6% Oman & Emirates Investment Holding Co. Oman OMR 0.4 N/A – – (0.2) N/A Al Ahlia Insurance Company Oman OMR 5.0 -15.9% – – 1.6 -1.5% National Life General Insurance Oman OMR 56.5 7.8% – – 2.7 15.0% Oman National Engineering & Investment Oman OMR 15.6 21.6% – – 0.3 -24.7% Oman Cement Co. Oman OMR 11.8 -15.8% – – 0.8 -33.0% Ooredoo Oman OMR 64.4 -4.5% – – 4.6 -25.8% Global Financial Inv. Holding Oman OMR 3.9 36.1% – – 0.4 N/A Muscat Finance Oman OMR 2.7 -10.8% 0.7 -29.9% 0.2 N/A Oman Oil Marketing Co. Oman OMR 122.4 -7.0% – – 0.7 16.1% Oman Investment & Finance Oman OMR 6.7 50.5% – – 1.1 320.8% Arabia Falcon Insurance Company Oman OMR 5.9 16.9% – – 0.5 1317.7% Takaful Oman Insurance Oman OMR – – – – 0.7 68.2% National Finance Co. Oman OMR 10.3 -7.7% – – 1.7 -15.2% A'Saffa Foods Oman OMR 7.8 -3.9% 0.5 0.6% 0.2 -30.0% Dhofar Tourism# Oman OMR - N/A – – (291.8) N/A Salalah Mills Co. Oman OMR 15.0 4.3% – – 1.1 21.6% Al Sharqiya Inv. Holding Co.# Oman OMR 431.8 -28.2% – – 277.4 -34.5% National Mineral Water Co. Oman OMR 1.7 -7.3% – – (0.03) N/A Dhofar Insurance Co. Oman OMR 16.0 19.8% – – 1.0 -9.2% Dhofar International Development Oman OMR 1.7 -11.6% 2.2 N/A 2.7 N/A Muscat Gases Co. Oman OMR 3.8 -28.9% – – 0.1 -71.7% Al Maha Petroleum Products Marketing Co. Oman OMR 81.7 -18.6% – – 0.4 202.9% Salalah Beach Resort Oman OMR 0.1 -80.8% – – (0.2) N/A Dhofar Beverage and Food Stuff Co.# Oman OMR 832.2 -4.5% – – (89.8) N/A Ominvest Oman OMR 52.1 -36.6% – – 9.4 0.5% Source: Company data, DFM, ADX, MSM, TASI, BHB. (#Values in Thousands) Overall Activity Buy %* Sell %* Net (QR) Qatari Individuals 53.12% 39.08% 53,084,777.1 Qatari Institutions 15.32% 35.56% (76,561,055.8) Qatari 68.44% 74.64% (23,476,278.6) GCC Individuals 1.26% 0.70% 2,122,835.1 GCC Institutions 2.26% 2.93% (2,521,698.2) GCC 3.52% 3.63% (398,863.1) Arab Individuals 9.73% 8.18% 5,875,407.0 Arab Institutions 0.01% – 41,700.0 Arab 9.75% 8.18% 5,917,107.0 Foreigners Individuals 3.53% 3.47% 213,665.1 Foreigners Institutions 14.77% 10.08% 17,744,369.6 Foreigners 18.29% 13.55% 17,958,034.7
- 3. Page 3 of 8 Earnings Calendar Tickers Company Name Date of reporting 1Q2021 results No. of days remaining Status MARK Masraf Al Rayan 19-Apr-21 0 Due BRES Barwa Real Estate Company 20-Apr-21 1 Due ABQK Ahli Bank 20-Apr-21 1 Due IHGS INMA Holding Group 21-Apr-21 2 Due MCGS Medicare Group 21-Apr-21 2 Due QNNS Qatar Navigation (Milaha) 21-Apr-21 2 Due UDCD United Development Company 21-Apr-21 2 Due KCBK Al Khalij Commercial Bank 22-Apr-21 3 Due CBQK The Commercial Bank 25-Apr-21 6 Due VFQS Vodafone Qatar 25-Apr-21 6 Due IGRD Investment Holding Group 25-Apr-21 6 Due QEWS Qatar Electricity & Water Company 25-Apr-21 6 Due QLMI QLM Life & Medical Insurance Company 26-Apr-21 7 Due ERES Ezdan Holding Group 26-Apr-21 7 Due DBIS Dlala Brokerage & Investment Holding Company 26-Apr-21 7 Due IQCD Industries Qatar 26-Apr-21 7 Due SIIS Salam International Investment Limited 26-Apr-21 7 Due QIIK Qatar International Islamic Bank 27-Apr-21 8 Due GWCS Gulf Warehousing Company 27-Apr-21 8 Due MPHC Mesaieed Petrochemical Holding Company 27-Apr-21 8 Due BLDN Baladna 27-Apr-21 8 Due AHCS Aamal Company 28-Apr-21 9 Due MERS Al Meera Consumer Goods Company 28-Apr-21 9 Due QAMC Qatar Aluminum Manufacturing Company 28-Apr-21 9 Due QCFS Qatar Cinema & Film Distribution Company 28-Apr-21 9 Due ORDS Ooredoo 28-Apr-21 9 Due MCCS Mannai Corporation 28-Apr-21 9 Due QIMD Qatar Industrial Manufacturing Company 28-Apr-21 9 Due AKHI Al Khaleej Takaful Insurance Company 28-Apr-21 9 Due DOHI Doha Insurance Group 28-Apr-21 9 Due QISI Qatar Islamic Insurance Group 28-Apr-21 9 Due DHBK Doha Bank 28-Apr-21 9 Due ZHCD Zad Holding Company 29-Apr-21 10 Due GISS Gulf International Services 29-Apr-21 10 Due QOIS Qatar Oman Investment Company 29-Apr-21 10 Due NLCS Alijarah Holding 29-Apr-21 10 Due Source: QSE
- 4. Page 4 of 8 News Qatar QGTS bottom line rises 14.7% YoY and 22.8% QoQ in 1Q2021, in-line with our estimate – Qatar Gas Transport Company Limited's (QGTS, Nakilat) net profit rose 14.7% YoY (+22.8% QoQ) to QR320.1mn in 1Q2021, in-line with our estimate of QR324.5mn (variation of -1.4%). The company's total income came in at QR1,007.2mn in 1Q2021, which represents a decrease of 1.4% YoY. However, on QoQ basis Total Income rose 5.9%. EPS amounted to QR0.06 in 1Q2021 as compared to QR0.05 in 1Q2020. Nakilat remained committed to achieving its vision and continued to deliver robust financial performance and sustained operational excellence, despite the challenges brought about by the COVID-19 pandemic. The company maintained its excellent track record of delivering clean energy to worldwide destinations without any interruptions, upholding its commitment to provide safe, reliable, and efficient shipping and maritime services. Additionally, the Nakilat group continues to strengthen its value proposition, with the ship repair, offshore fabrication, towage and other maritime services remaining full operational and contributing towards the company’s vision to be a global leader and provider of choice for energy transportation and maritime services, as well as Qatar’s 2030 vision. During the first quarter, company’s operating expenses decreased by 4.1%, while general and administrative expenses decreased by 28.1%. With solid business continuity plans and robust infrastructures in place, Nakilat has been able to swiftly adapt to the evolving situation and remain focused on creating value for its shareholders and customers. We maintain our Outperform rating and QR3.50/sh. Price Target (QNB FS Research, QSE, Peninsula Business) QIGD posts 38.4% YoY increase in net profit of QR37.1mn in 1Q2021 – Qatari Investors Group's (QIGD) net profit rose 38.4% YoY to QR37.1mn in 1Q2021, compared to QR26.8mn in 1Q2020, however, the net profit declined 1.1% on QoQ basis from QR37.5mn in 4Q2020. The company's revenue came in at QR192.2mn in 1Q2021 (which represents an increase of 4.2% YoY and +4.5% QoQ), versus QR184.5mn in 1Q2020 and QR183.8mn in 4Q2020. EPS amounted to QR0.03 in 1Q2021 as compared to QR0.02 in 1Q2020. (QSE) IQCD plans QR3.2bn capex for fertilizers segment in five years – Industries Qatar (IQCD), one of the region’s industrial giants with holdings in petrochemicals, fertilizer and steel producers, plans to invest around QR3.2bn as capital expenditure (capex) in various projects in its fertilizers segment over the next five years. The group had invested around QR135mn in form of capital expenditures for this segment during 2020. “In terms of capital expenditure for the future, the segment is expected to invest QR3.2bn in various projects over the next five years. The main projects the segment will invest during the next five years will include projects related to HSE, plant reliability, regulatory compliance, infrastructure, productivity, periodic maintenance turnarounds and other PPE additions,” said IQCD in its latest annual report. “These projects are not only intended to improve segment’s profitability and cash flows, but also would improve plants’ long-term plant life and HSE footprints,” it added. Through its subsidiaries and joint ventures (the group companies), IQCD operates in three distinct segments: Petrochemicals, Fertilizers and Steel. Fertilizer segment remained stable during the year. This was primarily due to robust demand and firm product prices. The segment was the least impacted by the COVID-19 pandemic or the weaker crude price environment. Like other segments within the Group, the core strategy within the fertilizer segment is also to optimize the value of operating assets, via maximizing the production, minimize the operating costs, and thereby enhancing the free cash-flows to the segment, noted the report. (Peninsula Qatar) Al Rayan Qatar ETF discloses its condensed financial statements for the three month period ended March 31 – Al Rayan Qatar ETF disclosed its condensed financial statement for the three-month period ended March 31, 2021. The statements showed that the net asset value as of March 31, 2021 amounted to QR540,241,468 representing QR2.4479 per unit. Dividends for the year ended December 31, 2020 will be distributed during 2Q2021. (QSE) WOQOD opens Ras Laffan new petrol station – As part of WOQOD’s ongoing expansion plans to be able to serve every area in Qatar, Qatar Fuel Company (QFLS, WOQOD) opened Ras Laffan petrol station, at Ras Laffan Industrial City, on April 18, 2021, and by this it raised its network of petrol stations to 107. New Ras Laffan petrol station is spread over an area of 15,000 square meters and has 3 lanes with 9 dispensers for light vehicles, and 2 lanes with 4 dispensers for Heavy Vehicles, which will serve Ras Laffan Industrial City, and its neighborhood. Ras Laffan petrol station offers round-the-clock services to residents, and includes Sidra convenience store, manual car wash, oil change and tire repair, for Light Vehicles and sale of LPG cylinders ‘SHAFAF’, in addition to sale of gasoline and diesel products for light vehicles and Heavy Vehicles. (QSE) ERES to disclose its 1Q2021 financial results on April 26 – Ezdan Holding Group (ERES) will disclose its financial statement for the period ending March 31, 2021 on April 26, 2021. (QSE) QLMI’s board of directors to meet on April 26 – QLM Life & Medical Insurance Company (QLMI) has announced that its board of directors will be holding a meeting on April 26, 2021 to discuss and disclose the company’s interim financial results for the period ending on March 31, 2021. (QSE) Milaha, Schlumberger begin Halul-48 operations in Qatar – Qatar Navigation (Milaha) and Schlumberger held a virtual event to mark the commencement of operations of the first Qatari-owned offshore well stimulation vessel Halul-48 that symbolizes the strong capabilities of the Qatari supply chain infrastructure. The establishment of the Halul-48 offshore stimulation vessel leveraged the respective expertise of both Milaha, the leading maritime and logistics service provider in Qatar, and Schlumberger, the leading provider of digital solutions and innovative technologies for the global energy industry. (Qatar Tribune) KPMG: Qatar's real estate market continues to face period of contraction – The decline in rental for residential developments was relatively softer compared to other core asset categories such as commercial office and retail, KPMG said in a report. Qatar's real estate market continues to face a period of contraction, a KPMG report said and noted the decline in rental
- 5. Page 5 of 8 for residential developments was relatively softer compared to other core asset categories such as commercial office and retail. Research showed the drop in rental for residential developments, which was still lower than other core asset categories, including commercial office and organized retail mall. Rentals in the affordable housing category continue to stay afloat while maintaining stable occupancy levels. The middle-income housing segment continues to experience active demand primarily due to movement of tenants seeking better value proposition, which includes locational advantages, superior offering at competitive rental due to added incentives such as rent-free periods of one to two months, free utility bills and better services as well as upliftment in amenities, KPMG said. While the drop in the rentals for the high-end housing segment has been primarily due to competitive landscape, there has been increase in inquiries especially for the developments at The Pearl and Lusail. Overall, 3Q and 4Q 2020 witnessed a combined drop of 3.63% on the residential rental index compared to 2.53% as witnessed during 1Q and 2Q 2020. For the commercial office market, the impact of COVID-19 was comparatively higher than residential segment. 3Q and 4Q 2020 witnessed a cumulative decline of 7.63% on the rental index compared to 1.56% experienced during the initial two quarters of 2020. On the organized retail mall front, the COVID-19 pandemic led to a significant decline in rentals. The rental index experienced a further drop of 8.77% over the last two quarters of 2020 from 2.36% as witnessed during 1Q and 2Q 2020. (Gulf- Times.com) MoPH: 35.5% of eligible population received at least one COVID-19 vaccine dose – Qatar’s national campaign against COVID-19 has crossed a milestone as one in three adults has received at least one dose of a vaccine. The Ministry of Public Health (MoPH) has announced that 35.5% of people aged 16 years and above have received at least one dose of the COVID- 19 vaccine since the start of Qatar’s National COVID-19 Vaccination Program. In its weekly update on Sunday, the MoPH said 1,248,229 doses of the vaccine have been administered in the country until now, with 168,453 doses being given in the last seven days. About 82.8% of people over 60 years of age (the most vulnerable population) have been vaccinated with at least one vaccine dose, while 67.5% have received both the doses. Similarly, the figure is 80.1% for people over 70 years of age, and 78.4% for people over 80 years of age. Around 60% of the eligible population will receive vaccination against COVID-19 in Qatar within two months by continuing the current pace, a senior official with the Ministry of Public Health (MoPH) has said. "Once vaccination reaches 80% of the eligible population, life could return to normal," MoPH, Head of Vaccination, Soha Al-Bayat told local Arabic daily Arrayah. The number of vaccine doses administered has exceeded 1.2mn. (Qatar Tribune, Gulf-Times.com) e-Payment Gateway sees over 582,100 online transactions in 1Q2021 – The online transactions between the government departments have surged in the first quarter of this year, reflecting the success of Qatar Digital Government program. More than 582,100 transactions were conducted through e- Payment Gateway in the first quarter of 2021, according to latest figures shared by the Ministry of Transport and Communications. The e-Pay (e-Payment Platform) provides online payment options for government entities seeking to develop their digital services and require online payment, which enables full automation of online services, by allowing users to pay their transaction fees online securely. It also allows government entities to add a feature to their digital services that allows inquiring about payment status by transaction number or date. According to a post shared by the MoTC on its Twitter account yesterday, number of transactions by government entities via e-Payment Gateway during first quarter of 2021 is 582,108. In January 2021; total 151,691 transactions were made while 159,832 and 270,585 transactions were made in February and March, respectively. (Peninsula Qatar) Qatar-based Global Carbon Council gets ICAO approval to supply carbon credits to airlines – With expectation to issue more than 10mn carbon credits in 2021, Qatar-based Global Carbon Council (GCC) is listed among eight international programs that are eligible to supply carbon credits to international airlines to meet their carbon neutral growth. In a statement the council said that across the world, carbon markets are gaining traction. By issuing carbon credits, they are assisting international organizations to offset unavoidable carbon emissions while also supporting the development of emission reduction projects and catalyzing climate actions. Global Carbon Council (GCC) - an initiative of Gulf Organisation for Research & Development (GORD) is the first and only global voluntary GHG Offsetting Program of MENA region. Established in 2016 and operational since 2019, GCC has now received full approval under Carbon Offsetting and Reduction Scheme for International Aviation (CORSIA) of United Nation's International Civil Aviation Organization (ICAO) on 19 March 2021. (Qatar Tribune) International Power companies urge Biden to implement policies to cut emissions 80% by 2030 – A group of US electricity companies wrote to President Joe Biden this week saying it will work with his administration and Congress to design a broad set of policies to reach a near-term goal of slashing the sector's carbon emissions by 2030. Washington should implement policies, including a clean energy standard, or CES, to ensure the electricity industry cuts carbon emissions 80 percent below 2005 levels by 2030, the group of 13 power interests, including generators Exelon Corp, PSEG and Talen Energy Corp, said in a letter to Biden. The letter, a copy of which was seen by Reuters, did not mention Biden's goal to fully decarbonize the power sector by 2035 as part of his strategy to fight climate change. But it said the 2030 timeline is consistent with Biden's wider goal of decarbonizing the entire economy by 2050. " A federal policy framework can be designed to support the power sector’s deployment of strategies that are technically feasible, ensure reliability, and maintain affordability for customers," said the letter, sent to Biden on Friday. The White House did not immediately respond to a request for comment. The 2030 goal was consistent with Evergreen Action, an advocacy group that proposed a CES in February. Sam Ricketts, a co-founder, said utilities should worry less about the 2035 goal, and focus on early wins as the last portion of emissions cuts is the hardest to achieve. Several lawmakers, including Democrats US
- 6. Page 6 of 8 Representative Frank Pallone and Senator Tina Smith, have introduced legislation that includes a CES. The standard would set gradually rising targets for the power industry to cut emissions until they hit net zero, with a range of methods from adopting wind and solar power, using existing and advanced nuclear energy, or sucking up carbon from coal and natural gas plants before they reach the atmosphere. (Reuters) UK economy picks up steam as hiring restarts with lockdown end – The UK economy is building momentum, with real-time indicators suggesting consumers have started to splurge some of the cash they’ve saved now that the government has loosened lockdown rules. Restaurant bookings and job postings surged to the highest since the start of the coronavirus pandemic, while road traffic and the number of people traveling to workplaces grew in recent weeks, data from Bloomberg Economics and government statistics show. Shops and bars were allowed to reopen on April 12, and most restrictions are set to lapse by June 21. With more almost two thirds of adults in the UK immunized against the coronavirus, Prime Minister Boris Johnson is starting to relax advice on containing the virus. Bank of England Governor Andrew Bailey anticipates a strong recovery as households unleash some of the 150bn Pounds ($207bn) of savings accumulated over the past year. (Bloomberg) Rightmove: Asking prices for UK houses hit new high after tax cut extended – Advertised prices for homes in Britain hit a record high after finance minister Rishi Sunak stoked the market again by extending a tax cut for home-buyers last month, property website Rightmove said on Monday. Asking prices jumped by 2.1% in the five weeks to April 10, only the second time in five years that prices have risen by more than 2% from one month to the next, Rightmove said. The rise took the average price of property coming to market to an all-time high of 327,797 Pounds ($451,737) and homes were selling in record-fast time, it said. On March 3 Sunak said he would extend a temporary tax break for buyers and he also announced a new mortgage guarantee scheme for first-time buyers who cannot afford large deposits. The tax break was rushed out in 2020 to counter the economic hit from coronavirus. It helped to fuel a mini-boom in the housing market which was already seeing strong demand from people seeking more space after their first lockdown. Other measures of British house prices have also shown a rise since Sunak’s announcement. Rightmove said its measure of available properties was at a record low. “However some of the froth is likely to come off this spring surge later in the year as the challenging economic conditions come to the fore, some of the government support to individuals and businesses unwinds, and the stamp duty holidays finally end in England and Wales,” it said. “Nevertheless we expect activity to remain robust for the rest of 2021.” (Reuters) Japan's exports post largest monthly gain since late 2017 – Japan’s exports posted their strongest growth in more than three years in March, led by a surge in China-bound shipments, in a sign the economic recovery from last year’s deep coronavirus slump remains intact. However, the trade data is unlikely to completely ease worries about the fragile recovery of the world’s third-largest economy, which took an enormous hit from a collapse in global trade due to the pandemic in 1Q2020. Ministry of Finance data showed exports surged 16.1% in March from a year earlier, marking the steepest rise since November 2017. That was better than an 11.6% jump expected by economists in a Reuters poll, and followed a 4.5% contraction in February. “The rebound in exports slowed significantly across 1Q and external demand is unlikely to provide much of a tailwind to growth this year,” said Tom Learmouth, Japan economist at Capital Economics. “The impressive annual figure was down to base effects from the weakness in exports in March 2020.” The exports surge was also marked by especially strong shipments to Japan’s largest trading partner China, while the pace of recovery in firms’ exports to the US remained relatively slow, said analysts. Shipments to China, Japan’s largest trading partner, soared 37.2% in the year to March, led by nonferrous metals and plastic materials, and also boosted by stronger exports of semiconductor machinery. However, Japan’s economy was likely to face headwinds from a slower recovery in US-bound shipments, which tend to add more value than those exported to China and elsewhere in Asia, for at least another couple of months, he added. (Reuters) MOF: Japan March exports rise 16.1% YoY – Japan’s exports jumped 16.1% in March from a year earlier, Ministry of Finance (MOF) data showed, as demand for goods recovered from low, pandemic-hit levels last year. The reading compared with an 11.6% increase expected by economists in a Reuters poll. It followed a 4.5% drop in February. Imports gained 5.7% in the year to March, versus the median estimate for a 4.7% increase and following a 11.8% rise in the previous month. The trade balance came to a surplus of 663.7bn Yen ($6.11bn), versus the median estimate for a 490.0bn Yen surplus. (Reuters) Regional Saudi's EIC in final stages of setting up Belgian company – Saudi Arabia’s Electrical Industries Co (EIC) is in the final stages of establishing a new company in Belgium, following the acquisition of the assets of a liquidated Belgian transformer company. EIC said that it had closed an assets purchase agreement with CG Power Belgium worth $6.044mn. The statement said the company was in the final stages of establishing a new company, PAUWELS Transformers Co, to which it will transfer assets from CG Power Belgium. The deal will be funded by EIC’s own resources as well as available facilities from banks, the statement said. EIC first announced it was in negotiations to acquire the assets of CG Power in August last year. (Zawya) Saudi's Ayyan Investment buys out minority shareholders in Al-Ahsa Medical Services – Saudi Arabia’s Ayyan Investment Company has announced a deal to buy out all the non- controlling shares of four investors in its subsidiary Al-Ahsa Medical Services Company. The company, which has investments in real estate, signed a share purchase agreement to acquire a combined 3.9mn shares from Al-Othman Holding Company, Saad Abdulaziz Al-Hussein and Sons Company, Ibrahim Abdullah Al-Afaleq and Sons Company and Rashid Saad Al-Rashid, a bourse filing to the Saudi Stock Exchange (Tadawul) said on Sunday. The stake is valued at more than SR111mn and represents 26.43% of the capital in Al-Ahsa
- 7. Page 7 of 8 Company. With the deal, Ayyan Investment’s ownership in Al- Ahsa will increase to 96.37% of the capital. Ayyan Company’s capital will also jump to SR806.4mn from SR737mn. In exchange for the additional stake, Ayyan Investment will issue 6.9 million shares in its company to the selling shareholders of Al-Ahsa. (Zawya) S&P views economic, industry risks in UAE's banking sector as stable – S&P has classified the UAE’s banking sector in group '5' under its Banking Industry Country Risk Assessment (BICRA). After the pandemic started, the Central Bank of the UAE (CBUAE) implemented a Targeted Economic Support Scheme (TESS), which helped ease the pressure on corporate issuers and small and midsize enterprises. However, the scheme did not reduce credit risk on the banking system's balance sheet, according to S&P’s report issued on Sunday. “The scheme included a provision that allows banks not to classify deferred exposures as Stage 2 and Stage 3. Rather, banks have classified deferrals into two groups: Group 1 (exposures to clients that are temporarily and mildly impacted); and Group 2 (exposures to clients that are significantly impacted and could see potential stage migrations) and disclosed the information, which we view as positive. At year-end 2020, 12% of the top 10 banks' exposures were classified as Group 1 and 2% as Group 2,” Credit Analyst, Puneet Tuli said in the report. The ratings agency has assessed the trend in economic risks in the country as stable. “We expect the residential real estate sector will remain under pressure for at least another year because of continuous oversupply, while demand-driven weaknesses will hamper the tourism, hospitality, and aviation sectors, as well as some trading sectors,” the report said. (Zawya) Consumer prices in Dubai dropped by 3.87% in March – The annual Consumer Price Index (CPI) in Dubai decreased by 3.87% in March 2021 compared to the same period last year. On a monthly basis, the CPI was 0.02% lower in March 2021 compared to February 2021. According to figures released by the Dubai Statistics Centre, prices of housing, water, electricity, gas and fuel decreased by 8.68% in March 2021 compared to the same period in 2020. Similarly, prices of food and beverages, healthcare, clothing and footwear were down by 3.97%, 0.01% and 2.57%, respectively. However, transportation prices in Dubai increased by 0.93% in March compared to the same period last year. Telecom as well as restaurant and hotel prices saw a slight surge of 0.07% and 0.77% in March 2021. (Zawya) Emirates NBD, ECI deal aims to foster UAE exporters, businesses – The UAE federal export credit company, Etihad Credit Insurance (ECI), and the Dubai-based lender, Emirates NBD, signed an agreement that enables the bank to leverage ECI’s insurance policy to provide credit facilities to UAE businesses. The backing of a federal export credit such as ECI helps the bank reduce any risks that may be associated with credit facilities, while supporting UAE businesses’ cashflow and capabilities to seek or continue their global operations, the export credit company said in a statement Sunday. The initiative, which is expected to improve the liquidity of UAE exporters and businesses and enhance their global competitiveness, follows the memorandum of understanding (MoU) signed in 2019 between the two partners. (Zawya) Sharjah Insurance's shareholders approve 7% dividends for 2020 – The ordinary general meeting (OGM) of Sharjah Insurance Co has approved distributing cash dividends, equivalent to 7% of the paid capital for 2020. The cash dividend distribution aggregates at a total amount of AED9.625mn, according to the company's disclosure to the Abu Dhabi Securities Exchange (ADX) on Sunday. The shareholders have set the last purchasing date on April 25 and the payment date within 30 days from the OGM date. (Zawya) S&P revises EQUATE Petrochemical Company’s outlook to Stable from Negative – S&P (S&P) has revised EQUATE Petrochemical Company’s (EQUATE) outlook to Stable from Negative. The faster-than-expected recovery in petrochemical prices, combined with EQUATE's competitive cost advantage, will support the company's deleveraging and above-average profitability. The Stable outlook reflects S&P’s expectations of EQUATE's continued above-average profitability, benefiting from continued volumes and rising commodity prices, but full distribution of profits, resulting in FFO to debt above 20% over the next 24 months. S&P stated, “In our base case, we currently anticipate that leverage will recover in 2021 to about 3x. S&P could raise the rating, provided group support is unchanged, if the company's operating environment and supply-demand dynamics improved prices such that FFO to debt approached 25% on a sustainable basis, coupled with positive DCF generation. S&P could lower the rating if the company incurred significant capital expenditure (capex), which could lead to negative free cash flow generation. S&P could also lower the rating if commodity prices declined significantly, preventing deleveraging, with FFO to debt declining below 15%. If dividend distributions remained high and resulted in negative DCF, this could further pressure the rating. Although less likely, we could also lower the rating if we saw weakening support from parent KPC.” S&P added, “We revised the outlook given our view of improving petrochemical prices, mainly for EG (80% of sales volumes), in the next 12-to-24 months. We now anticipate EG prices will recover to about $600 per ton in 2021, and slightly declining in 2022, to factor in expected global capacity additions, thereby improving EQUATE's credit metrics. The company's feedstock prices are partly linked to an average five-year oil index, which means its costs will not decline in line with rapidly falling petrochemical prices, which further supported margins above 30% in 2020 (compared with our estimate of about 30%). The company still maintains one of the lowest cost positions in the industry, and the added capacity from the commissioned Oyster Creek plant partially offset the subdued pricing environment. S&P now expect that EBITDA will remain will between $1.0bn -$1.4bn in 2021 and 2022, with margins between 35%-37% compared with 33.5% in 2020. Our base case points to deleveraging, despite the risk of dividends weighing on discretionary cash flow. (Bloomberg)
- 8. Contacts QNB Financial Services Co. W.L.L. Contact Center: (+974) 4476 6666 info@qnbfs.com.qa Doha, Qatar Saugata Sarkar, CFA, CAIA Shahan Keushgerian Mehmet Aksoy, PhD Head of Research Senior Research Analyst Senior Research Analyst saugata.sarkar@qnbfs.com.qa shahan.keushgerian@qnbfs.com.qa mehmet.aksoy@qnbfs.com.qa Disclaimer and Copyright Notice: This publication has been prepared by QNB Financial Services Co. W.L.L. (“QNBFS”) a wholly-owned subsidiary of Qatar National Bank (Q.P.S.C.). QNBFS is regulated by the Qatar Financial Markets Authority and the Qatar Exchange. Qatar National Bank (Q.P.S.C.) is regulated by the Qatar Central Bank. This publication expresses the views and opinions of QNBFS at a given time only. It is not an offer, promotion or recommendation to buy or sell securities or other investments, nor is it intended to constitute legal, tax, accounting, or financial advice. QNBFS accepts no liability whatsoever for any direct or indirect losses arising from use of this report. Any investment decision should depend on the individual circumstances of the investor and be based on specifically engaged investment advice. We therefore strongly advise potential investors to seek independent professional advice before making any investment decision. Although the information in this report has been obtained from sources that QNBFS believes to be reliable, we have not independently verified such information and it may not be accurate or complete. QNBFS does not make any representations or warranties as to the accuracy and completeness of the information it may contain, and declines any liability in that respect. For reports dealing with Technical Analysis, expressed opinions and/or recommendations may be different or contrary to the opinions/recommendations of QNBFS Fundamental Research as a result of depending solely on the historical technical data (price and volume). QNBFS reserves the right to amend the views and opinions expressed in this publication at any time. It may also express viewpoints or make investment decisions that differ significantly from, or even contradict, the views and opinions included in this report. This report may not be reproduced in whole or in part without permission from QNBFS. COPYRIGHT: No part of this document may be reproduced without the explicit written permission of QNBFS. Page 8 of 8 Rebased Performance Daily Index Performance Source: Bloomberg Source: Bloomberg Source: Bloomberg Source: Bloomberg (*$ adjusted returns) 60.0 80.0 100.0 120.0 140.0 160.0 Mar-17 Mar-18 Mar-19 Mar-20 Mar-21 QSE Index S&P Pan Arab S&P GCC 0.6% (1.3%) (0.1%) 0.1% (0.7%) (0.1%) 0.1% (1.4%) (0.7%) 0.0% 0.7% Saudi Arabia Qatar Kuwait Bahrain Oman Abu Dhabi Dubai Asset/Currency Performance Close ($) 1D% WTD% YTD% Global Indices Performance Close 1D%* WTD%* YTD%* Gold/Ounce 1,776.51 0.7 1.9 (6.4) MSCI World Index 2,953.35 0.4 1.5 9.8 Silver/Ounce 25.97 0.5 2.8 (1.6) DJ Industrial 34,200.67 0.5 1.2 11.7 Crude Oil (Brent)/Barrel (FM Future) 66.77 (0.3) 6.1 28.9 S&P 500 4,185.47 0.4 1.4 11.4 Crude Oil (WTI)/Barrel (FM Future) 63.13 (0.5) 6.4 30.1 NASDAQ 100 14,052.34 0.1 1.1 9.0 Natural Gas (Henry Hub)/MMBtu 2.61 1.6 7.9 9.2 STOXX 600 442.49 1.0 1.9 8.7 LPG Propane (Arab Gulf)/Ton 77.88 0.2 (5.0) 3.5 DAX 15,459.75 1.4 2.2 9.9 LPG Butane (Arab Gulf)/Ton 78.00 0.5 (7.3) 12.2 FTSE 100 7,019.53 0.8 2.2 10.0 Euro 1.20 0.1 0.7 (1.9) CAC 40 6,287.07 0.9 2.6 11.0 Yen 108.80 0.0 (0.8) 5.4 Nikkei 29,683.37 0.1 0.5 2.7 GBP 1.38 0.3 0.9 1.2 MSCI EM 1,348.69 0.6 0.7 4.4 CHF 1.09 0.3 0.5 (3.8) SHANGHAI SE Composite 3,426.62 0.8 (0.2) (1.2) AUD 0.77 (0.2) 1.5 0.5 HANG SENG 28,969.71 0.6 1.0 6.2 USD Index 91.56 (0.1) (0.7) 1.8 BSE SENSEX 48,832.03 0.3 (1.3) 0.2 RUB 75.83 (0.6) (2.0) 1.9 Bovespa 121,113.90 0.9 4.2 (5.9) BRL 0.18 0.4 1.6 (7.1) RTS 1,497.05 1.5 5.6 7.9 131.5 125.9 100.1