QNBFS Daily Technical Trader Qatar - September 07, 2023 التحليل الفني اليومي ...
Is the Recovery in Oil Prices Supply or Demand Driven?
1. Page 1 of 2
Economic Commentary
QNB Economics
economics@qnb.com
14 June, 2015
Is the Recovery in Oil Prices Supply or Demand Driven?
Oil prices have rebounded by 33.1% since their
trough in January to USD62.0 per barrel (/b).
What is behind this recovery? Is it due to a
pick-up in demand and the improvement of
economic conditions? Or was it due to a fall in
supply as lower prices drove high-cost
producers out of the market by? To answer
these questions, we adopt a methodology
which allows us to quantitatively disentangle
demand from supply factors. Our methodology
shows that demand was single-handedly
behind the recent recovery, but that supply
was responsible for the majority of the 60%
collapse in oil prices in the second half of 2014.
Our conclusions about the relative roles of
demand and supply are supported by
independent data from the International
Energy Agency (IEA). This suggests that the
recovery in oil prices still has legs as the
adjustment through lower supply is yet to
happen. As a result, we expect average oil
prices to rise in 2016 to USD64.1/b from an
expected USD56.2/b in 2015.
A simple way to distinguish between demand
and supply factors is to look at their impact on
both oil and stock prices. Higher global
demand, due to stronger growth for example,
will push up oil prices. It should also boost the
earnings of companies, leading to higher stock
prices. On the other hand, higher oil supply
will reduce oil prices, but, it should also lead to
lower energy costs, higher corporate profits
and consequently rising stock prices.
Therefore, the co-movement between oil and
stock prices provides a basis for identifying
demand and supply shocks. If oil and stock
prices move in the same direction, we interpret
this as being caused by a demand shock.
Conversely, if they move in opposite
directions, we interpret this as being driven by
an oil supply shock. Our methodology is a
modified version of the one recently used by
the IMF.
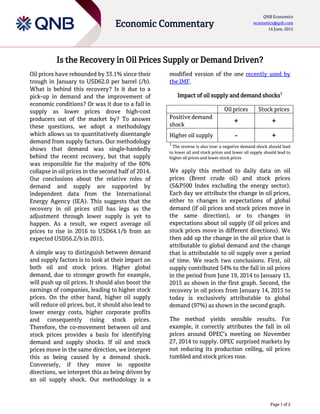
Impact of oil supply and demand shocks1
Oil prices Stock prices
Positive demand
shock
+ +
Higher oil supply - +
1
The reverse is also true: a negative demand shock should lead
to lower oil and stock prices and lower oil supply should lead to
higher oil prices and lower stock prices
We apply this method to daily data on oil
prices (Brent crude oil) and stock prices
(S&P500 Index excluding the energy sector).
Each day we attribute the change in oil prices,
either to changes in expectations of global
demand (if oil prices and stock prices move in
the same direction), or to changes in
expectations about oil supply (if oil prices and
stock prices move in different directions). We
then add up the change in the oil price that is
attributable to global demand and the change
that is attributable to oil supply over a period
of time. We reach two conclusions. First, oil
supply contributed 54% to the fall in oil prices
in the period from June 19, 2014 to January 13,
2015 as shown in the first graph. Second, the
recovery in oil prices from January 14, 2015 to
today is exclusively attributable to global
demand (97%) as shown in the second graph.
The method yields sensible results. For
example, it correctly attributes the fall in oil
prices around OPEC’s meeting on November
27, 2014 to supply. OPEC surprised markets by
not reducing its production ceiling, oil prices
tumbled and stock prices rose.
2. Page 2 of 2
Economic Commentary
QNB Economics
economics@qnb.com
14 June, 2015
Cumulative change in oil prices from June 19,
2014 to January 13, 2015
(%; % Contribution in parentheses)
Sources: Bloomberg and QNB Economics analysis
Cumulative change in oil prices from January
14, 2015 to June 4, 2015
(%; % Contribution in parentheses)
Sources: Bloomberg and QNB Economics analysis
The conclusions are also consistent with
independent data from the IEA. From June
2014 to December 2015, the IEA continuously
revised up its forecast for non-OPEC
production in 2015 while revising down its
forecast for global demand. This supports our
first conclusion that both demand and supply
factors were responsible for the oil price fall in
this period. Furthermore, the IEA’s forecast for
non-OPEC production in 2015 was unchanged
in June 2015 relative to December 2014.
Meanwhile, the IEA has continuously revised
up its forecast for global demand since the end
of last year. This is in line with our second
conclusion that the oil price recovery was
solely demand-driven.
In summary, our new methodology allows us
to disentangle demand factors from supply
shocks, and its conclusions are consistent with
other data in the oil market. Our method
shows that the recent recovery in oil prices
was driven by a strengthening in demand. This
could be due to the improvement in growth
prospects in advanced economies, especially in
the Euro Area and Japan. Our forecast for oil
prices to continue to recover is based on the
assumption that high cost oil producers,
particularly shale producers in the US, will be
forced to cut production in response to lower
oil prices. Based on our methodology, this has
not materialised yet. Therefore, we still expect
supply cutbacks to push up oil prices from
2016.
Contacts
Rory Fyfe
Senior Economist
+974-4453-4643
Ehsan Khoman
Economist
+974-4453-4423
Hamda Al-Thani
Economist
+974-4453-4646
Ziad Daoud
Economist
+974-4453-4642
Disclaimer and Copyright Notice: QNB Group accepts no liability whatsoever for any direct or indirect losses arising from use of this report.
Where an opinion is expressed, unless otherwise provided, it is that of the analyst or author only. Any investment decision should depend
on the individual circumstances of the investor and be based on specifically engaged investment advice. The report is distributed on a
complimentary basis. It may not be reproduced in whole or in part without permission from QNB Group.
-70%
-60%
-50%
-40%
-30%
-20%
-10%
0%
10%
Jun-14 Jul-14 Aug-14 Sep-14 Oct-14 Nov-14 Dec-14 Jan-15
Change to due demand (46%)
Change due to supply (54%)
Oil price
-10%
0%
10%
20%
30%
40%
50%
Jan-15 Feb-15 Mar-15 Apr-15 May-15 Jun-15
Change due to supply (3%)
Change due to demand (97%)
Oil price