1. July 2015
19
bond-buying. In addition to a US interest rate hike,
possible Greece default of its ECB loan would raise
global risk aversion to EM countries especially those
within Europe, further compounding portfolio outflows
from the region. The reduced risk tolerance should
also impact portfolio flows to countries with high current
account deficit as investors will more likely favour higher
quality investment. Nonetheless, nations with strong
economic outlook, favourable external positions and
credible reform programs should attract strong inflows.
Capital flows to EM Asia is at particular risk of a sharper-
than-expected slowdown in Chinese growth, while capital
flows to Malaysia and Indonesia will likely be impacted
by an interest rate hike in the US as both countries have
large foreign holdings of domestic bonds. Meanwhile,
India’s economic policies should continue to attract
FPI flows to the country. As for the European region,
the debt negotiations in Greece and Ukraine-Russia
crisis should continue to determine direction of capital
flows. Nonetheless, dissipation of political uncertainty
that trailed June parliamentary election in Turkey should
lead to increased inflow to the country. Elsewhere,
Saudi-Arabia’s opening of its equity market to foreigners
should continue to underpin FPI flows to the middle–east
region. In contrast, FPI inflows to Sub-Saharan Africa
will likely remain subdued following slowing economic
growth, political uncertainty, rising current account deficit
and depreciating currencies. However, plans by Ghana,
Tanzania and Kenya to each raise $1 billion Eurobond
could deliver some support. In summary, FPI flows will
remain wary of EM countries with domestic vulnerabilities
such as credit growth and debt burdens, implying portfolio
flows will remain volatile over the rest of 2015.
COMMODITY STABILITY:
INEVITABLE REPRIEVE OR
AWAITING THE NEXT WAVE?
Considering the depths plumbed by commodity prices
in H2 14, it only appears logical that the markets
pause for breath sometime after. Whilst the recurrent
theme of early signs of recovery suggests a floor
is being found, demand supply dynamics remain
broadly bearish for prices and indicate downside risks
may not be fully washed away.
DEAD-CAT BOUNCE
IN OIL MARKET?
Surging Iranian production
sends OPEC production higher
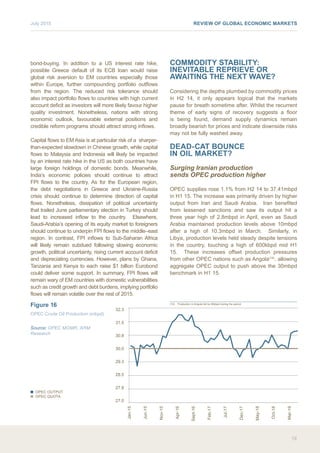
OPEC supplies rose 1.1% from H2 14 to 37.41mbpd
in H1 15. The increase was primarily driven by higher
output from Iran and Saudi Arabia. Iran benefited
from lessened sanctions and saw its output hit a
three year high of 2.8mbpd in April, even as Saudi
Arabia maintained production levels above 10mbpd
after a high of 10.3mbpd in March. Similarly, in
Libya, production levels held steady despite tensions
in the country, touching a high of 600kbpd mid H1
15. These increases offset production pressures
from other OPEC nations such as Angola(14)
, allowing
aggregate OPEC output to push above the 30mbpd
benchmark in H1 15.
(14) Production in Angola fell by 60kbpd during the period
Figure 16
OPEC Crude Oil Production (mbpd)
Source: OPEC MOMR, ARM
Research
■ OPEC OUTPUT
■ OPEC QUOTA
27.0
27.8
28.5
29.3
30.0
30.8
31.5
32.3
Jan-15
Jun-15
Nov-15
Apr-16
Sept-16
Feb-17
Jul-17
Dec-17
May-18
Oct-18
Mar-19
REVIEW OF GLOBAL ECONOMIC MARKETS
2. July 2015
20
As non-OPEC output shrugs off declines
in parts of North America
Non-OPEC production rose 0.35% to 57.9mbpd in
H1 15 (H2 14: 57.7mbpd) as higher output in the
US, Russia and China—more than offset declines
elsewhere. Interestingly, despite increased idling of
oil rigs in response to depressed oil prices, US
output—still driven by light tight oil—hit a 40 year high
of 9.6mbpd in H1 15 as producers focused on the
cheapest (and highest) yielding shale formations. In
addition, with a large share of shale output hedged
at elevated oil prices, producers were better able
to weather the low oil prices, even as industry
breakevens trended lower. In Russia, output broke
previous threshold levels to reach 11mbpd and China
continued to increase production following the oil spill at
its Penglai field in 2011. Meanwhile, high breakevens
on tar sands played a part in moderating production
in Canada while an explosion at the Pemex’s Abkatun
Permanente platform in the Gulf of Mexico on April 1
weighed on Mexican output. Overall, total crude oil
supply remained relatively flat (+0.6%) at 95.31mbpd
relative to H2 14 and increased 2.93% YoY.
Demand slows relative to H2 14
but improves YoY
Global demand in H1 15 shrank 0.64% from H2 14
to 92.85mbpd, but increased 1.33% YoY, with lower
oil prices positively impacting car sales in Europe
and US. With lower transportation costs, Europe’s
oil demand growth hit a twenty year peak of 3.9%
YoY in Q1 15 and in the US, auto sales hit a 13 year
high at 17.79 million with pickup trucks and SUVs
making up a majority of the gains. Asian regions
mainly followed the path led by Europe and US, with
India’s demand for crude oil peaking at 4.2mbpd,
benefiting from a combination of strong economic
growth and lower oil prices. Meanwhile, China’s
demand rose as the government increased offshore
and onshore reserves and was further bolstered by
increase in diesel oil for infrastructure projects. In
contrast, demand in Japan decreased as the country
moved away from dependency on fuel and crude oil to
alternatives such as natural gas, whereas in Mexico,
oil demand fell due to the decreased use of fuel oil
in the power sector. Nonetheless, the increase in
demand on a global front was not enough to narrow
the excess supply which increased 97% from H2 14 to
2.46mbpd (H1 14: 095mbpd).
Figure 17
Supply – Demand gap (mbpd)
Source: US IEA, ARM ; **2015-Q2
includes April and May.
■ BALANCE (RHS)
■ SUPPLY
■ DEMAND
-3.00
-2.00
-1.00
0.00
1.00
2.00
3.00
4.00
80.00
82.00
84.00
86.00
88.00
90.00
92.00
94.00
96.00
98.00
2010-Q2
2010-Q3
2010-Q4
2011-Q1
2011-Q2
2011-Q3
2011-Q4
2012-Q1
2012-Q2
2012-Q3
2012-Q4
2013-Q1
2013-Q2
2013-Q3
2013-Q4
2014-Q1
2014-Q2
2014-Q3
2014-Q4
2015-Q1
2015-Q2
REVIEW OF GLOBAL AND ECONOMIC MARKETS
3. July 2015
21
Despite the persisting oversupply, oil prices inched
higher in H1 15 after bottoming at $53.52/bbl in
January, for Brent Crude. In many ways, the recovery
reflected a bet that oil would rebound from the sharp
fall in H2 14 with money managers, in particular,
maintaining their bullish outlook on rising oil prices
by increasing their net long positions by 39% from
H2 14 to 222,357 lots as at May 2015. The steady
spread between Brent Crude and WTI Crude over H1
15, at an average of $6.37/bbl, suggests the positive
sentiment was broad-based and non-sensitive to the
supply vagaries in diverse regions. In contrast, the
premium typically enjoyed by Nigerian Bonny light
over Brent crude collapsed to become a $0.06/bbl
discount in H1 15 (H2 14: +$0.46) with implications
for domestic revenues.
Figure 18
Crude Oil Prices (US$)
Source: Bloomberg
■ BRENT CRUDE
■ WTI CRUDE
40
50
60
70
80
2-Dec-14
23-Dec-14
15-Jan-15
6-Feb-15
28-Feb-15
21-Mar-15
14-Apr-15
5-May-15
27-May-15
17-Jun-15
Figure 19
Nigeria Bonny Light – Brent Crude
discount (US $)
Source: CBN, Bloomberg,
ARM Research
■ NIGERIA BONNY LIGHT - BRENT
CRUDE DISCOUNT
-6.00
-4.00
-2.00
0.00
2.00
4.00
6.00
8.00
Jan-2009
Jul-2009
Jan-2010
Jul-2010
Jan-2011
Jul-2011
Jan-2012
Jul-2012
Jan-2013
Jul-2013
Jan-2014
Jul-2014
Jan-2015
REVIEW OF GLOBAL ECONOMIC MARKETS
4. July 2015
22
Iran and new shale dynamics could
boost supply further
Going into H2 15, OPEC is likely to boost crude
oil production in a bid to maintain its market
share even as the date set to resolve the issue
on Iranian sanctions approaches(15)
. As Iran waits
on the decision, it currently has 30mb of crude
on tankers(16)
, waiting to be shipped should the
(15) The initial deadline was June 30th and was extended to July 10th. At that meeting, a deal has been
reached which would allow Iran to slowly release its crude oil into the market.
(16) IEA Report
sanction be lifted. Evidently, the recent 3-year
high could easily be surpassed and we expect
production to increase by 1mbpd over the next 8 to
12 months. Similar expectations are attached to US
crude oil production, given the prolonged cutback in
rig counts did not appear to interfere with further
production rises. However, this partly reflected the
usual lag (~23 weeks) between when rig counts fall
and the impact on crude oil production materializes,
similar to the pattern in 2008 when production
levels initially rose slightly before tempering.
Nonetheless, as oil rig counts broke their 29 week
decline in July, factors other than the lag suggest
recent production gains might not be so fleeting.
First and foremost, while the widely accepted ~$80/
bbl breakeven for shale oil had been central to
expectations that shale production will wilt after
the crash, more recent indications are that shale
production is sustainable at as low as $60/bbl. The
lower breakeven prices stemmed from technological
advancements by shale producers as they moved
away from less efficient to more efficient oil wells
and rigs, implying more is being done with less. In
addition, producers reduced labor costs, allowing
some key players to slowly return to the market.
This is not to say that the impact of oil price
crash has not materialized at all; however in-the-
money hedges supported cash flows and provided
operations lifelines(17)
. Nonetheless, with high debt
levels, little chance of recreating similarly profitable
hedges and likely financing challenges for smaller
fields imply that the reprieve might be temporary,
as five shale companies declared bankruptcy in this
same period of overall improvement in production.
Hence, the key takeaway is that aggregate prognosis
for shale producers appear better than initially
feared with a couple of other factors boosting the
central support from lower breakevens. In all, whilst
lagged rig count impact means production will likely
fall by Q4 15 in the US, it will likely regain traction
in H2 16 as shale producers adapt to the low priced
(17) SandRidge Energy Inc. for example earned 64% of its revenue from payments from this insurance
hedge which guaranteed minimum prices of $90/bbl
Figure 20
US oil rig counts against US Crude
Oil production (kbpd)
Source: US EIA, Baker Hughes.
■ CRUDE OIL PRODUCTION (TBPD)
■ OIL RIG COUNTS - RHS
100
300
500
700
900
1,100
1,300
1,500
1,700
0
2000
4000
6000
8000
10000
12000
10-Oct-08
10-Apr-09
10-Oct-09
10-Apr-10
10-Oct-10
10-Apr-11
10-Oct-11
10-Apr-12
10-Oct-12
10-Apr-13
10-Oct-13
10-Apr-14
10-Oct-14
10-Apr-15
REVIEW OF GLOBAL AND ECONOMIC MARKETS
5. July 2015
23
oil environment, with breakevens expected to fall
further as a result of technological improvements.
Whilst OPEC and, in particular, Saudi Arabia’s
strategy might impair the least efficient producers,
in conjunction with likely on-streaming of Iranian
output we envisage aggregate supply will remain
elevated going forward.
Even as demand hotspots cool off
Despite revisions to its projected growth, China
overtook the US as the world’s largest oil importer
in May 2015 as it continued to build reserves during
H1 15. Whilst we expect demand to increase in
China, we believe the rate of increase will slow, due
to the difficulties the country faces as it changes the
structure of its economy to be more consumption
driven vs. investment driven. Similarly in Europe,
the tensions in Greece following its default on its
IMF loan could result in a ripple effect across the
continent’s economy, thereby weighing negatively
on demand. However, like China we only expect
the rate of increase in demand to slow the extension
of low oil prices and the peak driving season in
the summer months providing support. In India,
which recently passed Japan as the third largest oil
importer in the world(18)
even as it also surpassed
China as the world’s fastest growing economy, the
uptrend in economic growth is expected to continue
into H2 15. This positive growth would support
demand as the country continues investments in
infrastructure and refineries.
Competition for market share will
extend excess supply into H2 15
The competition for market share in H2 15 could
widen the excess supply gap as OPEC pushes
crude production levels higher and shale producers
become more efficient in extracting their product.
Whilst the potential boost to supply from shale
could be short-lived, based on reports that indicate
conventional oil fields depreciates by 2%-5% (life
can average 100 years) following the first year
of production, compared with shale fields could
depreciate up to 70% YoY (life can average 3-30
years). The development of new fracking methods
which essentially extend the well life means this
is another layer of the fabric expected to smother
shale output fraying away. At the very least, shale
(18) In June 2015
supply boost should continue into H1 17 and
possibly beyond if mergers & acquisitions come
back on the table. Earlier M&A expectations largely
failed to pan out because most companies were
valued using oil prices above $90/bbl based on
the higher oil prices. With the expected regime of
prolonged depression in oil prices, it is logical to
expect valuations to compress in tandem, allowing
M&A plans to resume possibly as early as H1 16.
This should in turn fuel the competition for market
share, drive the exploitation of scale and ultimately
keep oil supply flowing. The weather forecast adds
to the gloom. In H1 15, in addition to higher car
sales, increased demand was aided by the longer
and colder-than-expected winter season. Given the
shorter winter season in H2 15 relative to H1 15,
demand could be even weaker and further weigh
negatively on prices. Accordingly, we expect oil
prices to resume declines in H2 15 possibly back to
the January lows of $40-$45/bbl.
SOFT COMMODITIES POST
FLEDGLING RESISTANCE ON
NARROWER GLUTS
The decline in commodity prices that began four
years ago continued into Q1 2015, however,
prices rallied through the second quarter with
both the Jefferies CRB and S&P GCSI indices
slightly up at 1.7% and 2.8% respectively in the
first half of 2015(-27.2% and -34.3% YoY). Upon
closer examination, the uptick appears driven by
recovering soft commodity and energy prices, with
the SPGCSI Agriculture and Energy sub-indices
up 1.3% and 11.7% respectively, in the first half
of 2015. Generally speaking, prices remained at
relative lows, driven by a persistent supply glut
cutting across most commodities, and exacerbated
by relatively weaker global demand. On the whole
grain prices have been the most affected by the
supply overhang. Wheat output has exceeded
consumption again in H1 15, further weakening its
price, while falling Barley output has helped it find
some support. Sugar and Crude Palm Oil (CPO)
prices have also shown resilience in the first half of
the year and look promising for the remainder of it.
REVIEW OF GLOBAL ECONOMIC MARKETS