1. COPYRIGHT: No part of this document may be reproduced without the explicit written permission of QNBFS Page 1 of 6
Daily Technical Trader – Qatar
Monday, 17 November 2014
Stocks Covered Today Ticker Price Direction Tgt.
IQCD
196.70
Up
200.00
KCBK
22.20
Flat
22.38
QSE Index Price % Ch. Vol. (mn)
Last
13,744.80
0.1
7.5
Resistance/Support (Daily) Levels 1st 2nd 3rd
Resistance
13,800
14,000
14,350
Support
13,700
13,660
13,500
QSE Index Commentary
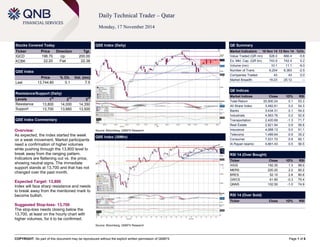
Overview:
As expected, the index started the week on a weak movement. Market participants need a confirmation of higher volumes while pushing through the 13,800 level to break away from the ranging pattern. Indicators are flattening out vs. the price, showing neutral signs. The immediate support stands at 13,700 and that has not changed over the past month.
Expected Target: 13,800
Index will face sharp resistance and needs to break away from the mentioned mark to become bullish.
Suggested Stop-loss: 13,700
The stop-loss needs closing below the 13,700, at least on the hourly chart with higher volumes, for it to be confirmed.
QSE Index (Daily)
Source: Bloomberg, QNBFS Research
QE Summary Market Indicators 16 Nov 14 13 Nov 14 %Ch.
Value Traded (QR mn)
628.0
666.4
-5.8
Ex. Mkt. Cap. (QR bn)
743.9
742.4
0.2
Volume (mn)
10.1
11.1
-9.0
Number of Trans.
6,204
6,363
-2.5
Companies Traded
43
43
0.0
Market Breadth
16:23
25:12
–
QE Indices Market Indices Close 1D% RSI
Total Return
20,500.24
0.1
53.3
All Share Index
3,482.61
0.2
54.3
Banks
3,434.31
0.1
54.0
Industrials
4,563.76
0.2
52.9
Transportation
2,420.69
-1.3
71.7
Real Estate
2,821.94
0.9
56.8
Insurance
4,068.13
0.0
51.1
Telecoms
1,489.64
-0.9
35.2
Consumer
7,531.72
0.9
60.1
Al Rayan Islamic
4,661.43
0.5
56.5
RSI 14 (Over Bought) Ticker Close 1D% RSI
IHGS
192.30
1.3
99.0
MERS
220.20
2.2
82.2
BRES
52.10
2.8
80.6
GWCS
61.80
-0.3
75.4
QNNS
102.50
-1.0
74.9
RSI 14 (Over Sold) Ticker Close 1D% RSI
QSE Index (30Min)
Source: Bloomberg, QNBFS Research
2. COPYRIGHT: No part of this document may be reproduced without the explicit written permission of QNBFS Page 2 of 6
IQCD Price % Ch. Volume
Last
196.70
1.03
96,248
Resistance/Support Levels (QR) 1st 2nd 3rd
Resistance
198.00
200.00
202.00
Support
194.50
190.00
187.50
Commentary
Overview:
IQCD is playing along its resistance of QR198.00. The name tried to breach the mentioned level more than 3 times over the past 3 months. Price is looking bullish; the MACD is above the zero line, the RSI is going in tandem with the price, and the drop in volume coincides with the price decline that took place over the past few sessions.
Expected Target: QR200.00 – QR202.00
The prerequisite to reach the target price is a breakout from the QR198.00, preferably a close on the daily or at least on the hourly above that price.
Suggested Stop-loss: QR194.50
The price may retreat possibly on profit booking; but a dip below the QR194.50 is going to be an indication for a decline that may extend to the next support of QR190.00.
IQCD (Daily)
Source: Bloomberg, QNBFS Research IQCD (Hourly)
Source: Bloomberg, QNBFS Research
3. COPYRIGHT: No part of this document may be reproduced without the explicit written permission of QNBFS Page 3 of 6
KCBK Price % Ch. Volume
Last
22.20
0.82
51,513
Resistance/Support Levels (QR) 1st 2nd 3rd
Resistance
22.25
22.38
22.65
Support
22.00
21.85
21.70
Commentary
Overview:
Over the medium term, the bank made a symmetrical triangle, and is trading inside of that price formation since last April. With the name stabilizing above the QR22.00, the level is becoming stronger and the price is bouncing off the lower support level of the triangle. The RSI and MACD are showing more bullish signs on the daily and the hourly time frames. Price is challenging the moving averages on the daily, and is already above the 50SMA and 100SMA on the hourly chart. That said, the name should maintain its positive behavior above the QR22.00 to meet the projected target.
Expected Target: QR22.38 – QR22.55
A break above the QR22.25 is expected to bring more participants into play. This should increase the probability of reaching the first target mentioned above.
Suggested Stop-loss: QR22.00
A breach below the mentioned may drag the price to the lower boundaries of the triangle, specifically QR21.80 – QR21.75 price levels.
KCBK (Daily)
Source: Bloomberg, QNBFS Research KCBK (Hourly)
Source: Bloomberg, QNBFS Research
5. COPYRIGHT: No part of this document may be reproduced without the explicit written permission of QNBFS Page 5 of 6
Definitions:
Candlestick: A chart that displays the high, low, opening and closing prices for an asset for a single period. The body of the candle is the wide part that shows whether the closing price was higher or lower than the opening price. The candlestick's shadows show the day's high and lows and how they compare to the open and close. The shape of the candle will vary upon the positions of the period's high, low, opening and closing prices.
Support: Is an area where an asset price finds it difficult to break through downwards. This may cause price to head higher in the near term as buying pressure may increase.
Resistance: Is an area where an asset price finds it difficult to break through upwards. This may cause price to head lower in the near term as selling pressure may increase.
SMA (Simple Moving Average): (Which is an arithmetic average) calculates the average price of a security over a defined number of periods and thus considered to be a lagging indicator. Moving averages here are using closing prices. SMA serves many purposes; such purposes may by a smoothing tool, an indicative price direction, and potential support/resistance levels.
Market Breadth: Is the number of advanced listed companies vs. the number of the declined ones in a particular exchange.
MACD (Moving Average Convergence/Divergence): is a trading indicator which shows changes in the strength, direction, momentum, and duration of a trend in a stock's price through a collection of three time series calculated from historical price data, using the closing price in our charts
RSI (Relative Strength Index): A technical momentum indicator that compares asset’s price gains to losses for a predetermined number of periods (we use 14 periods, unless specified otherwise). It attempts to point out how an asset is, in relative terms, is in an overbought/oversold conditions. The standard use of the indicator is 30 and below for an oversold asset while 70 and above is considered to be overbought.
Formation: Is a graphical presentation of an asset’s price activities over a certain period of time. The specific formation differs with their shapes and purposes. They can be used to identify potential trends, reversal of trends, price targets, entry and exit points, etc…
Fibonacci Retracements: Are horizontal lines that indicated expected areas of support/resistance for an asset based on a predetermined price movement. These levels are usually the Fibonacci ratios of 23.6%, 38.2%, 50%, 61.8% and 100% from that particular movement.
Fibonacci Pivot and Intra-day Support/Resistance: a Pivot Point sets the general attitude for price action as a move above/below the pivot point indicates bullishness/bearishness to the move. The Pivot Point calculates the prior period's high, low and close for an asset to formulate expected future support/resistance levels (last day data is used here.) From the base Pivot Point, Fibonacci multiples of the high-low differential are added to form resistance levels and subtracted to form support levels.
6. COPYRIGHT: No part of this document may be reproduced without the explicit written permission of QNBFS Page 6 of 6
Contacts
Saugata Sarkar Abdullah Amin, CFA Shahan Keushgerian
Head of Research Senior Research Analyst Senior Research Analyst
Tel: (+974) 4476 6534 Tel: (+974) 4476 6569 Tel: (+974) 4476 6509
saugata.sarkar@qnbfs.com.qa abdullah.amin@qnbfs.com.qa shahan.keushgerian@qnbfs.com.qa
Sahbi Kasraoui Ahmed Al-Khoudary QNB Financial Services SPC
Manager – HNWI Head of Sales Trading – Institutional Contact Center: (+974) 4476 6666
Tel: (+974) 4476 6544 Tel: (+974) 4476 6548 PO Box 24025
sahbi.alkasraoui@qnbfs.com.qa ahmed.alkhoudary@qnbfs.com.qa Doha, Qatar
Disclaimer and Copyright Notice: This publication has been prepared by QNB Financial Services SPC (“QNBFS”) a wholly-owned subsidiary of QNB SAQ (“QNB”). QNBFS is regulated by the Qatar Financial Markets Authority and the Qatar Exchange QNB SAQ is regulated by the Qatar Central Bank. This publication expresses the views and opinions of QNBFS at a given time only. It is not an offer, promotion or recommendation to buy or sell securities or other investments, nor is it intended to constitute legal, tax, accounting, or financial advice. QNBFS accepts no liability whatsoever for any direct or indirect losses arising from use of this report. Any investment decision should depend on the individual circumstances of the investor and be based on specifically engaged investment advice. We therefore strongly advise potential investors to seek independent professional advice before making any investment decision. Although the information in this report has been obtained from sources that QNBFS believes to be reliable, we have not independently verified such information and it may not be accurate or complete. QNBFS does not make any representations or warranties as to the accuracy and completeness of the information it may contain, and declines any liability in that respect. For reports dealing with Technical Analysis, expressed opinions and/or recommendations may be different or contrary to the opinions/recommendations of QNBFS Fundamental Research as a result of depending solely on the historical technical data (price and volume). QNBFS reserves the right to amend the views and opinions expressed in this publication at any time. It may also express viewpoints or make investment decisions that differ significantly from, or even contradict, the views and opinions included in this report. This report may not be reproduced in whole or in part without permission from QNBFS.