Dehradun Call Girls Service {8854095900} ❤️VVIP ROCKY Call Girl in Dehradun U...
Stratificazione rischio post ima icd2015
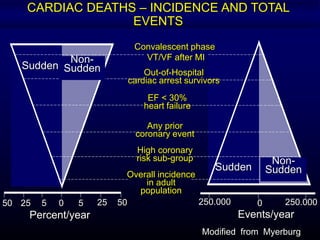
1. Out-of-Hospital
cardiac arrest survivors
EF < 30%
heart failure
Any prior
coronary event
High coronary
risk sub-group
Overall incidence
in adult
population
Convalescent phase
VT/VF after MI
Sudden
Non-
Sudden
Sudden
Non-
Sudden
50 25 5 0 5 25 50
Percent/year
0250.000 250.000
Events/year
CARDIAC DEATHS – INCIDENCE AND TOTAL
EVENTS
Modified from Myerburg
2.
3. ANAMNESI
PATOLOGICA
REMOTA
Precedente ischemia coronarica o IMA o
ICTUS, claudicatio intermittens,
ipercolesterolemia, ipertrigliceridemia,
ipertensione arteriosa; valvulopatia aortica;
malattie della coagulazione.
Disordini endocrini, Cushing, feocromocitoma,
ipo o ipertiroidismo, diabete e gotta; Fenomeno
di Raynaud.
From Netter’s Cardiology, Icon Learning Systems (mod)
4. ANAMNESI
FISIOLOGICA
Età, sesso, stress , obesità, sedentarietà,
alimentazione ricca di grassi animali.
Abitudini: fumo di sigaretta, abuso di
cocaina, uso di contraccettivi orali.
From Netter’s Cardiology, Icon Learning Systems (mod)
5.
6.
7. • LVEF is far to be an ideal risk-stratification test on
which to base prophylactic ICD therapy
• Multiple factors interact with EF to influence mortality
of patients with similar degrees of left ventricular
dysfunction. Thus, we need combinations of tests
based on individual characteristics if we are to use
ICD therapy most efficiently for primary prevention of
sudden death
AE Buxton Circulation 2005; 111: 2537
Ejection Fraction for risk
stratification
8. The evidence is accumulating that the occurrence of
an abrupt ventricular arrhythmia is a multifactorial
process …..
We are most likely dealing with a probabilistic event in
which each of the currently measured risk factors
identifies only a small fraction of the multifactorial risk
process…
At present is probably better to predict coronary
patients for both sudden and non sudden cardiac
death and simply assume that SCD accounts for
approximately 50% of all cardiac deaths
AJ Moss JACC 2003, 42: 659
Is it still valuable to look for “specific”
sudden death predictors?
9. Functional contractile
surrogates
Measures of myocardial conduction disorders
- Signal averaged ECG
- Electrophysiologic Study
Measures of dispersion of repolarization
- QT dispersion
- T-wave alternans
Measures of autonomic imbalance
- Resting Heart Rate
- Heart Rate Variability
- Baroreflex Sensitivity
Measures of electrical instability
- VPCs
- NSVT
Electrophysiologic
surrogates
NYHA CLASS
Left Ventricular Ejection Fraction
Left Ventricular Volume
Peak Oxygen Consumption
Brain Natriuretic Peptide
Conventional Risk Stratifiers for SD
10. Dispensed ACE Inhibitors or ARB Prescriptions Dispensed -Adrenoreceptor Antagonists
Low-Risk
Average-Risk
High-Risk
Risk-Treatment Mismatch in the
Heart Failure
Lee DS et al JAMA. 2005;294:1240-1247
11. 24 31 37 44
54
63
84
105
132
154
180
208
250
280
2,5 4 6 8 10 14 18 27 31 38 44
56 60
22
0
50
100
150
200
250 Annual ICD implants
per million inhabitants
Europe
USA
Updated from S. Nisam
The Gap in ICDs
12. Acute Exacerbations May Contribute to the Progression
of the Disease
Time
Ventricularfunction
Acute event
With each event,
hemodynamic alterations
and myocardial damage
contribute to progressive
ventricular dysfunction
From Gheorghiade . Am J Cardiol 2005 (modified)
Acute Exacerbations may Contribute to
the Progression of the Disease
Time
Ventricularfunction
Acuteevent
With each event,
hemodynamic alterations
and myocardial damage
contribute to progressive
ventricular dysfunction
From Gheorghiade . Am J Cardiol 2005 (modified)
13. • In the first years after MI the benefit
of ICD is dominating and with
progression of HF-disease the benefit
of CRT-D becomes more dominant.
•After > 15 years, HF progression
shows an increasing event rate for
ICD and CRT-D population which can
be less and less impacted by device
therapy.
< 3 years 3-8 years 8-15 years >15 years
MADIT TRIALS – Long Term Follow up data
HF duration and device benefit
Barsheshet A et al,Eur Heart J. 2011 Jul;32(13):1614-21.
14. Magnitude of sympathoexcitation predicts mortality in heart failure.
Cohn et al., NEJM 1984;311:819.
Probabilityofsurvival
Elapsed time in months
0 10 20 30 40 50 60
0
0.2
0.4
0.6
0.8
1.0
Plasma
norepinephrine
200 pg/ml
400 pg/ml
700 pg/ml
1000 pg/ml
1200 pg/ml
15. Distribution of QTc values among patients and
controls
Schwartz PJ, Wolf S. Circulation 1978;57:1074
18. 21 in-hospital CA in 216 pts admitted
for evaluation for Txt
% Mortality
Severe Bradycardia
III AVB, AV dissociation
VT/VF
M Luu et al Circulation 1989
VT/VF
Bradyarrhythmia
% Mortality
P Faggiano et al, Am J Cardiol 2001
48 in-hospital CA
Sudden is always Arrhythmic?
24. Relative Contribution of HR and
HRV to Prognosis in HF
SDNN < 15 ms
(n = 65)
SDNN > 15 ms
(n = 198)
Log-rank 8.6
P = 0.003
Time (months)
Survival
MT La Rovere et al, G Ital Cardiol 2008
25. Short-Term HRV Strongly Predicts Sudden Cardiac Death in
Chronic Heart Failure Patients
MT La Rovere et al, Circulation 2003; 107: 565-70
202 consecutive CHF patiens (age 52±9 yrs, NYHA 2.3±0.7, LVEF 24±7%)
Multivariate Prognostic Model for SCD
RR (95%CI) p
LFP (< 13ms2) 3.7 (1.5-9.3) 0.005
LVEDD (>77mm) 2.6 (1.0-6.3) 0.042
26. Survival Curves by HRV
3717 post-MI pts with EF < 35% - > 15%
ALIVE Study
HRV > 20 U
HRV < 20 U
PercentSurviving
Time Since Randomization in Days
70
80
100
90
0 30 60 90 180 270 360
PJ Schwartz et al, 2004
27. Age (>60 yrs) 1.25 - 0.8 -
Aetiology (CAD) 2.5 2.2 4.4 4.1
NYHA cl (III-IV) 2.0 - 1.4 -
LVEF (<30%) 2.2 -
Cardiot ratio (60%) 2.5 2.5 2.5 -
VT on Holter (yes) 1.7 - 1.6 -
mean RR 1.3 - 1.2 -
SDNN (<67 ms) 2.7 2.5 2.1 -
Day LF p (<3.3 ln) 2.2 - 3.0 2.8
Night LF p (<3.6 ln) 2.3 - 2.2 -
Day HF p (< 2.7 ln) 1.6 - 1.6 -
Univariate
analysis
Multivariate
analysis
Univariate
analysis
Multivariate
analysis
Sudden DeathAll-cause Mortality
Depressed Low Frequency Power of HRV as
an Independent Predictor of Sudden Death in
CHF
M Galinier et al, Eur Heart J 2000; 21:475
28. HR and HRV Profile
in Patients with HF
C Fantoni et al, JACC 2005; 46: 1875-82
29. LFP >11 ms2 , PVCs < 83/h (n=150)
Log Rank = 18.6
p=0.001
LFP 11 ms2 , PVCs < 83/h (n=38)
LFP >11 ms2 , PVCs 83/h (n=41)
LFP 11 ms2 , PVCs 83/h (n=13)
MT La Rovere et al, Circulation 2003; 107: 565-70
The combination of LFP > 11 ms2
and PVCs < 83/h identifyes a
population with a 3-year mortality
risk of arrhythmic death = < 3%
For all the other combinations
the cumulative 3-year
arrhythmic mortality risk is =
23%
HRV and Arrhythmic Death in HF
30. 172830Total
047Deceased
172423Alive
>105 ms70-105 ms< 70ms
HRV (SDNN)
172830Total
029Deceased
172621Alive
>6 ms/mmHg3-6 ms/mmHg< 3 ms/mmHg
BRS
ANS
Medical
Therapy
Decisional process
LVEF < 30
MT La Rovere et al, Heart Rhythm 2005
Clinical Value of a Preserved Autonomic
Balance in Pts with MADIT-II characteristics
31. HRVmsecNightHR
PatientActivity
(minutes/day)
Days Relative to Hospital Admission
-80 -60 -40 -20 0 20
60
70
80
-80 -60 -40 -20 0 20140
160
180
200
220
-80 -60 -40 -20 0 2072
74
76
78
80
Continuous HRV Before Hospitalization
Adamson PB et al Circulation 2004;110:2389-
34. RL Baker et al, J Electrocardiol 2005; 38:64
355 consecutive patients with LVEF < 40% enrolled
between 1988 and 1999
Pateints with history of syncope, sustained VT or
VF not included
PVCs/h 90 ±
215
NSVT 31%
Age 56 ± 17 years
LVEF 31 ± 9%
Prognostic Value of Ambulatory ECG Monitoring in Patients
with Dilated Cardiomyopathy
NO TVNS
TVNS
35. R Berger et al Circulation 2002; 105:2392
337 patients
LVEF < 35%
3-yr SD = 9.7%
Brain Natriuretic Peptide and Sudden Death
36. MADIT II Patients
QRS Duration < 120 ms (63%) QRS Duration > 120 ms (37%)
SAECG – (31%) SAECG + (32%)
MADIT II: Relation between QRS Duration, SAECG
and Mortality
Mortality = 33%
Mortality = 20%Mortality = 7%
37. SH Hohnloser et al, Lancet 2003
Primary end-point
sudden cardiac death/
cardiac arrest
Secondary end-point
sudden cardiac death/
cardiac arrest
sustained VT
Negative
Not Negative
Negative
Not
Negative
P=0.010
P=0.023
TWA in MADIT-II like Patients
38. Bigger JT, et al. Heart Rhythm 2005
66 %
34 %
Paired Results No Endpoint
(%)
TWA normal, EF 31% to 40% 55 .0
TWA normal, EF 30% 134 3.5
TWA abnormal, EF 31% to
40%
89 11.8
TWA abnormal, EF 30% 271 16.1TWA normal
TWA abnormal
TWA and LVEF: Death and Sustained Ventricular
Arrhythmias in Patients with LV Dysfunction
549 pts with LVEF < 40%
(74% < 30%)
NYHA I-III, sinus rhythm
End-point: death + nonfatal SVT
39.
40. Parameter RR (95% C.I.)
TO + TS 6.87 (3.06 –
15.45)
BRS + SDNN 7.68 (3.61 –
16.32) Ghuran et al., 2001
HRT in ATRAMI
41. Ghuran et al., 2001
TS > 2.5 ms/RRI
TS £ 2.5 ms/RRI
HRT in ATRAMI
42. Conclusion
TS is a significant predictor of cardiac
mortality post myocardial infarction; TO
was of borderline significance.
The combination of TO and TS
significantly predicted cardiac mortality
post myocardial infarction.
Like BRS and 24-hour HRV, HRT is
dependent on the prevailing autonomic
tone.
43. The combination of heart rate turbulence and
deceleration capacity identifies a high risk
group among post-MI patients with LVEF >
30% equivalent in size and mortality risk to
patients with LVEF ≤ 30%.
44. I Cygankiewicz et al, Am J Cardiol 2006; 98: 1635-40
Heart Rate Turbulence and
Severity of Heart Failure
45. MT La Rovere et al, AHA 2005
200 consecutive CHF patiens (age 54± 9 yrs, NYHA cl II-III, LVEF 24± 6%)
HRT computable in 173 patients (83%)
5-year follow-up: 73 events (cardiac death including urgent heart Txt)
TO TS
P=.0002 P=.0003
Cox Proportional Hazard Analysis
TS significantly related to cardiac death
after adjustment for NYHA cl, CI, SAP,
pVO2 (p.007)
Prognostic Value of HRT in
Heart Failure
49. 49
Circ Arrhythm Electrophysiol. 2014 Dec;7(6):1101-8
Multiple autonomic and repolarization investigation of
sudden cardiac death in dilated cardiomyopathy and controls.
Pezawas T et al
Noninvasive testing and left ventricular ejection fraction
could not reliably identify patients with dilated
cardiomyopathy at risk of fatal ventricular tachyarrhythmias.
Therefore, the strategy to confine prophylactic implantable
cardioverter-defibrillator implantation to patients with dilated
cardiomyopathy and severely reduced LV function should be
reconsidered.
.
50. Onishi T, et al. Circ J 2010;74:709-714
Kaplan-Meier curves for all-cause
mortality and major cardiovascular
events in the cardiac rehabilitation
group and control group.
Major adsverse cardiovascular events combined
with cardiovascular death, acute coronary
syndrome, refractory ischemia requiring
percutaneous coronary intervention or coronary
artery bypass grafiting, congestive heart failure,
and stroke.
52. Kaplan-Meier curves of all event free survival
Trained patients (broken line); untrained controls (solid line) during follow-up.
+ indicates censored cases.
Belardinelli R, et al. Circulation 1999;99:1173-1182
53. Kaplan-Meier survival curves of cardiac death
Belardinelli R, et al. Circulation 1999;99:1173-1182
Trained group (broken line); untrained control group (solid line) during follow-up.
+ indicates censored cases.
54. Exercise training (n=24) Controls (n=27)
Patients with LVEF 40%
100
80
60
40
20
0
15 30 45 60
months
RR 8.63 p = 0.04
%survival
Exercise Training and
Survival Post-MI
Specchia et al, Circulation 1996
55. Ranpuria R, et al. Nephrol Dial Transplant 2008;23:444-
449
Probability of Cardiac Arrest in the CKD Population
as Compared to the non-CKD Population
56. Cumulative Probability of Cardiac Arrest
Amongst the Different Populations
Ranpuria R, et al. Nephrol Dial Transplant 2008;23:444-
449
57. HF Patients Outcome in SOLVD trials based on
LVEF (a) and Serum Creatinine Level (b)
Kirkwood FA, Zannad F. Am Heart J 1998;135:S204-S
100
80
60
40
20
0 1 2 3 4 5
(b) Serum cr >1,5 mg/dl
(a) LVEF <20%
%
Survival
Years of follow up
0
58. Renal Function and Survival in HF Patients
Relationship Between LVEF- NYHA f.Cl. and GFRc
Hillege HL et Al. Circulation 2000; 102 (2) 203
67. Heart rate is a predictor of CV death
and/or hospitalizations for HF
Böhm M, et al. Lancet. 2010;376:886-894.
50
40
30
20
10
0
0 6 12 18 24 30
Months
≥87 bpm
80 to <87 bpm
75 to <80 bpm
72 to <75 bpm
70 to <72 bpm
P<0.0001
Patients with primary composite end point in the placebo group (%)
Risk increases by 3% per 1 bpm increase, and by 16% per 5 bpm increase
68. %surviving
0 2.5 5 7.5 10
70
80
90
100
years
(n=7)
(n=60)
Training, BRS and Mortality
Not trained + trained, BRS < 3 ms/mmHg after 1 month training
Trained, BRS 3 ms/mmHg after 1 month training
69. Survival Curves for Freedom from
Cardiovascular Death
1 2 3 4 5 6
0.1
0.2
0.3
0.4
0.5
0.6
0.7
0.8
0.9
1.0
Cu
mul
ativ
e
sur
viv
al
Follow-up (years)
BRS < 3 ms/mmHg
BRS > 3 ms/mmHg
p < 0.0001
0
70. Transthoracic ECG and arterial pressure from dog
after cage rest (top panels) and after 6 weeks of
exercise training
Hull SS Jr., et al. Circulation 1995;89:548-552
71. Percent change observed after exercise training in baroreflex
sensitivity (BRS), heart rate variability (HRV, standard deviation of the
mean RR intervals), repetitive extrasystole threshold (RET), and
incidence of ventricular fibrillation (VF) during the exercise and
ischemia test in the seven dogs
Hull SS Jr., et al. Circulation 1995;89:548-552
BR
S
HRV RET INCIDENC
E of VF
EXERCISE TRAINING AUTONOMIC
MARKERS AND CARDIAC ELECTRICAL
STABILITY
-
120
-80
-40
0
40
80
120
%CHANGEFROMCONTROL