The decoupling of gdp and steel demand cyclical or structural (Author: Cheol-Ho Chung)

In the 2000s, global steel demand growth consistently surpassed global GDP growth. The dip in global steel demand after 2012 can be mostly explained by the slowdown in global investment and exports. China shifted its growth strategy from investment and exports to consumption as President Xi Jinping took power in November 2012. ∙ The decoupling of GDP and steel demand will last for the time being on several aspects: global investment and exports, raw materials prices forecast, mega trend (aging populations, the sharing economy and the Fourth Industrial Revolution), and major forecast institutions’ prospects. Just as the decoupling of global GDP and steel demand persisted until China emerged as a new growth engine for steel demand after the early 2000s, there is a possibility that the decoupling will repeat. The global steel industry should prepare for this.

Recommended
Recommended
More Related Content
What's hot
What's hot (20)
Similar to The decoupling of gdp and steel demand cyclical or structural (Author: Cheol-Ho Chung)
Similar to The decoupling of gdp and steel demand cyclical or structural (Author: Cheol-Ho Chung) (20)
More from POSCO Research Institute
More from POSCO Research Institute (19)
Recently uploaded
Recently uploaded (20)
The decoupling of gdp and steel demand cyclical or structural (Author: Cheol-Ho Chung)
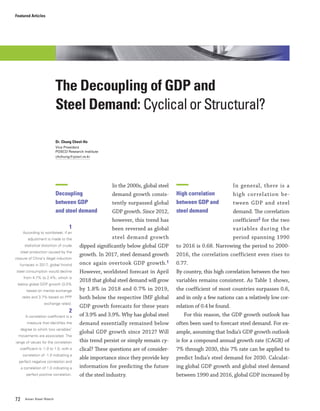
- 1. Featured Articles 72 Asian Steel Watch In the 2000s, global steel demand growth consis- tently surpassed global GDP growth. Since 2012, however, this trend has been reversed as global steel demand growth dipped significantly below global GDP growth. In 2017, steel demand growth once again overtook GDP growth.1 However, worldsteel forecast in April 2018 that global steel demand will grow by 1.8% in 2018 and 0.7% in 2019, both below the respective IMF global GDP growth forecasts for these years of 3.9% and 3.9%. Why has global steel demand essentially remained below global GDP growth since 2012? Will this trend persist or simply remain cy- clical? These questions are of consider- able importance since they provide key information for predicting the future of the steel industry. In general, there is a high correlation be- tween GDP and steel demand. The correlation coefficient2 for the two variables during the period spanning 1990 to 2016 is 0.68. Narrowing the period to 2000- 2016, the correlation coefficient even rises to 0.77. By country, this high correlation between the two variables remains consistent. As Table 1 shows, the coefficient of most countries surpasses 0.6, and in only a few nations can a relatively low cor- relation of 0.4 be found. For this reason, the GDP growth outlook has often been used to forecast steel demand. For ex- ample, assuming that India’s GDP growth outlook is for a compound annual growth rate (CAGR) of 7% through 2030, this 7% rate can be applied to predict India’s steel demand for 2030. Calculat- ing global GDP growth and global steel demand between 1990 and 2016, global GDP increased by The Decoupling of GDP and Steel Demand: Cyclical or Structural? Dr. Chung Cheol-Ho Vice President POSCO Research Institute chchung@posri.re.kr Decoupling between GDP and steel demand 1 According to worldsteel, if an adjustment is made to the statistical distortion of crude steel production caused by the closure of China’s illegal induction furnaces in 2017, global finishd steel consumption would decline from 4.7% to 2.4%, which is below global GDP growth (3.0% based on market exchange rates and 3.7% based on PPP exchange rates). 2 A correlation coefficient is a measure that identifies the degree to which two variables’ movements are associated. The range of values for the correlation coefficient is -1.0 to 1.0, with a correlation of -1.0 indicating a perfect negative correlation and a correlation of 1.0 indicating a perfect positive correlation. High correlation between GDP and steel demand
- 2. The Decopling of GDP and Steel Demand: Cyclical or Structural? Vol.05 June 2018 73 a CAGR of 2.7% (based on IHS data; 3.6% by the IMF using PPP exchange rates) and global steel demand grew by 3.3%, showing a minimal dis- crepancy between the two.3 This pattern holds true for individual coun- tries like India. From 1990 to 2016, India’s GDP growth and steel demand growth were 6.6% and 6.3%, showing how the figures are similar within a single country. If the decou- pling between GDP growth and steel de- mand contin- ues, predict- ability using correlation coefficient between the two variables will diminish. Therefore, it is necessary to find the causes for the decoupling, if any. Furthermore, identi- fying the causes would be illuminating in its own right. How can the changes in the rela- tionship between the two variables that took place around 2012 be ex- plained? The first approach could be examining the characteristics of GDP and steel demand and the relationships between GDP components and steel demand by period. As GDP covers a broad scope and is greater in scale than steel demand, GDP volatility is funda- Table 1. Country-wise Correlation Coefficient between GDP and Steel Demand Source: IHS, worldsteel Correlation Coefficient Estimates (1990-2016) World World total (0.68) Country Korea (0.88), Mexico (0.87), Brazil (0.84), Japan (0.81), Germany (0.77) Turkey (0.76), Chile (0.74), Italy (0.73), France (0.73), Indonesia (0.71) Taiwan (0.70), India (0.70), Malaysia (0.69), UK (0.68), Thailand (0.66), South Africa (0.61), USA (0.61), Canada (0.60), UAE (0.49), China (0.43), Iran (0.42), Vietnam (0.36), Singapore (0.29), the Philippines (0.25), Egypt (0.24), Saudi Arabia (0.04) Causes of decoupling of global GDP and steel demand 3 To calculate global GDP, each country’s home-currency- denominated GDP should be converted into US dollars. The weight for each country varies depending on whether market exchange rates or purchasing power parity (PPP) exchange rates are used. As developing countries have a lower marketization level than their advanced counterparts, they receive a much higher weight in aggregations that apply PPP exchange rates compared to with market exchange rates. Generally, developing countries have a higher economic growth rate than do advanced countries, so PPP-based global GDP growth is higher than market-based rates. The IMF releases GDP growth both by PPP and market exchange rates, but it usually suggests PPP-basis rates as an official outlook. Using market- based rates, however, the IHS GDP forecast turns out to be lower than the IMF GDP forecast. Figure 1. Global Steel Demand and Global GDP Growth 15 10 5 0 -5 -10 (%) 1990 1993 1996 1999 2002 2005 2008 2011 2014 2017 Global steel demand World GDP Source: IMF, worldsteel
- 3. Featured Articles 74 Asian Steel Watch mentally lower than that of steel demand. As a measure of volatility, the standard deviation of global GDP growth for the period of 1980-2017 was 1.3%, while that of global steel demand was 4.7%. This indicates that the standard deviation of global steel demand growth is 3.7 times higher than that of global GDP growth. In other words, steel demand growth moves in the same direction as GDP growth (high correlation coefficient), but it fluctuates more widely. In that case, which GDP component among consumption, investment, and exports would better explain the fluctuations in steel demand? Comparing the growth rates of global steel demand and GDP components such as consump- tion, investment, and exports (Figures 2 and 3), steel demand growth is much more volatile than is consumption growth, but it shows similar vol- atility with fixed asset investment, and in partic- ular with goods export volume. Therefore, the dip in global steel demand after 2012 can be mostly explained by the slowdown in global investment and exports. China provides a representative example. After overcoming the global financial crisis of 2008 through massive government-led investment, China shifted its growth strategy from investment and exports to consumption as President Xi Jinping took power at the 18th Par- ty Congress in November 2012. China’s manu- facturing-based and export-led growth strategies faced their limitations when the global economy slowed after the financial crisis and excessive in- vestment led to mounting debt and oversupply. With this shift in growth strategy, the shares in GDP of investment and exports plunged while the share of consumption surged (Figure 4). In addition, the contributions of manufacturing and construction decreased, but that of services expanded (Figure 5). These shifts in China, which accounts for about 45% of global steel demand, became a key driver for changes in global steel demand. Simply put, China is the most import- These shifts in China, which accounts for about 45% of global steel demand, became a key driver for changes in global steel demand. Simply put, China is the most important factor for explaining the decoupling between global GDP and global steel demand after 2012.
- 4. The Decopling of GDP and Steel Demand: Cyclical or Structural? Vol.05 June 2018 75 ant factor for explaining the decoupling between global GDP and global steel demand after 2012. However, the question remains of why the de- cline in global steel demand growth in the period 2014-2016 is deeper than that of investment or export volume. One cause could be the plunge in the prices of raw materials, including oil, during this period. A decline in oil or other raw materials prices has a neutral effect on the global economy overall. The positive impact on countries that are net raw materials importers offsets the negative impact on net raw materials exporting countries. But a decline in oil or other raw materials prices has a negative impact on global steel demand, because the plunge of oil and raw materials prices reduces outlays of infrastruture and plants, etc., especially for developing countries. Net raw ma- terials exporting countries are also developing countries which account for a certain proportion of global steel consumption. For this reason, global steel consumption growth falls below glob- al GDP growth. In 2017, developing countries ac- counted for 39.4% of global real GDP, but 74.1% of global steel demand, two times the share of GDP. In a comparison of commodity prices and global steel demand (Figure 6), changes in com- Figure 2. Global Steel Demand, GDP, and Consumption Figure 3. Global Steel Demand, Investment, and Exports Source: World Bank, worldsteel Source: IMF, World Bank, worldsteel 20 15 10 5 0 -5 -10 -15 20 15 10 5 0 -5 -10 -15 (%) (%) 2000 2004 2008 2012 2016 2000 2004 2008 2012 2016 Steel demand Real GDP Final consumption expenditure Steel demand Export volume of goods Fixed asset investment Figure 4. Share of GDP Components in China Figure 5. Share of Value Added by Industry in China Source: UNCTAD Source: UNCTAD 60% 50% 40% 30% 50% 10% 0% 55% 50% 45% 40% 35% 30% (% of GDP) (% of total value added) 1990 19901996 19962002 20022008 20082014 2014 Gross capital formation Private consumption expenditure Exports of goods and services Industry Services
- 5. Featured Articles 76 Asian Steel Watch modity prices well explain the fluctuations in global steel demand. With respect to countries where steel demand plunged after 2012, those that led this decline are mainly developing countries. Table 2 compares steel demand growth by country between the pe- riods of 2000-2012 and 2012-2016. It indicates that China’s steel demand fell the most, followed by Brazil, Saudi Arabia, UAE, Argentina, Indonesia, and Russia. This suggests that developing countries with a high proportion of raw materials exports are prone to a decline in steel demand growth. On the other hand, advanced countries in- cluding the USA, Japan, and Germany only show a minimal decline. In particular, the GDP growth decline in developing countries with a high steel demand decline is relatively smaller than their steel demand decline. Therefore, the significant dip in steel demand among major developing countries, particularly raw materials exporting countries, can be another major cause for the de- coupling. Will this decoupling per- sist or remain cyclical? To state the conclusion first, the decoupling between the global economy and global steel demand is likely to keep the status quo for a considerable time. The causes of the de- coupling after 2012—weak investment, exports and raw material prices—are likely to linger for The decoupling will likely linger Figure 6. Commodity Price Index and Global Steel Demand Note: A commodity price index includes the prices of food, beverages, and industrial raw materials Source: IMF, worldsteel 30 20 10 0 -10 -20 (%) Commodity price index (Non-fuel) Global steel demand 1981 1987 1993 1999 2005 2011 2017
- 6. The Decopling of GDP and Steel Demand: Cyclical or Structural? Vol.05 June 2018 77 several structural reasons. First, investment and exports will likely not to sustain their robust growth momentum of the past as developing countries’ manufactur- ing-based and export-led growth strategies face difficulty due to the weak demand in advanced countries and as trade conflicts between China and the USA will likely be extended. Moreover, advanced countries, which had been implementing extraordinary monetary policies called quantitative easing, have shifted to tight monetary policies through interest rate increases. Therefore, developing countries with increas- ing debts will suffer from mounting economic burdens and instability. Source: IMF, worldsteel Table 2. Country-wise GDP Growth and Steel Demand Growth (CAGR) by Period Real GDP Growth Steel Demand Growth ‘00-’12 (A) ‘12-’16 (B) A—B (%p) ‘00-’12 (C) ‘12-’16 (D) C—D (%p) China 10.2% 7.2% 3.0 14.9% 0.8% 14.1 Brazil 3.6% – 0.9% 4.5 4.4% – 9.0% 13.5 Saudi Arabia 4.1% 3.0% 1.0 10.3% – 0.7% 11.0 UAE 4.2% 4.0% 0.2 12.0% 2.7% 9.3 Argentina 2.9% 0.0% 2.9 4.3% – 3.8% 8.0 Indonesia 5.4% 5.1% 0.3 8.2% 0.3% 7.8 Russia 4.6% – 0.2% 4.8 4.8% – 2.8% 7.6 Thailand 4.5% 2.5% 2.0 8.2% 3.2% 4.9 India 7.2% 7.3% – 0.1 8.4% 3.6% 4.7 Australia 3.1% 2.5% 0.6 0.8% – 2.4% 3.2 Turkey 4.7% 5.7% – 1.1 6.9% 4.6% 2.3 South Korea 4.2% 3.0% 1.2 2.9% 1.4% 1.6 Malaysia 4.7% 5.0% – 0.3 3.1% 3.5% – 0.5 United States 1.7% 2.1% – 0.5 – 1.8% – 1.2% – 0.7 Japan 0.6% 1.2% – 0.5 – 1.4% – 0.7% – 0.7 Mexico 1.8% 2.6% – 0.8 3.3% 5.0% – 1.7 Germany 1.1% 1.5% – 0.4 – 0.3% 1.9% – 2.3
- 7. Featured Articles 78 Asian Steel Watch Oil and other raw materials prices could possi- bly rise temporarily due to the base effect of low prices and geopolitical supply disruptions, but they have a slim likelihood of surging in the long run. For instance, most forecasts predict that the ongoing modest increase in oil prices will become a persistent trend. Furthermore, aging populations and meg- atrends such as the sharing economy and the Fourth Industrial Revolution are also expected to bear negative effects on steel demand in the long term. The aging populations in Korea, China, Japan, the USA, and Western Europe will drive down demand for construction and automobiles, leading to a slowdown in steel demand. In addition, the Fourth Industrial Revolution will also work against steel demand in terms of steel intensity, including through the potential commercialization of autonomous vehicles and its impact on the automotive industry; the re- duced size of shopping malls or offices due to the prospering of e-commerce enterprises such as Amazon; the rise of the sharing economy repre- sented by Airbnb (housing-sharing services) and Uber (ride-sharing services); and the emergence of the circular economy to address environmental concerns. Further analysis should be performed to more fully examine the impact of these factors on steel demand, but their impact will likely to be negative. How large a gap will the decoupling create? IHS Markit’s mid- to long- term global economic outlook predicts that global GDP growth will show a CAGR of 2.9% through 2035. Meanwhile, POSRI’s mid- to long- range out look presented at the Board Meeting of worldsteel in April 2017 and described in Asian Steel Watch Vol. 3 suggests that global steel Global steel demand hovering below global GDP through 2035 Most forecasts predict that the ongoing modest increase in oil prices will become a persistent trend. Furthermore, aging populations and megatrends such as the sharing economy and the Fourth Industrial Revolution are also expected to bear negative effects on steel demand in the long term.
- 8. The Decopling of GDP and Steel Demand: Cyclical or Structural? Vol.05 June 2018 79 demand is expected to grow at a CAGR of 1.1% through 2035. The global GDP will grow almost three times the rate of global steel demand. Accen- ture’s global steel demand outlook is quite similar to POSRI’s. According to Accenture’s global steel demand outlook released at the OECD meeting in September 2017, global steel demand in the base- line forecast is expected to grow by a CAGR of 1.4%. To be sure, it is questionable whether such predic- tions will be perfectly realized, but these forecasts indicate that major institutions believe that the decoupling between global economic growth and global steel demand will persist for a while. Divid- ing the long-term outlook by region, three main characteristics are evident. First, steel demand in Northeast Asia (China, Japan, and Korea) will decline. Second, steel de- mand in the USA and the EU will slow to below a CAGR of 1%. Third, other emerging countries will lead global steel demand. Overall, the decline in steel demand in China, Japan, and Korea, which together accounted for 54% of global steel demand in 2017, seems to be a decisive factor causing a slowdown in global steel demand. Fur- Figure 7. POSRI's Global Steel Demand Forecast Source: POSCO Research Institute Note: 1) Shipbuilding sector includes other transportation, 2) Demand for other sectors is forecast using industrial production index Other Energy Shipbuilding Automobile Construction CAGR 1.2% CAGR 0.9% [‘16-’35] 2015 1,501 2025 1,690 2035 1,857 1.1% 1.0% -0.2% 2.3% 0.3% 1.2% (Mt) Figure 8. Accenture's Global Steel Demand Outlook (2015-2035) Source : Accenture 2500 2000 1500 1000 500 0 ‘88 ‘90 ‘92 ‘94 ‘96 ‘98 ‘00 ‘02 ‘04 ‘06 ‘08 ‘10 ‘12 ‘14 ‘16 ‘18 ‘20 ‘22 ‘24 ‘26 ‘28 ‘30 ‘32 ‘34 Baseline Incremental Radical 1500 2000 1873 1749 (Mt, crude steel equivalent)
- 9. Featured Articles 80 Asian Steel Watch thermore, based on IHS’s global GDP growth projections, the respective GDPs of China, Korea, and Japan are expected to grow by CAGRs of 5.2%, 2.0%, and 0.9%, respectively, through 2035, showing a significant discrepancy with steel de- mand growth. The major cause of the decline in steel demand in China, Korea, and Japan is close- ly related to changing demographic structures. These countries are aging rather rapidly and their working-age populations are declining. Such a demographic shift is directly connected to steel demand for construction, automobiles, and home appliances. With aging populations and saturated economies, the USA and the EU have entered a stage of stagnation in industrialization and ur- banization, two key drivers for steel demand. In other emerging countries, there is consid- erable room for increase in steel demand due to population growth and urbanization and indus- trialization. However, the global working-age population growth will continue to decline and this will put downward pressure on global steel demand in the mid-to-long term. Figure 9. Global GDP and Working-Age Population Source: World Bank, UN 8 7 6 5 4 3 2 1 0 -1 -2 -3 2.5 2.0 1.5 1.0 0.5 0.0 (%)(%) Global working-age population(→) Global GDP(←) 1961 1968 1975 1982 1989 1996 2003 2010 2017 2024 Figure 10. Working-Age Population in China, Japan, and Korea Source: UN 5% 4% 3% 2% 1% 0% -1% -2% 1951 1961 1971 1981 2001 2011 20211991 Japan Korea China Forecast (2018 – 2030) The improvement seems to continue for the time being. However, there are still concerns that the decoupling of global steel demand and global GDP will continue in the long term.
- 10. The Decopling of GDP and Steel Demand: Cyclical or Structural? Vol.05 June 2018 81 Figure 11. Global GDP and Global Steel Demand Figure 12. Global Steel Consumption Per Capita and Steel Intensity of GDP Note: The figure for 2018-2019 is estimated by forecast by worldsteel and World Bank Source: World Bank, worldsteel, IHS Global 350 300 250 200 150 100 50 0 250 200 150 100 50 0 25 20 15 10 5 0 1980 1986 1992 1998 2004 2010 2016 1974 1980 1986 1992 1998 2004 2010 2016 Global real GDP Finished steel consumption per capitaGlobal finished steel demand Steel Intensity of GDP It is difficult to precisely predict how the discrep- ancy will unfold in the future, but past experi- ence can be a good refer- ence. T he global steel industry suffered a prolonged depression in de- mand from the early 1980s to the early 2000s. After the second oil shock, global steel demand stagnated, decoupling from global GDP for a number of years, and both global steel consump- tion per capita and steel intensity of GDP contin- ued to decline. This means that the decoupling of global GDP and steel demand persisted until China emerged as a new growth engine for steel demand after the early 2000s. Steel companies must grasp the prolonged structural changes in the global economy and steel demand in order to prepare for the future. Understanding the paradigm shift is critical for formulating mid- and long-term investment and growth strategies, which will in turn determine future performance and competitiveness. Fortu- nately, as the Chinese steel industry has been tak- ing the lead in restructuring, global overcapacity has been reduced considerably over the last three years and steel market conditions have improved. The improvement seems to continue for the time being. However, there are still concerns that the decoupling of global steel demand and global GDP will continue in the long term. Prepare for a possible repeat of the low growth period (1980=100) (kg per person) (1,000 tonnes/USD billion)