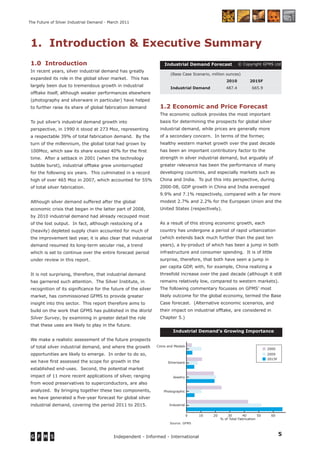
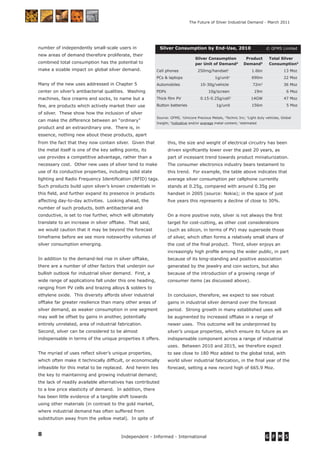
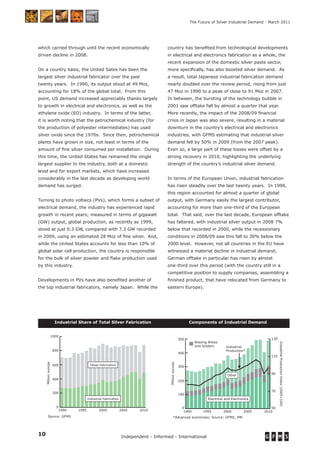
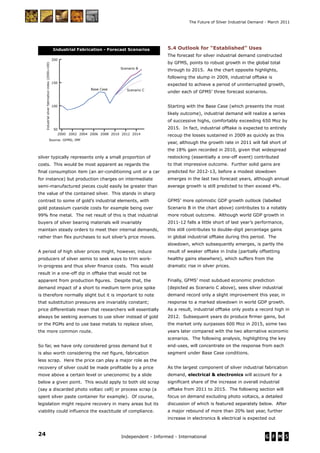
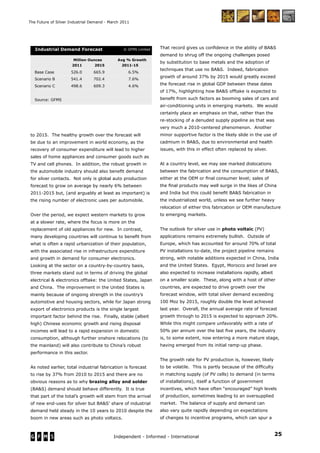
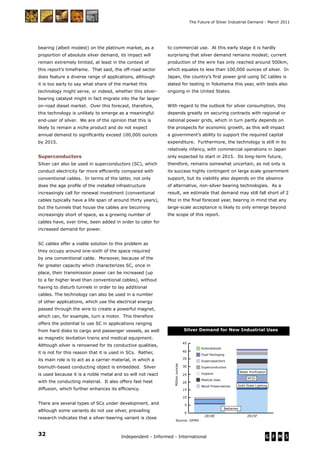
- Industrial demand for silver is forecast to grow significantly over the next five years, increasing from 487 million ounces in 2010 to 666 million ounces in 2015.
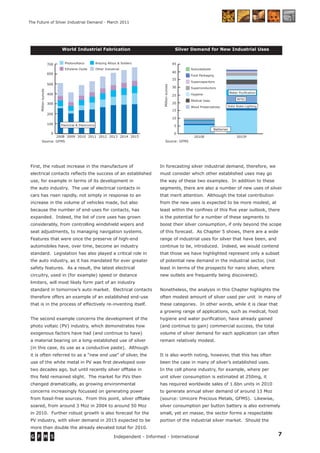
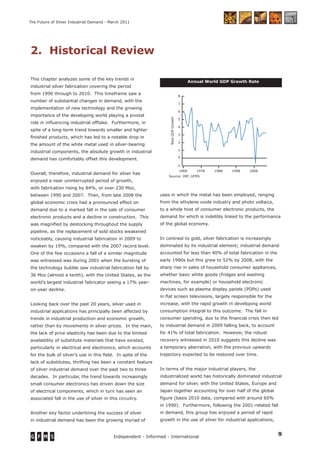
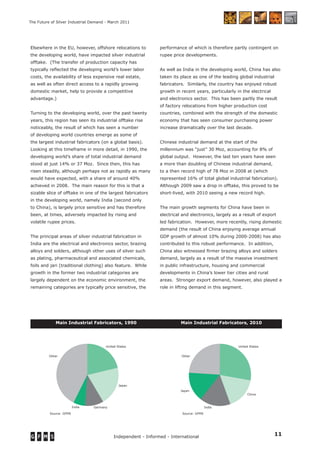
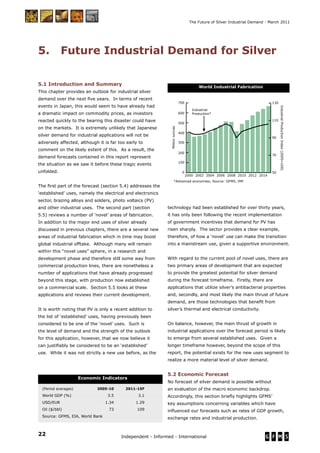
- Strong economic growth in developing countries like China and India has been a major driver of increased industrial silver demand over the past decade.
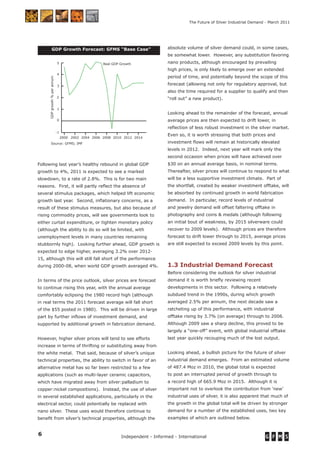
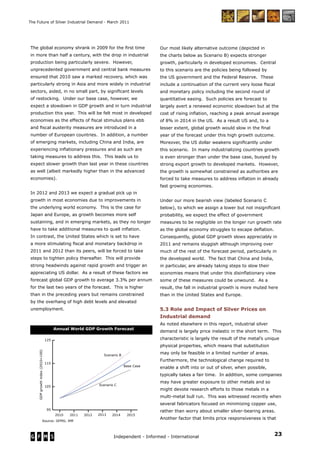
- While global economic growth is expected to slow in 2011, it is forecast to gradually increase over 2012-2015, supporting ongoing growth in industrial silver usage.
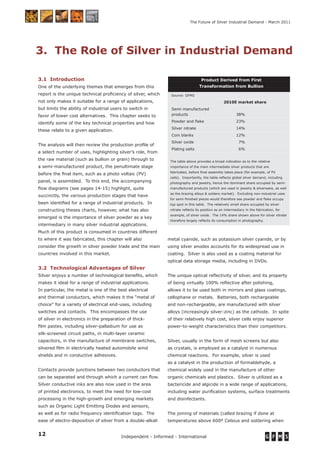
- Higher silver prices are expected to encourage some substitution away from silver in certain industrial applications, but silver's unique properties limit alternatives and substitution will be a long-term process.