China's steel enters peak zone arguments and projections (Young Hun Choi)
•
0 likes•41 views

[Asian Steel Watch] Vol.1(2016.1) China's Steel Enters a “Peak Zone“: Arguments and Projections (Choi, Young-hun)

Recommended
Recommended
More Related Content
What's hot
What's hot (20)
Similar to China's steel enters peak zone arguments and projections (Young Hun Choi)
Similar to China's steel enters peak zone arguments and projections (Young Hun Choi) (20)
More from POSCO Research Institute
More from POSCO Research Institute (16)
Recently uploaded
Recently uploaded (20)
China's steel enters peak zone arguments and projections (Young Hun Choi)
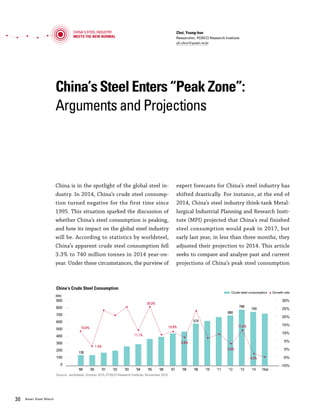
- 1. Vol.01 January 2016 3130 Asian Steel Watch China’s Steel Enters “Peak Zone”: Arguments and Projections Choi, Young-hun Researcher, POSCO Research Institute yh.choi@posri.re.kr China is in the spotlight of the global steel in- dustry. In 2014, China’s crude steel consump- tion turned negative for the first time since 1995. This situation sparked the discussion of whether China’s steel consumption is peaking, and how its impact on the global steel industry will be. According to statistics by worldsteel, China’s apparent crude steel consumption fell 3.3% to 740 million tonnes in 2014 year-on- year. Under these circumstances, the purview of expert forecasts for China’s steel industry has shifted drastically. For instance, at the end of 2014, China’s steel industry think-tank Metal- lurgical Industrial Planning and Research Insti- tute (MPI) projected that China’s real finished steel consumption would peak in 2017, but early last year, in less than three months, they adjusted their projection to 2014. This article seeks to compare and analyze past and current projections of China’s peak steel consumption and their bases, then deduce the direction of China’s steel industry. Previous projections placed China’s peak steel at 0.8-1 billion tonnes between 2020 and 2030 In 2010, the majority of projections placed Chi- na’s crude steel consumption peak at 0.8-1 billion tonnes between 2020 and 2030. Facts presented as bases for this claim included the spread of industrialization and urbanization, the growth potential of the midwestern region, the grow- ing middle class and the resulting increase in du- rable goods consumption, and relatively low per capita steel consumption compared to advanced nations. A Chinese steel consulting firm TNC Steel explained that completion of industrializa- tion coincided with peak crude steel consump- tion in other populous countries. TNC projected that China’s industrialization, which was in a middle phase at the time, would be completed by around 2020. TNC estimated that crude steel consumption would peak around the same time, at approximately 1.02 billion tonnes. Citing that per capita crude steel consumption in the USA (706 kg), Japan (802 kg), and other advanced countries peaked when their urbanization rates exceeded 70%, TNC forecasted that the high growth trend of crude steel consumption would continue in China, which had a relatively low ur- banization rate of around 50%. China Steel Development & Research Institute (CSDRI) projected that the time and size of the steel consumption peak would vary by region due to gaps in development. For the mature market eastern China, CSDRI forecasted that per capita crude steel consumption would peak at 800 kg in 5-10 years and decline gradually thereafter. Cen- tral China’s consumption was projected to peak at 600 kg/capita after 2020, and western China’s consumption at 500 kg/capita no sooner than ten years after central China’s peak. Total crude steel consumption in China was projected to peak at 800 million tonnes around 2020. The United Nations (UN) projected that the number of automobiles owned per 1,000 people Time of projection Peak Consumption Projection Basis MPI 2010 805 Mt in 2020 •Economic development and urbanization progress TNC Steel, China 2010 1020 Mt in 2021 •Continuing industrialization and development •In the USA, Japan, Germany, and other advanced nations, completion of industrialization and peak steel consumption happened simultaneously CRU 2010 Over 1000 Mt in 2020 •Steel consumption by region: East (1,000 kg/capita), Central (700 kg/capita), West (600 kg/capita) Australian National University (ANU) 2010 1000 -1100 Mt in 2024 •Per capita GDP of $15,449 corresponds to 700-800 kg/capita UN 2010 958 Mt in 2030 •Urbanization progress, increasing consumption of durable goods (e.g. automobiles) Previous Forecasts for China’s Peak Crude Steel Consumption China's Steel Industry Meets the New Normal China’s Steel Enters ”Peak Zone”: Arguments and Projections China’s Crude Steel Consumption (Mt) 900 800 700 600 500 400 300 200 100 0 30% 25% 20% 15% 10% 5% 0% -5% -10% ’99 ’00 ’01 ’02 ’03 ’04 ’05 ’06 ’07 ’08 ’09 ’10 ’11 ’12 ’13 ’14 15(e) Source: worldsteel, October 2015, POSCO Research Institute, November 2015 10.8% 136 1.4% 26.0% 11.1% 10.8% 6.8% 2.9% 11.4% -3.3% 766 740 688 574 Crude steel consumption Growth rate Source: Complied from various reports
- 2. Vol.01 January 2016 3130 Asian Steel Watch China’s Steel Enters “Peak Zone”: Arguments and Projections Choi, Young-hun Researcher, POSCO Research Institute yh.choi@posri.re.kr China is in the spotlight of the global steel in- dustry. In 2014, China’s crude steel consump- tion turned negative for the first time since 1995. This situation sparked the discussion of whether China’s steel consumption is peaking, and how its impact on the global steel industry will be. According to statistics by worldsteel, China’s apparent crude steel consumption fell 3.3% to 740 million tonnes in 2014 year-on- year. Under these circumstances, the purview of expert forecasts for China’s steel industry has shifted drastically. For instance, at the end of 2014, China’s steel industry think-tank Metal- lurgical Industrial Planning and Research Insti- tute (MPI) projected that China’s real finished steel consumption would peak in 2017, but early last year, in less than three months, they adjusted their projection to 2014. This article seeks to compare and analyze past and current projections of China’s peak steel consumption and their bases, then deduce the direction of China’s steel industry. Previous projections placed China’s peak steel at 0.8-1 billion tonnes between 2020 and 2030 In 2010, the majority of projections placed Chi- na’s crude steel consumption peak at 0.8-1 billion tonnes between 2020 and 2030. Facts presented as bases for this claim included the spread of industrialization and urbanization, the growth potential of the midwestern region, the grow- ing middle class and the resulting increase in du- rable goods consumption, and relatively low per capita steel consumption compared to advanced nations. A Chinese steel consulting firm TNC Steel explained that completion of industrializa- tion coincided with peak crude steel consump- tion in other populous countries. TNC projected that China’s industrialization, which was in a middle phase at the time, would be completed by around 2020. TNC estimated that crude steel consumption would peak around the same time, at approximately 1.02 billion tonnes. Citing that per capita crude steel consumption in the USA (706 kg), Japan (802 kg), and other advanced countries peaked when their urbanization rates exceeded 70%, TNC forecasted that the high growth trend of crude steel consumption would continue in China, which had a relatively low ur- banization rate of around 50%. China Steel Development Research Institute (CSDRI) projected that the time and size of the steel consumption peak would vary by region due to gaps in development. For the mature market eastern China, CSDRI forecasted that per capita crude steel consumption would peak at 800 kg in 5-10 years and decline gradually thereafter. Cen- tral China’s consumption was projected to peak at 600 kg/capita after 2020, and western China’s consumption at 500 kg/capita no sooner than ten years after central China’s peak. Total crude steel consumption in China was projected to peak at 800 million tonnes around 2020. The United Nations (UN) projected that the number of automobiles owned per 1,000 people Time of projection Peak Consumption Projection Basis MPI 2010 805 Mt in 2020 •Economic development and urbanization progress TNC Steel, China 2010 1020 Mt in 2021 •Continuing industrialization and development •In the USA, Japan, Germany, and other advanced nations, completion of industrialization and peak steel consumption happened simultaneously CRU 2010 Over 1000 Mt in 2020 •Steel consumption by region: East (1,000 kg/capita), Central (700 kg/capita), West (600 kg/capita) Australian National University (ANU) 2010 1000 -1100 Mt in 2024 •Per capita GDP of $15,449 corresponds to 700-800 kg/capita UN 2010 958 Mt in 2030 •Urbanization progress, increasing consumption of durable goods (e.g. automobiles) Previous Forecasts for China’s Peak Crude Steel Consumption China's Steel Industry Meets the New Normal China’s Steel Enters ”Peak Zone”: Arguments and Projections China’s Crude Steel Consumption (Mt) 900 800 700 600 500 400 300 200 100 0 30% 25% 20% 15% 10% 5% 0% -5% -10% ’99 ’00 ’01 ’02 ’03 ’04 ’05 ’06 ’07 ’08 ’09 ’10 ’11 ’12 ’13 ’14 15(e) Source: worldsteel, October 2015, POSCO Research Institute, November 2015 10.8% 136 1.4% 26.0% 11.1% 10.8% 6.8% 2.9% 11.4% -3.3% 766 740 688 574 Crude steel consumption Growth rate Source: Complied from various reports
- 3. Vol.01 January 2016 3332 Asian Steel Watch in China would increase from 24 units in 2005 to 300 units in 2030 and thus posited that crude steel consumption would peak at 960 million tonnes (630 kg/capita) around 2030. Rio Tinto pointed to the fact that the growth of per capita crude steel production continued for a long time after the 500 kg mark in the USA (30 years), Japan (44 years), and South Korea (27 years), and saw that the growth potential of China’s per capita crude steel production, which surpassed 500 kg only in 2011, remained high. Why the majority opinion has adjusted China’s peak steel to 2013-2014 1 Five years later, how have the projec- tions changed? Looking at forecasts from early 2015 by institution, the ma- jority opinion places China’s peak steel in 2013-2014, while some do around 2018 or 2025. The opinion that China’s steel con- sumption has already peaked is based on a real estate market slowdown following government initiatives to deflate a bubble, slowing economic growth, and the growing proportion of the ter- tiary sector in the economy. CISA projected that China’s crude steel production will gradually decline from its peak of 823 million tonnes in 2014 to 795 million tonnes in 2017. Goldman Sachs posited a dif- ferent outlook, projecting China’s steel produc- tion in 2015 to decrease 1.9% to 807 million tonnes year-on-year, then rebound to reach 819 million tonnes in 2016, 827 million tonnes in 2017, and 831 million tonnes in 2018. Global mining companies, including Rio Tinto and BHPB, shared a more optimistic view, forecast- ing that crude steel production will continue to grow until 2025 at an average annual rate of 2.5%, reaching over 1 billion tonnes. What has caused the early peak of steel consumption in China? Comparing the projections for China’s peak steel from 2010 and 2015, the arrival of the peak steel has moved up at least five to six years. Why did this happen? To begin with the conclusion, primary reasons for the early peak of steel in China are a slump in real estate and construc- The opinion that China’s steel consumption has already peaked is based on a real estate market slowdown following government initiatives to deflate a bubble, slowing economic growth, and the growing proportion of the tertiary sector in the economy. Source: MPI Share of China’s Steel Consumption by Industry 2000 2010 2014 Construction 56% 56% 55% Machinery 15% 18% 19% Automotive 6% 7% 7% Shipbuilding 1% 4% 2% Home Appliance 3% 2% 1% Other 19% 13% 16% 8.3 8.2 8.1 8.0 7.9 7.8 ’13 ’14 ’15 ’16 ’17 8.23 8.15 7.95 Peak in 2014 before a gradual decline 8.4 8.3 8.2 8.1 8.0 7.9 ’13 ’14 ’15 ’16 ’17 8.31 8.23 Decline in 2015 before a rebound ’18 8.07 12.0 11.0 10.0 9.0 8.0 7.0 ’13 ’15 ’17 ’19 ’21 Rise until 2025 at 2.5% annual average rate ’23 ’25 8.44 9.54 10.80 Recent forecasts for China’s peak crude steel production “Already Passed” CISA, POSCO Research Institute, etc. “After 2018” Goldman Sachs, Morgan Stanley, etc. “Around 2025” BHPB, Rio Tinto, etc. (100 Mt) Note: As crude steel demand forecasts are not available in many institutions, crude steel production trends and forecasts have been used. Source: International press Changes of Key Real Estate Indicators 40% 0% -40% ’01 ’03 ’05 ’07 ’09 ’11 ’13 ’15(e) Land area purchased Floor space of real estate started Negative growth rate for two indicators 1 For further details on China’s crude steel consumption forecast by POSCO Research Institute, see the beginning of the next article, “The Impact of China's 'Peak Steel' and Scrap Generation on Steel Raw Material Prices.” China’s Steel Enters ”Peak Zone”: Arguments and ProjectionsChina's Steel Industry Meets the New Normal Changes: 2014 Jan.-Nov. 2015 • Land area purchased (-14% -33.1%) • Floor space of real estate started (-10.7% -18.4%) tion businesses, which account for the highest share of steel consumption, and the diminished elasticity of steel consumption with respect to GDP due to changes in China’s economic struc- ture, such as the expansion of consumption-led growth and tertiary industries. Share of steel consumption by major steel-consuming indus- tries fluctuated slightly from 2000 to 2014: the share of the machinery industry rose 4%p, ’25
- 4. Vol.01 January 2016 3332 Asian Steel Watch in China would increase from 24 units in 2005 to 300 units in 2030 and thus posited that crude steel consumption would peak at 960 million tonnes (630 kg/capita) around 2030. Rio Tinto pointed to the fact that the growth of per capita crude steel production continued for a long time after the 500 kg mark in the USA (30 years), Japan (44 years), and South Korea (27 years), and saw that the growth potential of China’s per capita crude steel production, which surpassed 500 kg only in 2011, remained high. Why the majority opinion has adjusted China’s peak steel to 2013-2014 1 Five years later, how have the projec- tions changed? Looking at forecasts from early 2015 by institution, the ma- jority opinion places China’s peak steel in 2013-2014, while some do around 2018 or 2025. The opinion that China’s steel con- sumption has already peaked is based on a real estate market slowdown following government initiatives to deflate a bubble, slowing economic growth, and the growing proportion of the ter- tiary sector in the economy. CISA projected that China’s crude steel production will gradually decline from its peak of 823 million tonnes in 2014 to 795 million tonnes in 2017. Goldman Sachs posited a dif- ferent outlook, projecting China’s steel produc- tion in 2015 to decrease 1.9% to 807 million tonnes year-on-year, then rebound to reach 819 million tonnes in 2016, 827 million tonnes in 2017, and 831 million tonnes in 2018. Global mining companies, including Rio Tinto and BHPB, shared a more optimistic view, forecast- ing that crude steel production will continue to grow until 2025 at an average annual rate of 2.5%, reaching over 1 billion tonnes. What has caused the early peak of steel consumption in China? Comparing the projections for China’s peak steel from 2010 and 2015, the arrival of the peak steel has moved up at least five to six years. Why did this happen? To begin with the conclusion, primary reasons for the early peak of steel in China are a slump in real estate and construc- The opinion that China’s steel consumption has already peaked is based on a real estate market slowdown following government initiatives to deflate a bubble, slowing economic growth, and the growing proportion of the tertiary sector in the economy. Source: MPI Share of China’s Steel Consumption by Industry 2000 2010 2014 Construction 56% 56% 55% Machinery 15% 18% 19% Automotive 6% 7% 7% Shipbuilding 1% 4% 2% Home Appliance 3% 2% 1% Other 19% 13% 16% 8.3 8.2 8.1 8.0 7.9 7.8 ’13 ’14 ’15 ’16 ’17 8.23 8.15 7.95 Peak in 2014 before a gradual decline 8.4 8.3 8.2 8.1 8.0 7.9 ’13 ’14 ’15 ’16 ’17 8.31 8.23 Decline in 2015 before a rebound ’18 8.07 12.0 11.0 10.0 9.0 8.0 7.0 ’13 ’15 ’17 ’19 ’21 Rise until 2025 at 2.5% annual average rate ’23 ’25 8.44 9.54 10.80 Recent forecasts for China’s peak crude steel production “Already Passed” CISA, POSCO Research Institute, etc. “After 2018” Goldman Sachs, Morgan Stanley, etc. “Around 2025” BHPB, Rio Tinto, etc. (100 Mt) Note: As crude steel demand forecasts are not available in many institutions, crude steel production trends and forecasts have been used. Source: International press Changes of Key Real Estate Indicators 40% 0% -40% ’01 ’03 ’05 ’07 ’09 ’11 ’13 ’15(e) Land area purchased Floor space of real estate started Negative growth rate for two indicators 1 For further details on China’s crude steel consumption forecast by POSCO Research Institute, see the beginning of the next article, “The Impact of China's 'Peak Steel' and Scrap Generation on Steel Raw Material Prices.” China’s Steel Enters ”Peak Zone”: Arguments and ProjectionsChina's Steel Industry Meets the New Normal Changes: 2014 Jan.-Nov. 2015 • Land area purchased (-14% -33.1%) • Floor space of real estate started (-10.7% -18.4%) tion businesses, which account for the highest share of steel consumption, and the diminished elasticity of steel consumption with respect to GDP due to changes in China’s economic struc- ture, such as the expansion of consumption-led growth and tertiary industries. Share of steel consumption by major steel-consuming indus- tries fluctuated slightly from 2000 to 2014: the share of the machinery industry rose 4%p, ’25
- 5. Vol.01 January 2016 3534 Asian Steel Watch and that of the household electronics industry dropped 2%p. The share of the real estate and construction industry, the largest steel-consum- ing industry, remained at 55-56% for the same period. This means that reduced steel demand in China can ultimately be attributed to the slow- down in real estate and construction, the indus- try with the highest share of steel consumption. In fact, in 2014, when apparent crude steel consumption took a downturn in China, a sub- stantial slowdown in real estate was evidenced by negative growth rates in two real estate indi- cators: land area purchased (-14.0%) and floor space of real estate started (-10.7%). These rates were depressed even further in 2015. One of the reasons that steel peaked early in China is that China’s economy has slowed continuously and evolved in such a way as to reduce consumption of steel. In effect, the GDP elasticity of China’s steel demand (steel demand growth rate/GDP growth rate) fell from 3.57 in 2000 to 0.35 in 2014. This is the result of China’s stagnating economy and structural changes to its China has already reached its peak steel in all likelihood, and then gradual negative growth led by structural changes is expected to continue for the long term. economy. In 2013, the share of the tertiary sec- tor in China’s GDP (46.1%) surpassed that of the secondary sector (43.9%) for the first time. Com- parison with Japan, Korea, and other countries confirms that China is entering into the era of decreasing steel consumption. In light of the his- torical pattern of advanced countries, per capita apparent crude steel consumption slowed gradu- ally from the point when per capita GDP reached USD 10,000 (PPP based). This phenomenon can be explained by the fact that when income levels rise, economic growth depends less on invest- ment and more on consumption. China’s per capita GDP surpassed USD 13,000 in 2014, spur- ring consumption-driven growth and expediting the decline of steel consumption. A prolonged period of low growth is expected due to structural changes in China’s steel industry POSCO Research Institute (POSRI) forecasts that China’s crude steel demand will decline from the peak of 766 million tonnes in 2013 to 703 million tonnes in 2015, 670 million tonnes in 2020, and 650 million tonnes in 2025. Many experts seem to agree that China’s crude steel demand will continue to decline in the future. A renowned journalist from Platts Metals Steel News also states that the palpable depression within China’s steel-consuming industries, in- cluding real estate and construction, home appli- ances, and shipbuilding, is more severe than is China’s Steel Product Consumption Forecast ’06 ’08 ’10 ’12 ’14 ’16 ’18 ’20 ’22 ’24 ’26 ’28 ’30 Note : Based on real steel consumption statistics by CISA. According to worldsteel, finished steel consumption peaked at 735 million tonnes in 2013. Source: China Metallurgical Industry Planning and Research Institute (MPI), June 2015, WSD SSS Conference, June 2015 2006 (367 Mt) 2010 (574 Mt) 2020 (689 Mt) 2025 (650 Mt) 2030 (610 Mt) Peak in 2014 (702 Mt) 2006-2014 (Annual average 8.4%) 2014-2030 (Annual average -0.9%) shown by government statistics. Concerns over China’s economic slowdown have been mounting since China lowered its GDP growth target to 7%, from 7.5% in 2014, and the trend of decreas- ing steel consumption is expected to continue. However, a sudden drop in steel consumption is unlikely, because the Chinese government will not overlook the important economic and social roles that the steel industry plays in investment, tax revenue, and job creation. Li Xinchuang, Deputy Secretary General of China Iron and Steel Association (CISA), stated in SSS Confer- ence held by WSD in June, 2015 that China’s real finished steel consumption peaked in 2014 at 702 million tonnes, and projected the figure to fall gradually to 689 million tonnes in 2020, 650 million tonnes in 2025, and 610 million tonnes in 2030. This works out to an annual average decrease of -0.9%. In other words, China has al- ready reached its peak steel in all likelihood, and then gradual negative growth led by structural changes is expected to continue for the long term. GDP Elasticity of China's Steel Consumption ’01 4 3 2 1 0 ’03 ’05 ’07 ’09 ’11 ’14 Source: POSCO Research Institute, November 2015 3.57 2.62 2.19 0.35 China’s Steel Enters ”Peak Zone”: Arguments and ProjectionsChina's Steel Industry Meets the New Normal
- 6. Vol.01 January 2016 3534 Asian Steel Watch and that of the household electronics industry dropped 2%p. The share of the real estate and construction industry, the largest steel-consum- ing industry, remained at 55-56% for the same period. This means that reduced steel demand in China can ultimately be attributed to the slow- down in real estate and construction, the indus- try with the highest share of steel consumption. In fact, in 2014, when apparent crude steel consumption took a downturn in China, a sub- stantial slowdown in real estate was evidenced by negative growth rates in two real estate indi- cators: land area purchased (-14.0%) and floor space of real estate started (-10.7%). These rates were depressed even further in 2015. One of the reasons that steel peaked early in China is that China’s economy has slowed continuously and evolved in such a way as to reduce consumption of steel. In effect, the GDP elasticity of China’s steel demand (steel demand growth rate/GDP growth rate) fell from 3.57 in 2000 to 0.35 in 2014. This is the result of China’s stagnating economy and structural changes to its China has already reached its peak steel in all likelihood, and then gradual negative growth led by structural changes is expected to continue for the long term. economy. In 2013, the share of the tertiary sec- tor in China’s GDP (46.1%) surpassed that of the secondary sector (43.9%) for the first time. Com- parison with Japan, Korea, and other countries confirms that China is entering into the era of decreasing steel consumption. In light of the his- torical pattern of advanced countries, per capita apparent crude steel consumption slowed gradu- ally from the point when per capita GDP reached USD 10,000 (PPP based). This phenomenon can be explained by the fact that when income levels rise, economic growth depends less on invest- ment and more on consumption. China’s per capita GDP surpassed USD 13,000 in 2014, spur- ring consumption-driven growth and expediting the decline of steel consumption. A prolonged period of low growth is expected due to structural changes in China’s steel industry POSCO Research Institute (POSRI) forecasts that China’s crude steel demand will decline from the peak of 766 million tonnes in 2013 to 703 million tonnes in 2015, 670 million tonnes in 2020, and 650 million tonnes in 2025. Many experts seem to agree that China’s crude steel demand will continue to decline in the future. A renowned journalist from Platts Metals Steel News also states that the palpable depression within China’s steel-consuming industries, in- cluding real estate and construction, home appli- ances, and shipbuilding, is more severe than is China’s Steel Product Consumption Forecast ’06 ’08 ’10 ’12 ’14 ’16 ’18 ’20 ’22 ’24 ’26 ’28 ’30 Note : Based on real steel consumption statistics by CISA. According to worldsteel, finished steel consumption peaked at 735 million tonnes in 2013. Source: China Metallurgical Industry Planning and Research Institute (MPI), June 2015, WSD SSS Conference, June 2015 2006 (367 Mt) 2010 (574 Mt) 2020 (689 Mt) 2025 (650 Mt) 2030 (610 Mt) Peak in 2014 (702 Mt) 2006-2014 (Annual average 8.4%) 2014-2030 (Annual average -0.9%) shown by government statistics. Concerns over China’s economic slowdown have been mounting since China lowered its GDP growth target to 7%, from 7.5% in 2014, and the trend of decreas- ing steel consumption is expected to continue. However, a sudden drop in steel consumption is unlikely, because the Chinese government will not overlook the important economic and social roles that the steel industry plays in investment, tax revenue, and job creation. Li Xinchuang, Deputy Secretary General of China Iron and Steel Association (CISA), stated in SSS Confer- ence held by WSD in June, 2015 that China’s real finished steel consumption peaked in 2014 at 702 million tonnes, and projected the figure to fall gradually to 689 million tonnes in 2020, 650 million tonnes in 2025, and 610 million tonnes in 2030. This works out to an annual average decrease of -0.9%. In other words, China has al- ready reached its peak steel in all likelihood, and then gradual negative growth led by structural changes is expected to continue for the long term. GDP Elasticity of China's Steel Consumption ’01 4 3 2 1 0 ’03 ’05 ’07 ’09 ’11 ’14 Source: POSCO Research Institute, November 2015 3.57 2.62 2.19 0.35 China’s Steel Enters ”Peak Zone”: Arguments and ProjectionsChina's Steel Industry Meets the New Normal