
Recommended
More Related Content
Similar to Tailor Your Custom Charts for Different Audiences Using Simple Search Tabs.pdf
Similar to Tailor Your Custom Charts for Different Audiences Using Simple Search Tabs.pdf (20)
Recently uploaded
Recently uploaded (20)
Tailor Your Custom Charts for Different Audiences Using Simple Search Tabs.pdf
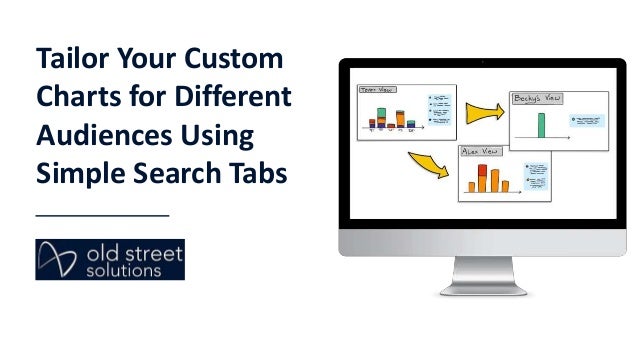
- 1. Tailor Your Custom Charts for Different Audiences Using Simple Search Tabs
- 2. 2 Tailor Your Custom Charts for Different Audiences Using Simple Search Tabs Tailor Your Custom Charts for Different Audiences Using Simple Search Tabs Simple Search is a Jira gadget or Confluence macro that comes with Custom Charts for Jira and Custom Jira Charts for Confluence respectively. It enables fast, dynamic filtering on any Custom Chart it’s linked to. Frankly, it’s a flipping awesome feature for your charts because it allows users viewing them to easily drill into specific data points without having to edit the chart’s configuration.
- 4. 4 Tailor Your Custom Charts for Different Audiences Using Simple Search Tabs Tailor Your Custom Charts for Different Audiences Using Simple Search Tabs The Simple Search gadget/macro and the Custom Charts gadget/macro are separate and have unique configuration settings, although the user interface and customization options are very similar. Adding the interactive searching capability of Simple Search to Custom Charts happens by: 1. Adding and configuring the Simple Search gadget/macro 2. Adding the Custom Charts gadget/macro and connecting it to the Simple Search gadget/macro. This involves: a) Adding the Custom Charts gadget/macro b) Setting the Simple Search gadget/macro as the Source on your Custom Charts gadget/macro c) Configuring the Custom Charts gadget/macro
- 5. 5 Tailor Your Custom Charts for Different Audiences Using Simple Search Tabs Using tabs to create different views for different audiences Everybody cares about different things. Teams want to see the data that’s relevant to them, and the best way of getting them to focus on the right metrics is to not show them ones they don’t need. Enter the Tabs feature of Simple Search, which allows you to create different views for different audiences.
- 7. 7 Tailor Your Custom Charts for Different Audiences Using Simple Search Tabs Using tabs to create different views for different audiences Let’s say that we have 3 audiences who each care about different information in our Jira Service Management project called Support: 1. The entire support team, who need a general view of everything that’s being worked on 2. Becky, an individual agent on the support team 3. Alex, a support team supervisor who needs to pay attention to her team’s tickets In Custom Charts, you can use the Tabs feature to save dynamic searches that will display specific data points for each of these audiences.
- 8. 8 Tailor Your Custom Charts for Different Audiences Using Simple Search Tabs Configuring Simple Search • We’ll start with the same base of information for all 3 audiences. This could be your saved Jira filter, “All Open Support Tickets”, which includes all unresolved tickets in your Support project. First, set this as the Source of Simple Search in the Simple Search editor. • Next, click the TABS toggle to enable the feature. The first tab that you see, Tab 1, will serve as the default view for anyone viewing the Jira dashboard or Confluence page. • So, let’s start by tweaking the default view to make it more suitable for the support team.
- 9. 9 Tailor Your Custom Charts for Different Audiences Using Simple Search Tabs Support team’s tab The support team cares about a general overview of all open tickets in the Support project. They’d like to be able to filter items based on priority to determine what they should focus on. To enable them to do this: 1. Rename “Tab 1” to “Support Team View”. Click the Pencil icon next to “Tab 1”, type the new name in the text box, and hit Enter to save the name. 2. Add fields relevant to the support team. We will keep things pretty general to accommodate all support team members. Add the following Simple Search fields to this tab by clicking + Add a field / Add another field on the right side of the editor under Simple Search Fields. a) Status b) Assignee c) Request Type d) Reporter e) Created f) Priority
- 11. 11 Tailor Your Custom Charts for Different Audiences Using Simple Search Tabs Becky’s tab Becky is most concerned with high-priority bugs in the project that are assigned to her. To give her a good insight into these issues: 1. Add a new tab for Becky in the editor. Click the “+” next to the the Support Team View tab you’ve just made to add the new tab. Then rename “Tab 2” to “Becky’s View” like we did above. 2. Add the relevant Simple Search fields to this view. As mentioned above, Becky cares the most about her top-priority bugs. So let’s add the following fields: a) Issue Type b) Assignee c) Priority d) Status 3. You’ll then need to configure these fields to automatically show data points relevant to Becky. In the Live Preview on the left side of Simple Search, click on the following fields and select these options in each dropdown: a) Issue Type • Select Bug b) Assignee • Select Becky c) Priority • Select Highest, High (use the “OR” operator at the bottom of the dropdown to include tickets that have either priority)
- 13. 13 Tailor Your Custom Charts for Different Audiences Using Simple Search Tabs Alex’s tab Alex is a supervisor on the support team who manages Becky and Morgan. She is most curious about their tickets, especially those that have been escalated. To provide her with a good insight into this data: 1. Add a new tab for Alex in the Simple Search editor. Click the “+” next to “Becky’s View” to add the new tab and rename to “Alex’s View”. 2. Add and configure the following Simple Search fields. Since Alex cares the most about issues escalated today for her team members, we want to make sure that we’re including those issues. a) Issue Type b) Assignee • Select Becky, Morgan (ensure the “OR” operator is selected at the bottom of the dropdown to include both assignees) c) Priority d) Custom JQL toggle (select this from the + Add another field dropdown or just use the + Add Custom JQL toggle button) • Add the following Jira Query Language (JQL): status = Escalated AND status changed to Escalated AFTER startOfWeek() • Rename the Custom JQL field “Escalated Support Issues” using the “Name” box 3. Now you can click Insert to lock in all your Simple Search configurations and insert it onto your page or dashboard.
- 15. 15 Tailor Your Custom Charts for Different Audiences Using Simple Search Tabs Alex’s tab • Once you have created your 3 tabs and inserted Simple Search, link Simple Search to a Custom Chart by setting it as the Source of the gadget or chart (more info on how to do that here). • Voila! Now, when the support team, Becky, and Alex navigate to their Jira dashboard or Confluence page, they can utilize their specific tabs to see the data they’re most interested in transform into beautiful charts. • See below for the end result of using the Simple Search gadget with the 3 tabs to create targeted charts for the 3 audiences.