Download as PDF, PPTX
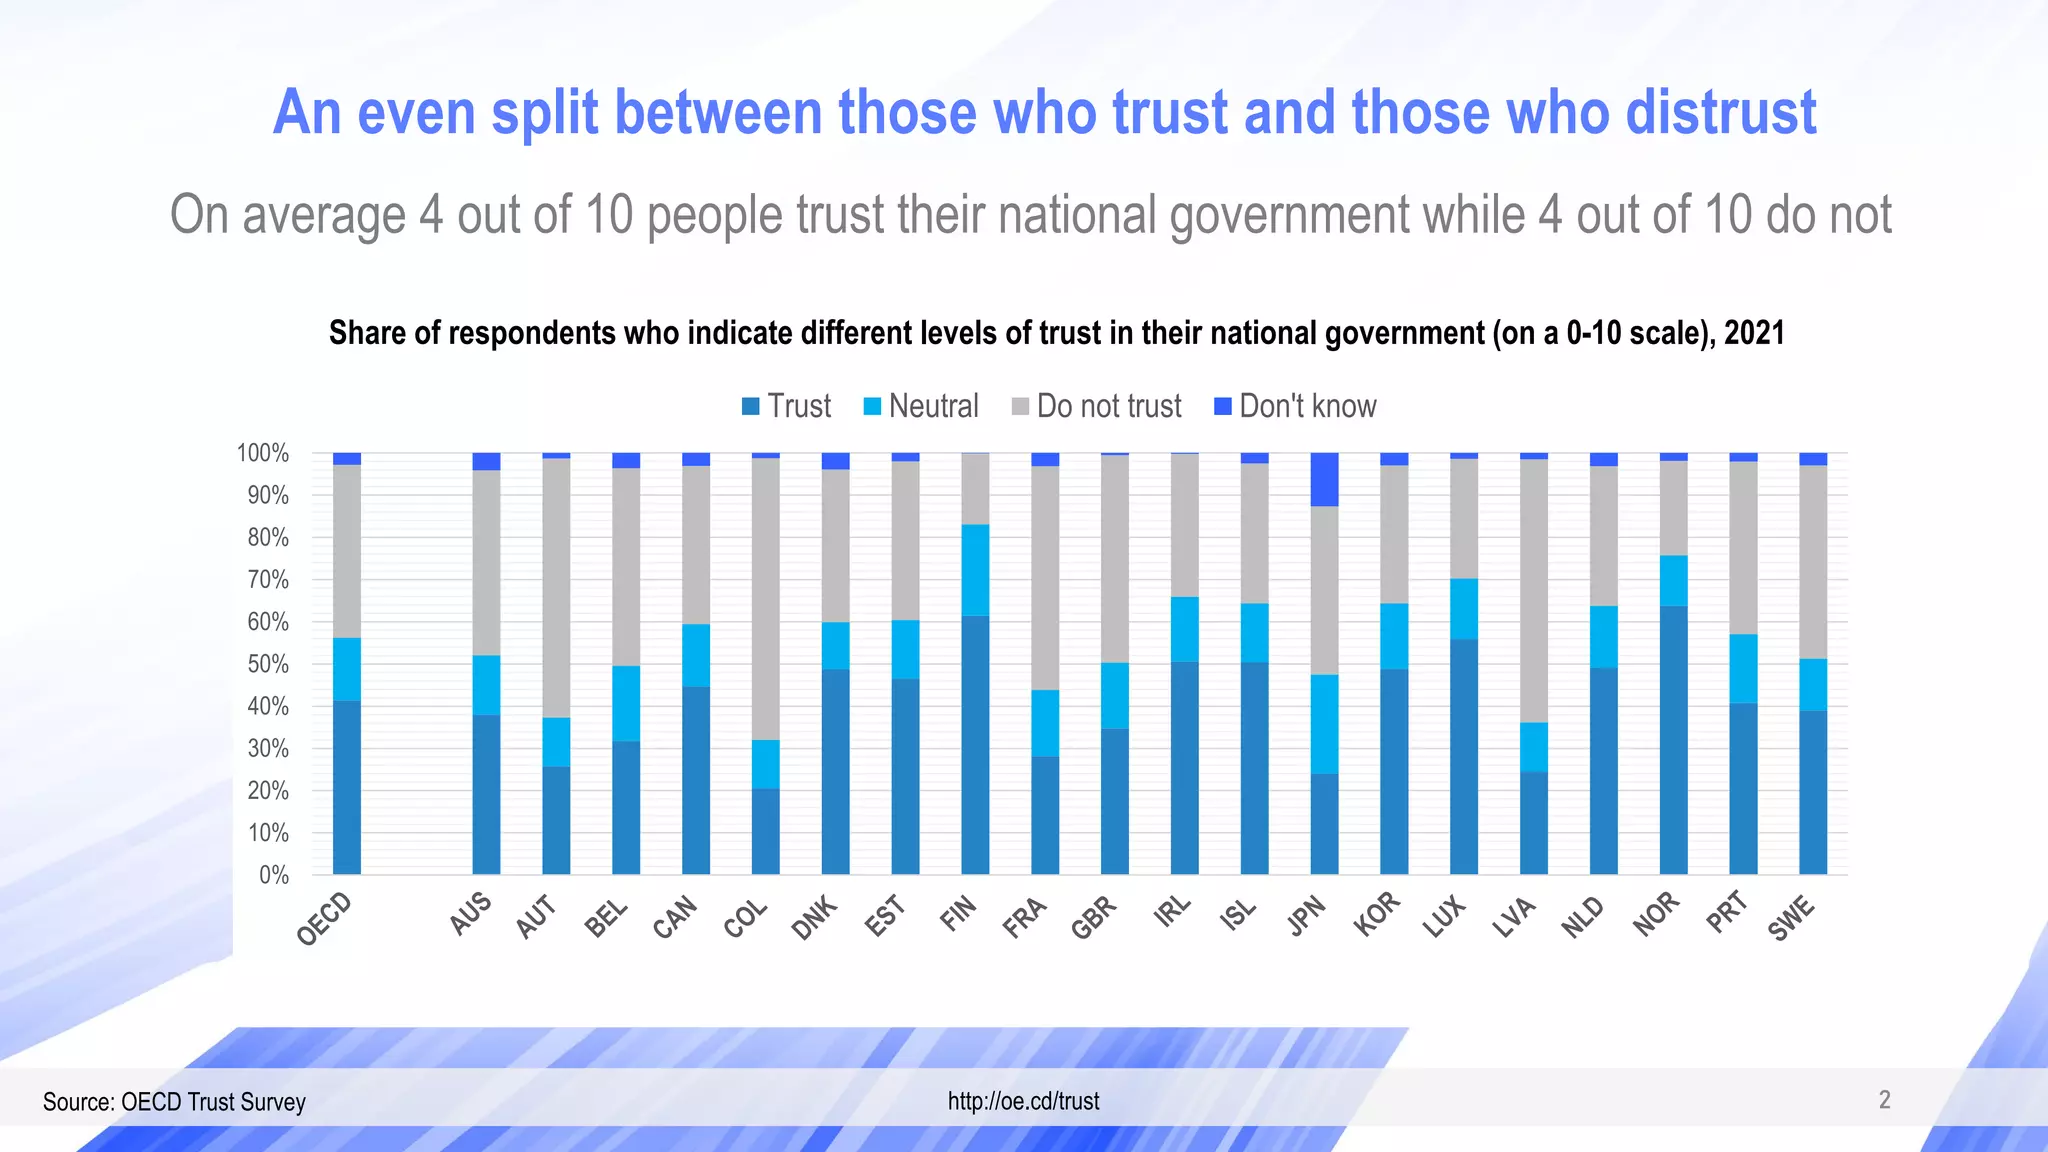
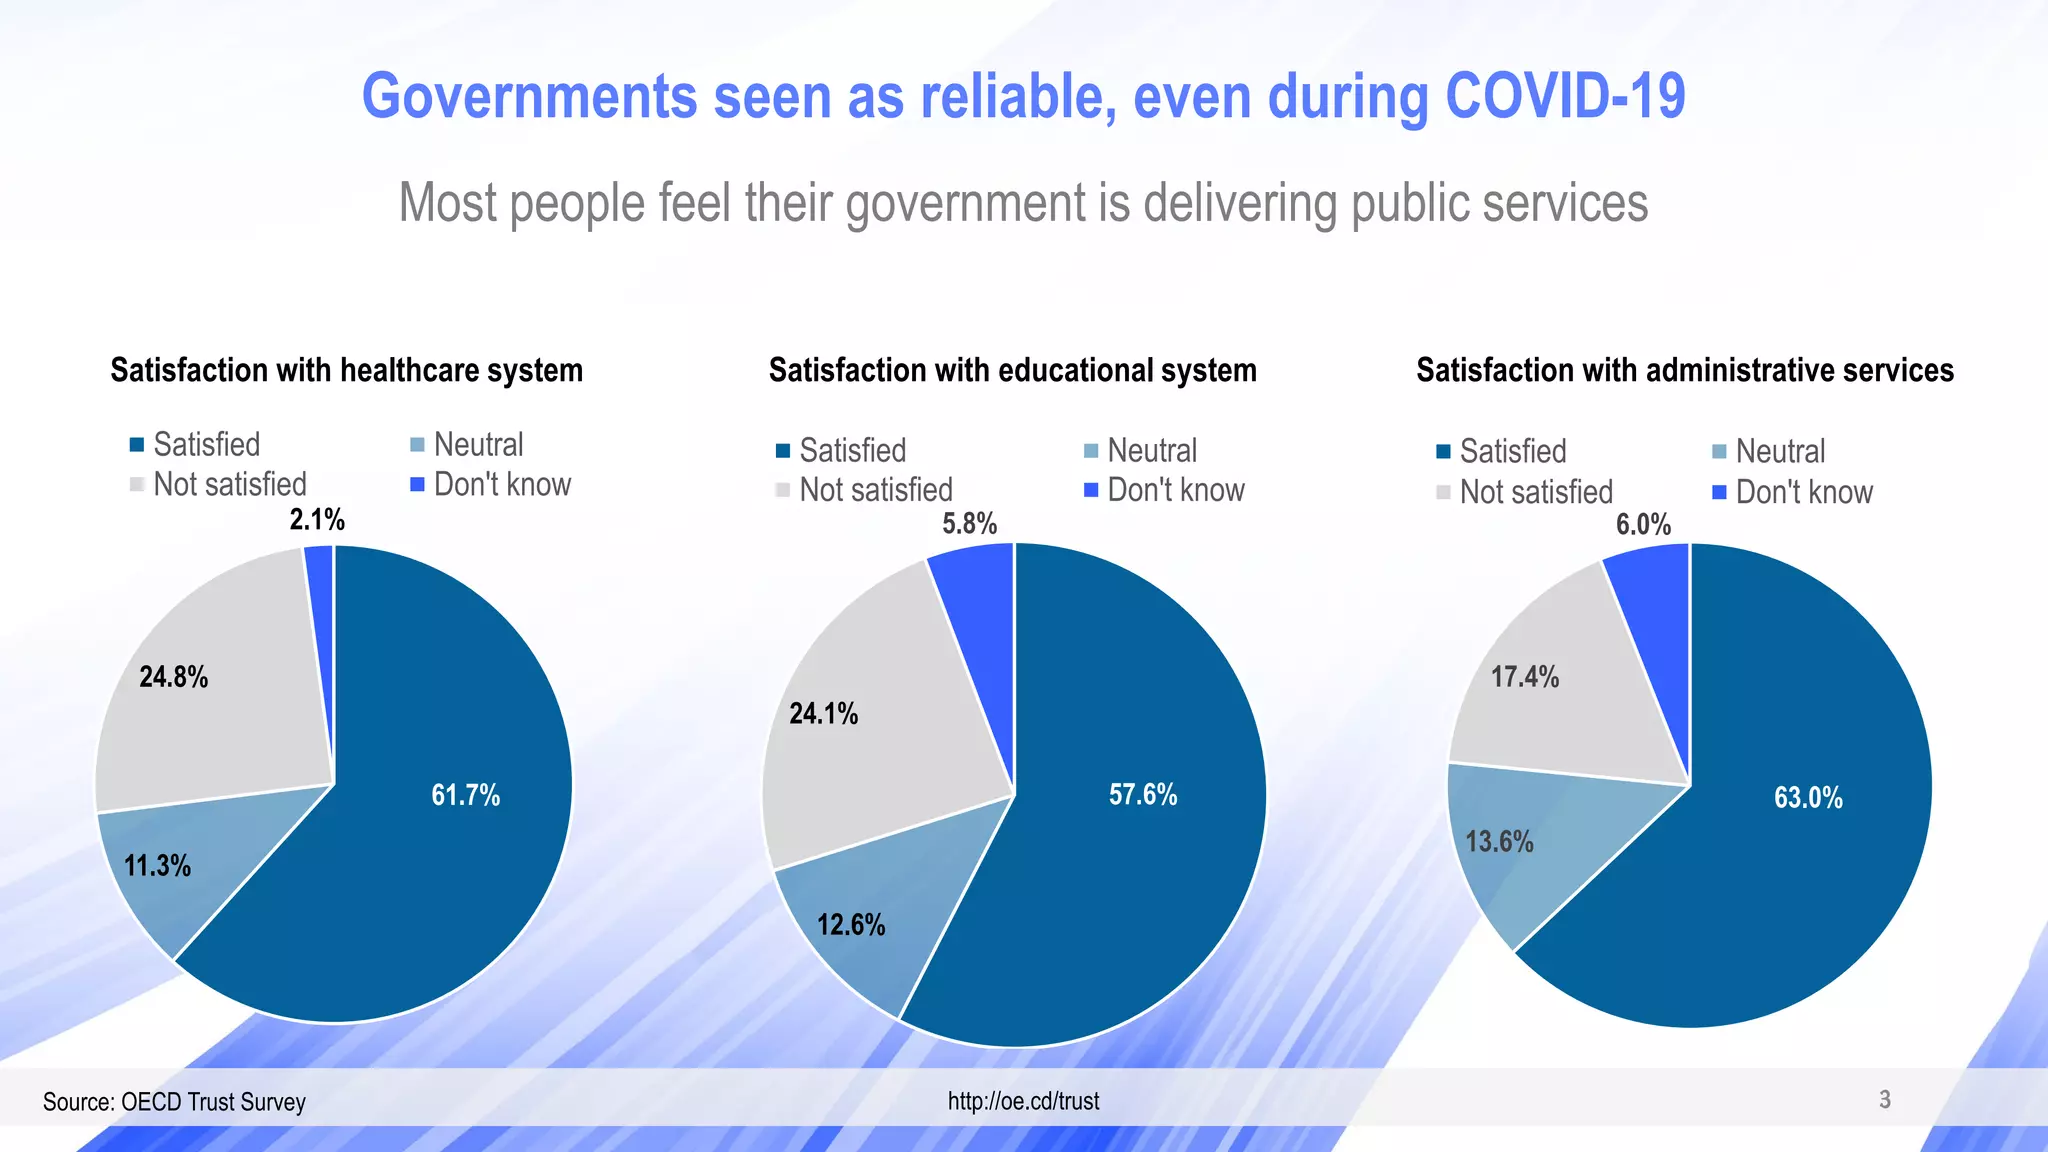
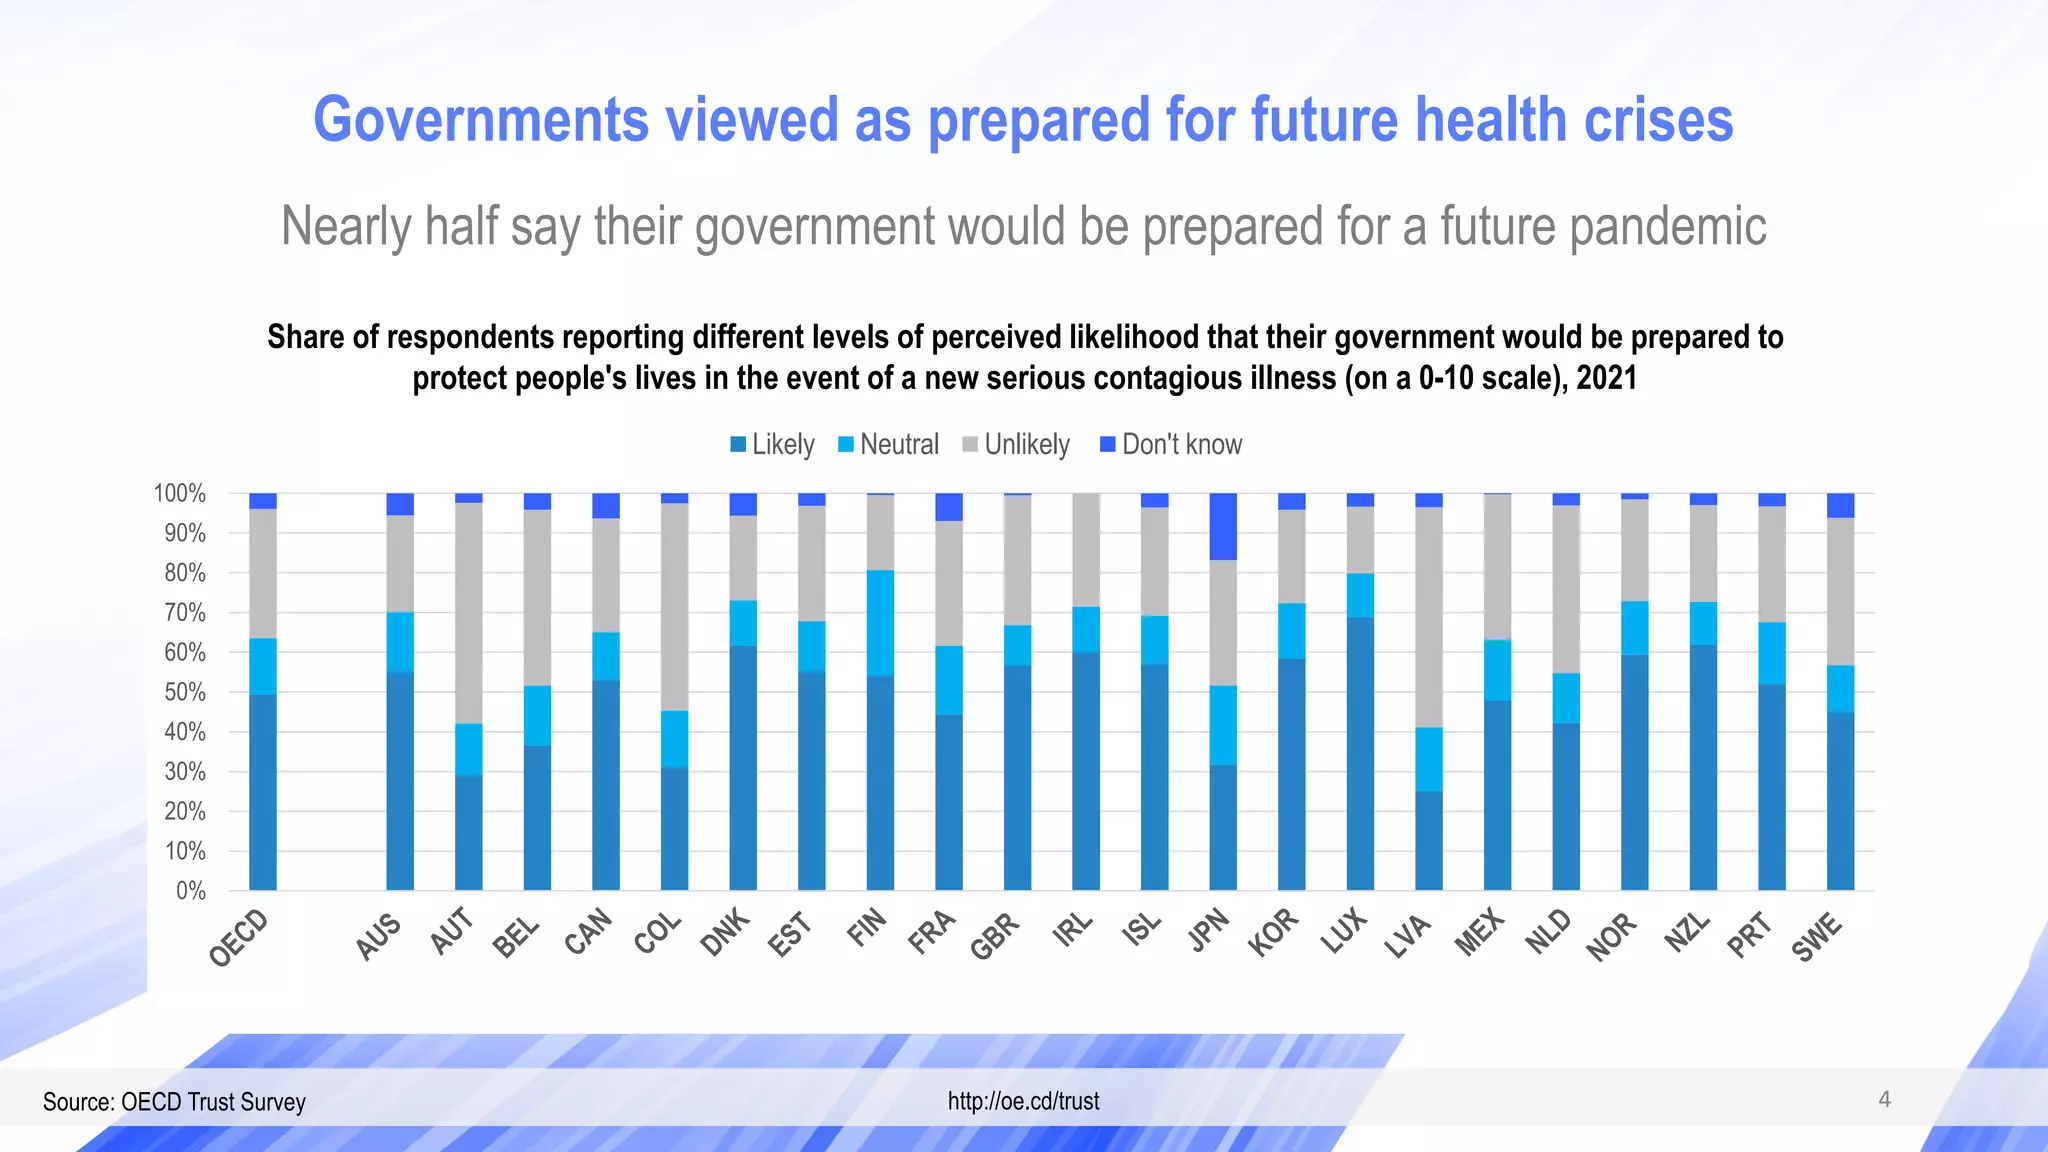
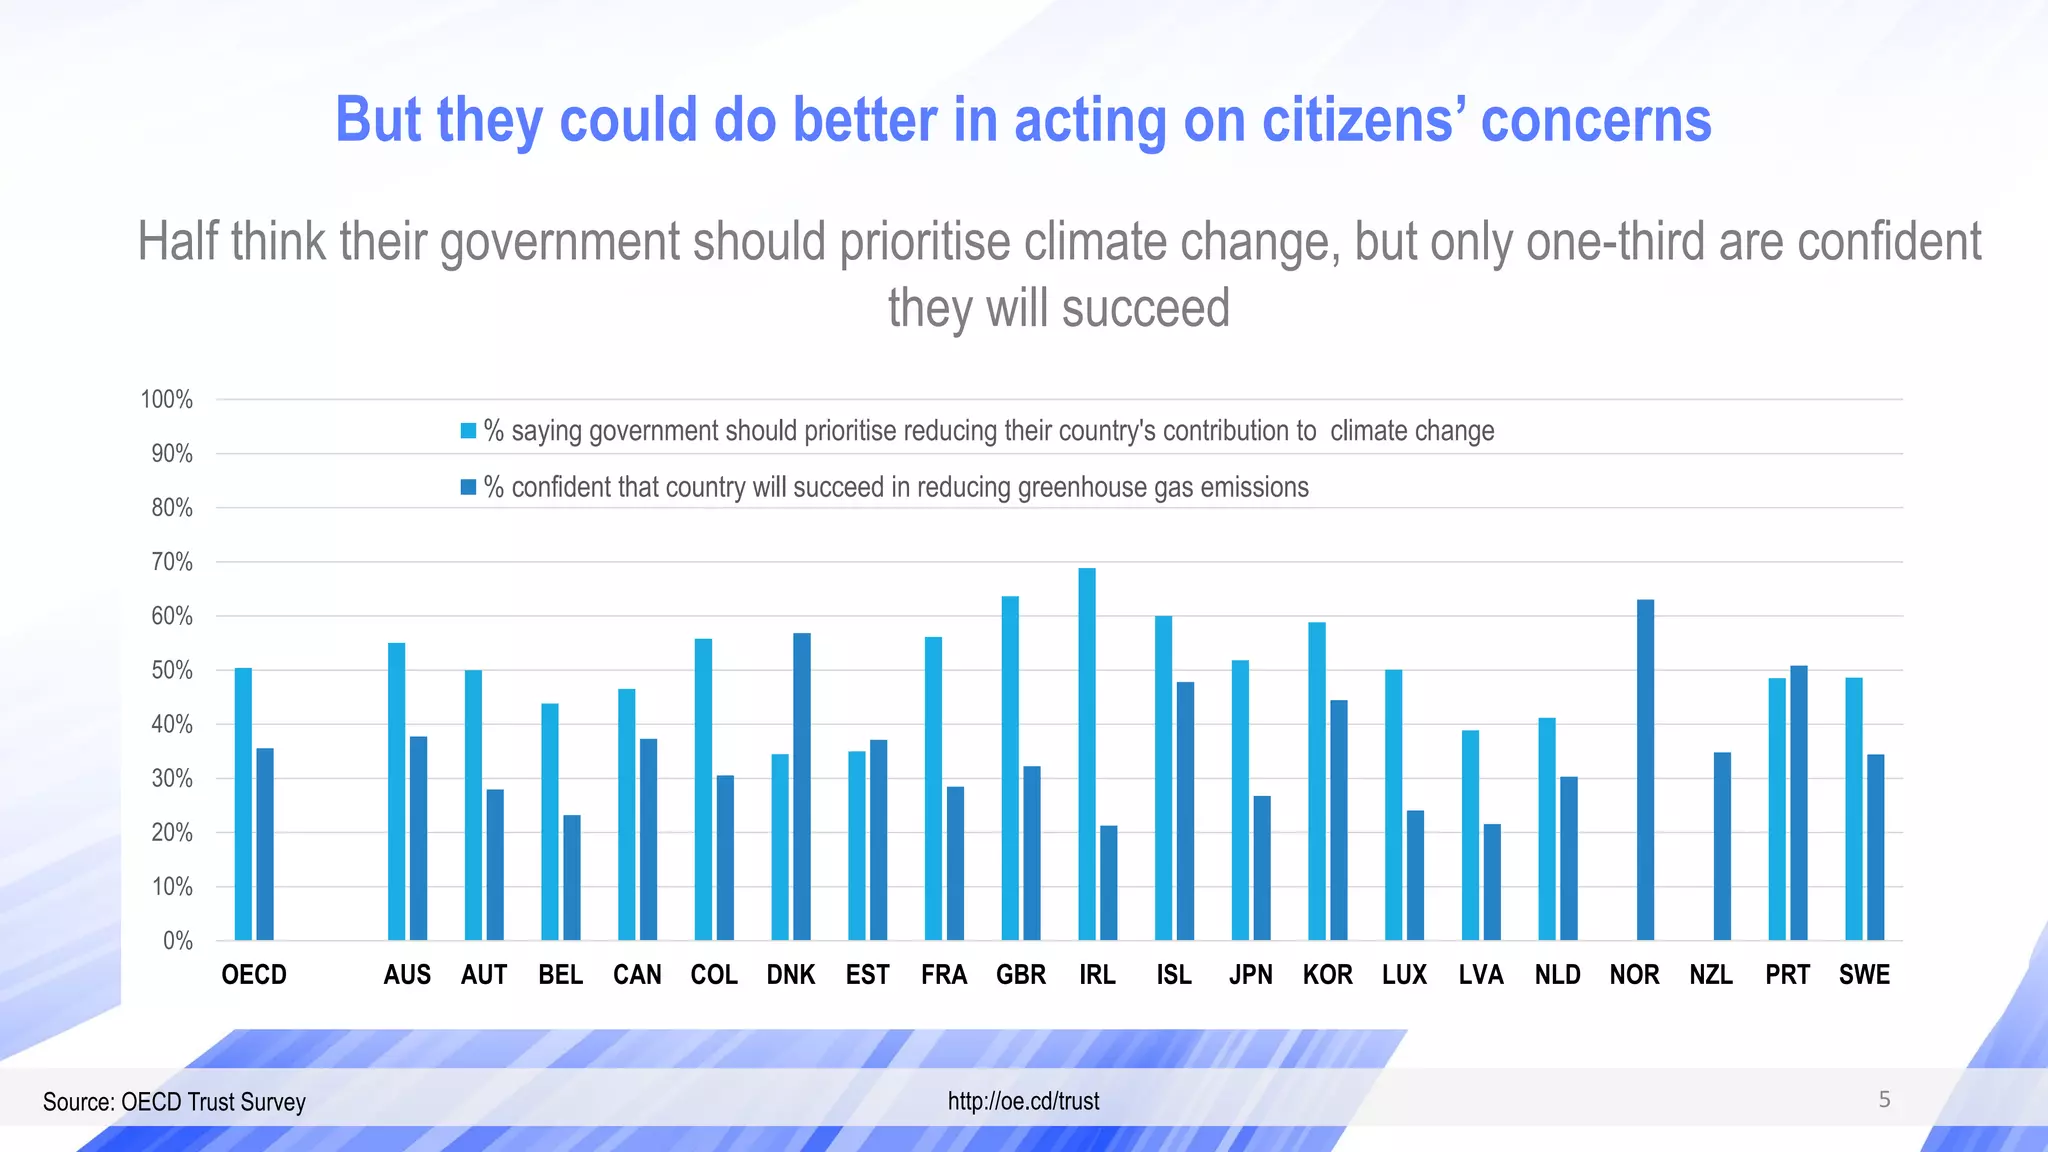
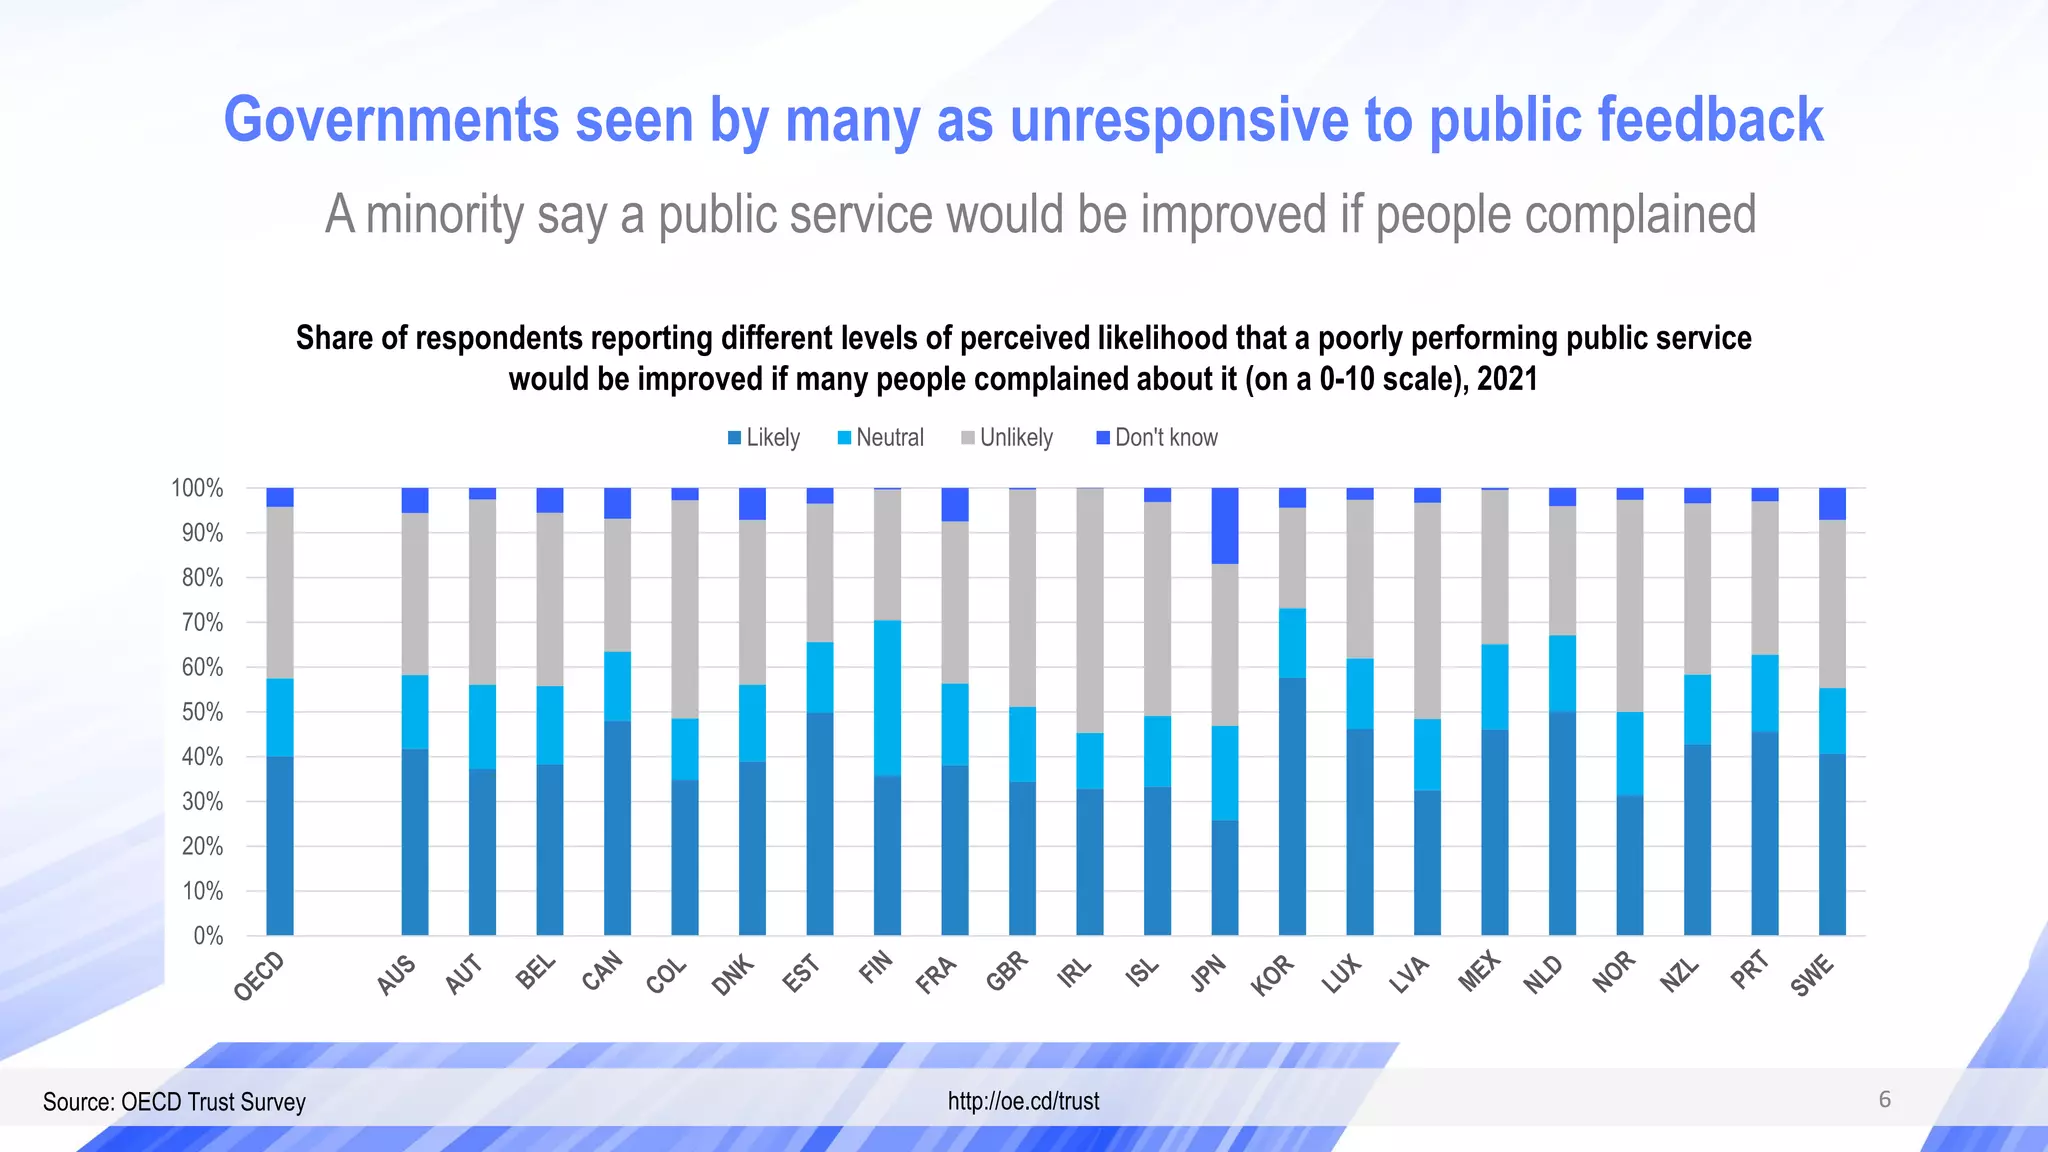
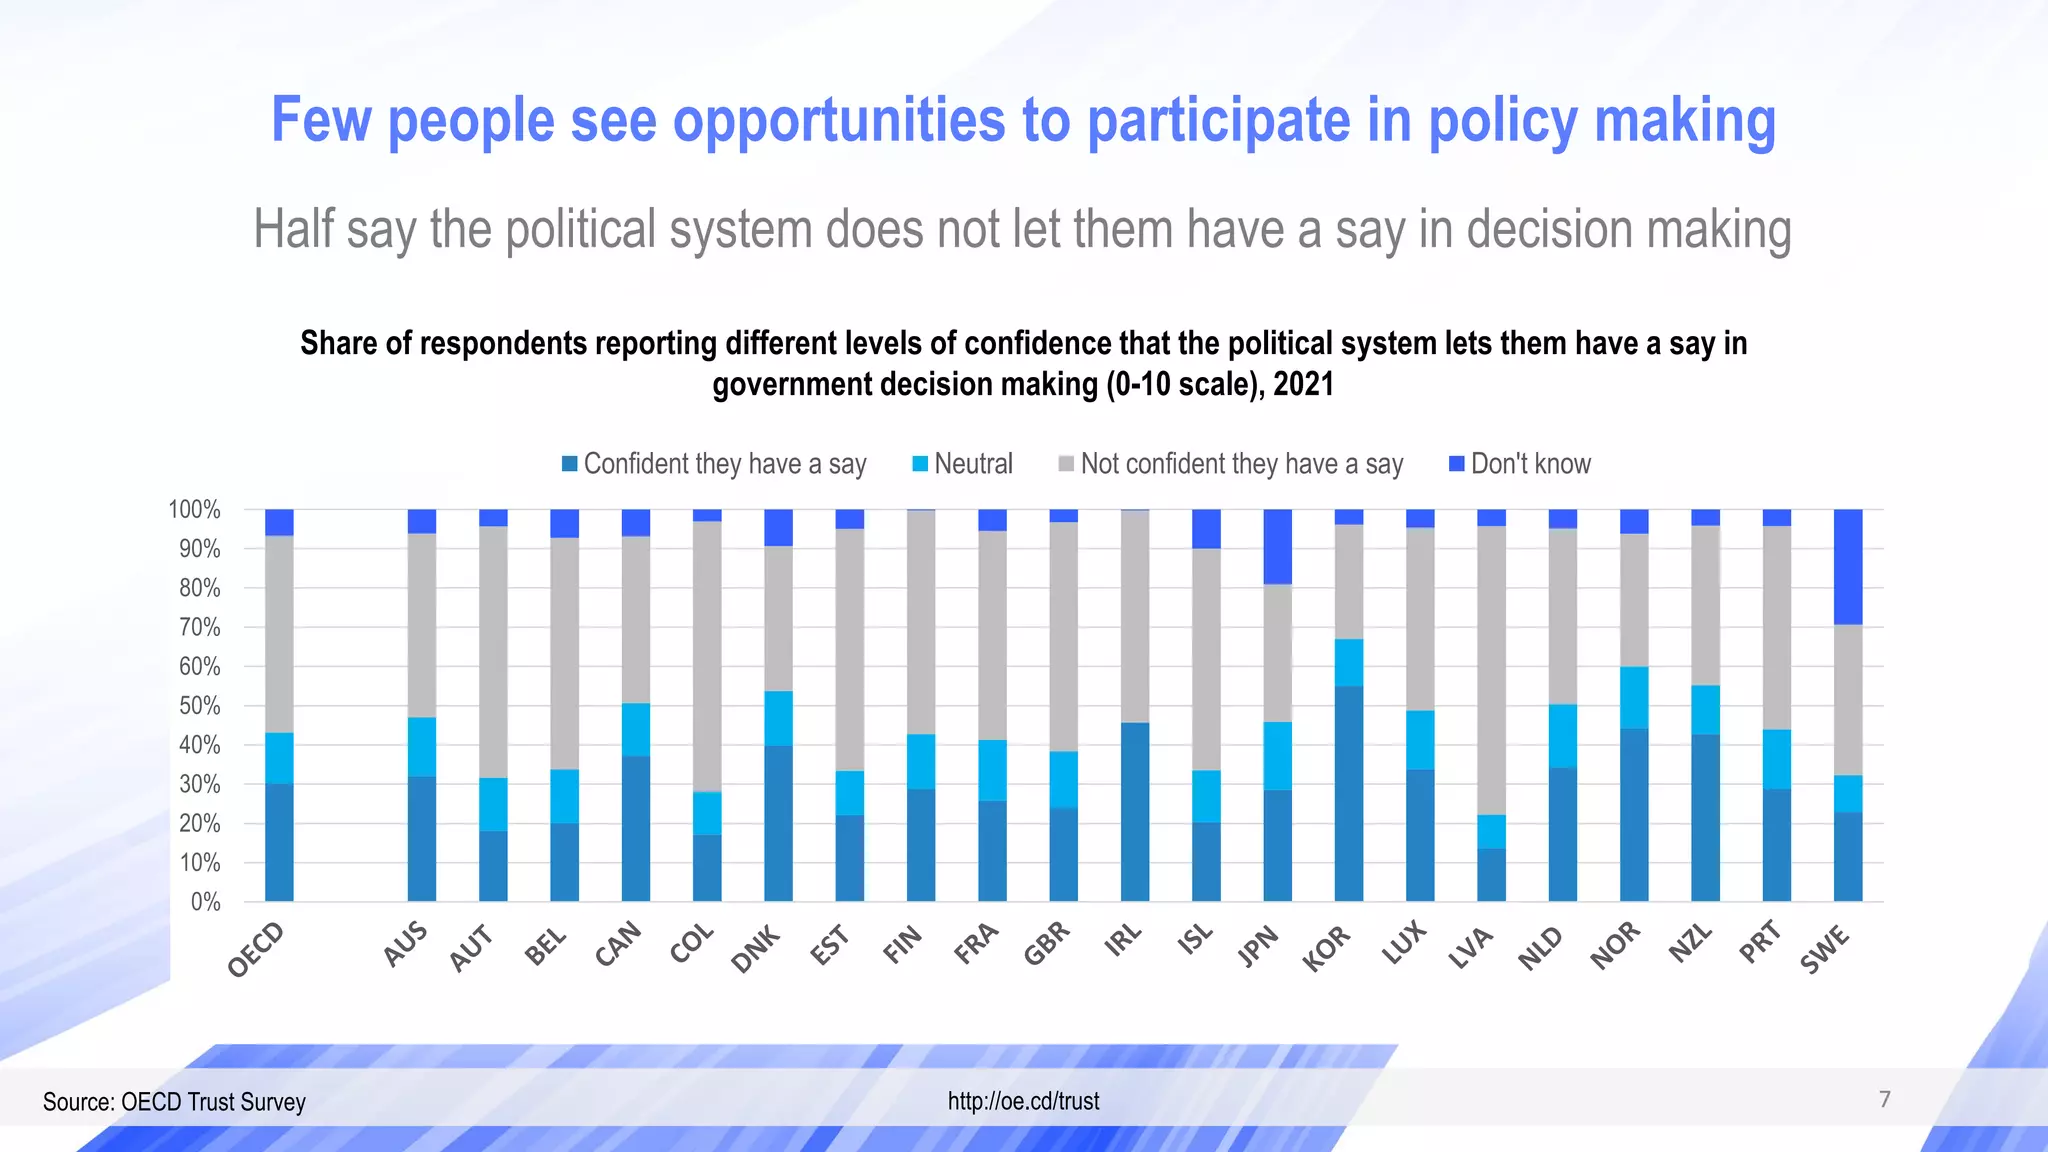
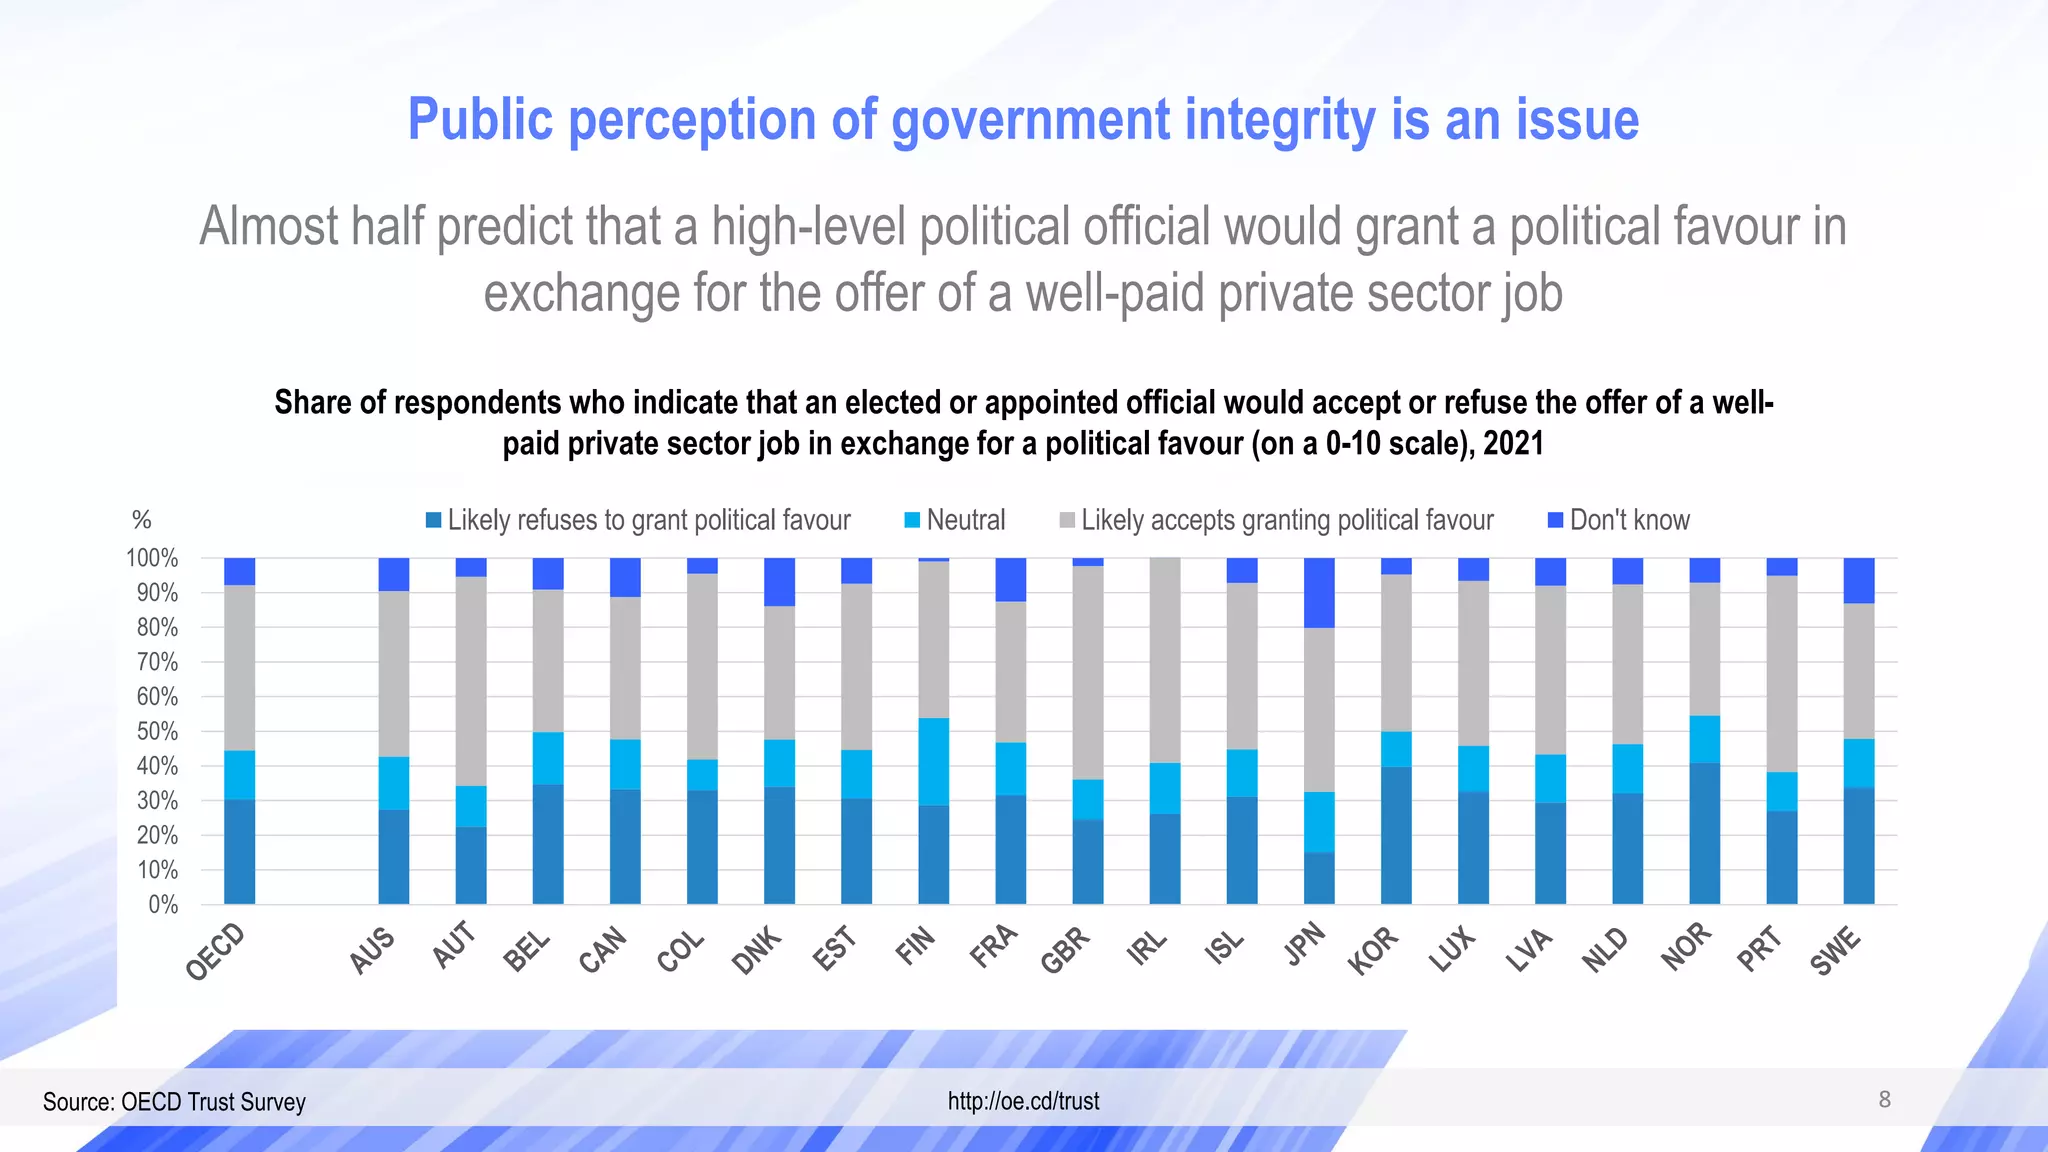
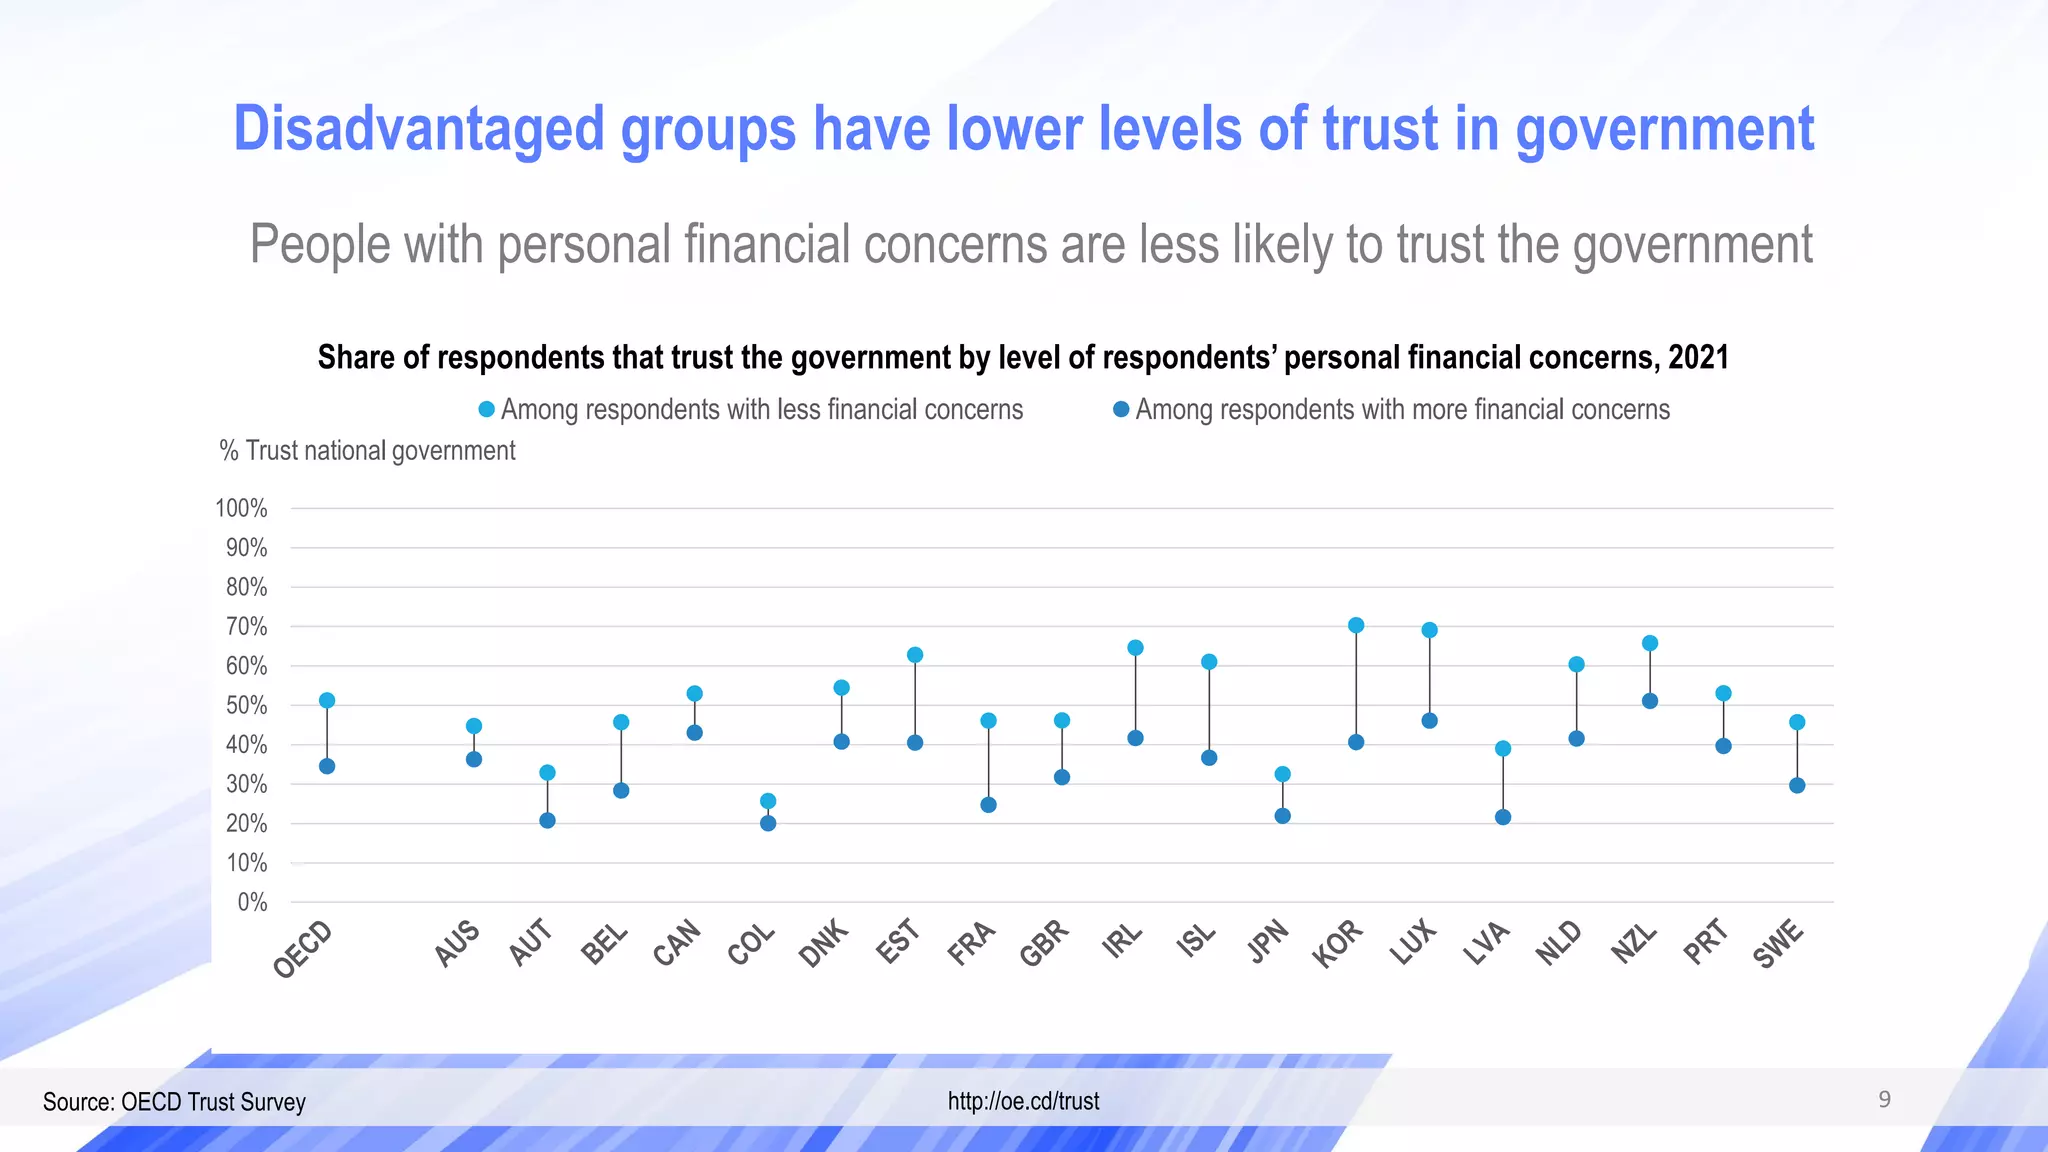
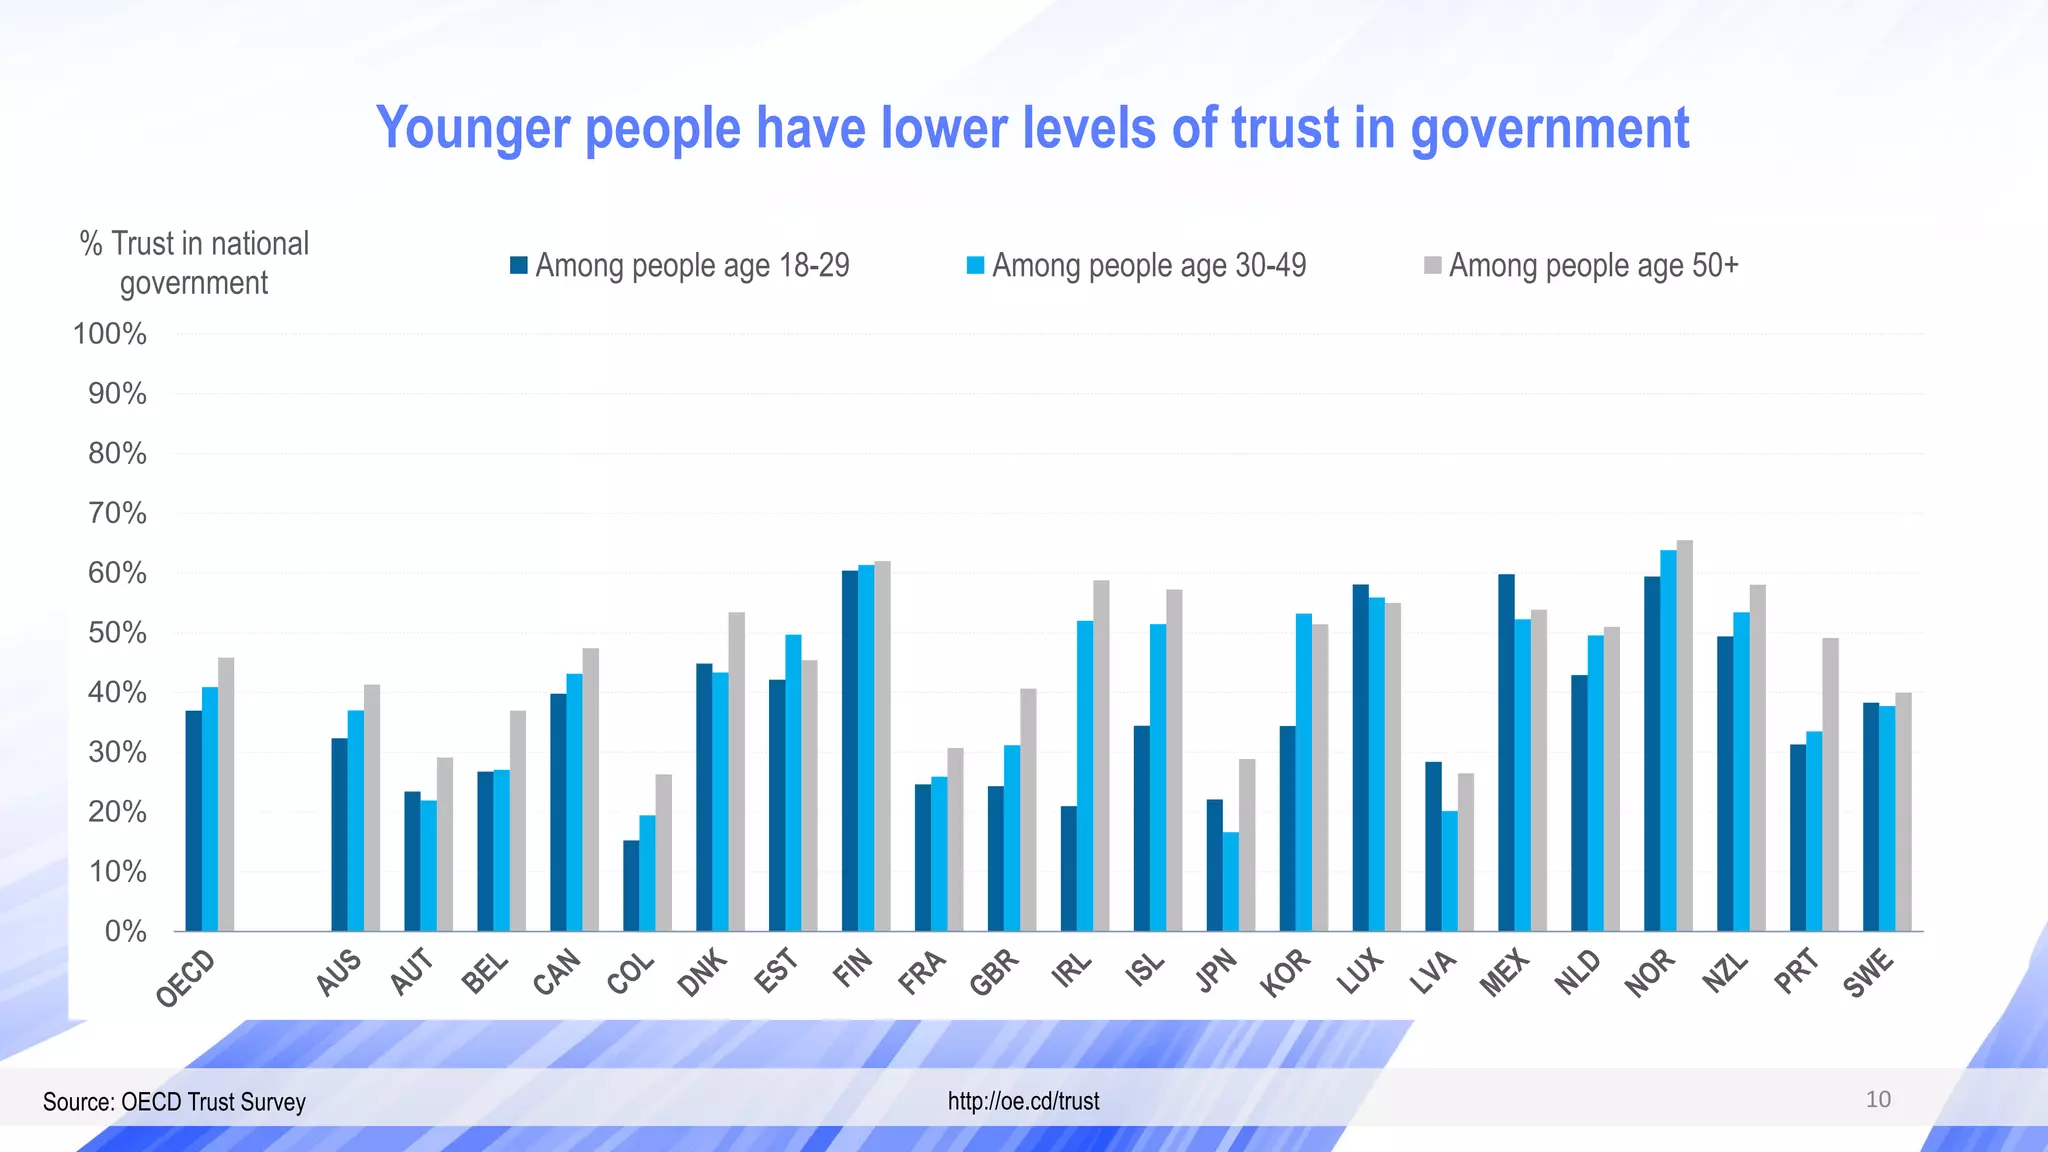

The OECD Trust Survey highlights a split in public opinion, with approximately 40% of people trusting their national government and the same percentage expressing distrust. While many citizens feel the government is delivering public services effectively and is prepared for future health crises, there is significant concern about government responsiveness and integrity. Trust varies among demographics, with disadvantaged groups and younger individuals exhibiting lower levels of trust, prompting recommendations for governments to enhance public engagement and service delivery.
![Crisis Communication Simulation Exercise [Freberg]](https://cdn.slidesharecdn.com/ss_thumbnails/crisiscommunicationsimulationexerciseslideshare-141024103505-conversion-gate01-thumbnail.jpg?width=640&height=640&fit=bounds)


