"Peak Oil - Myth or Reality?" by Jean Laherrère - ASPO France

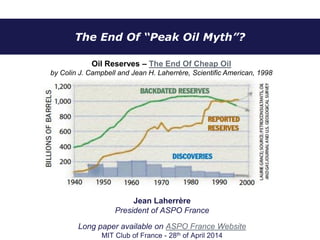
The term Peak Oil was created in 2000 after Jean Laherrère and Colin Campbell wrote an article in 1998 in Scientific American which title was "the End of Cheap Oil". This paper was ignored until 2005 when oil price reached 50$/b anf fully accepted in 2008 when 140 $/b was reached. With the burst of shale oil, many papers have been published on the "Peak Oil Myth" and the fact that the USA would become energy independent thanks to the shale oil & gas revolution. However the oil production peaked in many countries and the end of cheap oil is more than ever a reality that will strongly impact our economies. New oil projects with higher extraction costs require $100/b+ oil price to be profitable while oil demand (and GDP) contracts when oil price surpasses $120/b !

Recommended
More Related Content
What's hot
What's hot (20)
Similar to "Peak Oil - Myth or Reality?" by Jean Laherrère - ASPO France
Similar to "Peak Oil - Myth or Reality?" by Jean Laherrère - ASPO France (20)
More from Nicolas Meilhan
More from Nicolas Meilhan (19)
Recently uploaded
Recently uploaded (20)
"Peak Oil - Myth or Reality?" by Jean Laherrère - ASPO France
- 1. Peak Oil – Myth or Reality? Jean Laherrère President of ASPO France Long paper available on ASPO France Website MIT Club of France - 28th of April 2014 Oil Reserves – The End Of Cheap Oil by Colin J. Campbell and Jean H. Laherrère, Scientific American, 1998
- 2. 2 Life is one cycle - we are all mortal and the Sun will also eventually die! UK coal peak was in 1910, France & Belgium coal peak was in 1960. The production increases until the peak and then declines despite sharp price increase 0 16 32 48 64 80 96 112 128 144 0 10 20 30 40 50 60 70 80 90 1800 1825 1850 1875 1900 1925 1950 1975 2000 2025 price$/t annualproductionMt year France & Belgium coal annual production Rutledge Mt EIA Mt price US anthracite $/t price NW Europe $/t Jean Laherrere 2010 source: Rutledge, EIA wars
- 3. 3 Life is cycles Cycles can also be the race between predator & preys or oil discovery, which can witness several cycles followed by production cycles such as in France or in Belgium 0 5 10 15 20 25 30 35 40 1940 1950 1960 1970 1980 1990 2000 2010 2020 2030 annualoilMb year France annual oil discovery (smooth 7 yr & shift 7 yr) with 2 cycles and production with 3 cycles discovery shift 7 yr oil production C1 C1+C2 C1+C2+C3 Jean Laherrere July 2013 production including Pechelbronn & Autun
- 4. 4 Oil Reserves keep on increasing! The political/financial oil reserves kept on increasing since 1950 with jumps when OPEC added 300 Gb during their quota fights but technical oil reserves peaked in 1980 0 200 400 600 800 1000 1200 1400 1600 1800 1920 1930 1940 1950 1960 1970 1980 1990 2000 2010 2020 remainingreservesGb year World remaining oil reserves from political/financial and technical sources technical = backdated 2P excl XH technical 2P SciAm 1998 current 1P reserves EIA/OGJ Jean Laherrere Oct 2013 Sources: IHS, USDOE, CAPP, API, OGJ -omission of probable -incorrect aggregation Ghawar including tarsands +200 Gb Venezuela +175 Gb Canada OPEC fight for quotas +300 Gb = speculative resources al-Husseini excluding 215 Gb Orinoco from 1936 to 1939 first production Orinoco 1979 Athabasca 1967
- 5. 0 5 10 15 20 25 30 35 40 45 50 55 60 65 70 75 80 1900 1910 1920 1930 1940 1950 1960 1970 1980 1990 2000 2010 2020 Mb/d year World excluding US oil production from EIA all liquids = total oil supply crude +condensate + NGPL crude + condensate US crude + condensate Jean Laherrere March 2014 5 Peak Oil is already fact in many basins such as the North Sea (2000) Chevron reported in 2011 that 33 of the 48 largest producing countries are in decline At a global scale excluding the US oil production: • The “Thirty Glorious” 1945-1975 displays an exponential growth... • Stopped by the oil shock of 1973/1979... • With the oil counter shock of 1986 .... • Followed by the “twenty less glorious 1986- 2005”.... • Since 2005, it is a bumpy plateau within a range equal to the accuracy of the data. 55 60 65 70 75 80 1995 2000 2005 2010 2015 Mb/d year World excluding US oil production from EIA all liquids = total oil supply crude +condensate + NGPL crude + condensate Jean Laherrere April 2014
- 6. 6 The American dream of oil independence will soon disappear... Chevron reported in 2011 that 33 of the 48 largest producing countries are in decline •The Gulf of Mexico oil peak is likely to be in 2001 & 2009 at 560 kb/d with a sharp decline after 2020 •The Texas oil discovery peak was in the 1930s, the oil peak in 1973 and the secondary peak will be in 2014 •The Eagle Ford oil production will peak soon with an ultimate of 3 Gb •The Permian Basin (Texas & New Mexico) has already produced 35 Gb since1923. Its ultimate is 40 Gb with a first peak in 1973 at 2 Mb/d and a second peak in 2016 at 1.5 Mb/d 0 50 100 150 200 250 300 350 400 450 500 550 600 1950 1970 1990 2010 2030 2050 annualoilproductionMb year US Gulf of Mexico oil production & forecast U=24 Gb all U=14 Gb shallow U=10 Gb deep >1000 ft Jean Laherrere April 2014 0 250 500 750 1000 1250 1500 1750 2000 2250 1890 1910 1930 1950 1970 1990 2010 2030 2050 Mb year Texas oil discovery & production (+Eagle Ford) with forecast for U = 75 Gb back disc EIA-0534 U = 75 Gb prod Texas U = 72 Gb Texas -EF East Texas prod U = 3 Gb Eagle Ford Jean Laherrere 8 April 2014 discovery 1926 Yates 2 Gb 1930 East Texas 5.4 Gb 1936 Wasson 2.3 Gb
- 7. 7 Human behave with cycles depending upon their moods and constraints … …and so does the US number of wells following several cycles of different width and heights It is amazing to see that most of the time the cycles are symmetrical “What goes up declines with similar rate” 0 10 000 20 000 30 000 40 000 50 000 60 000 70 000 80 000 90 000 100 000 1945 1955 1965 1975 1985 1995 2005 2015 annualnumberofwells year US annual number of wells all wells oil gas dry Jean Laherrere April 2014
- 8. 8 When will the peak oil happen? All liquids production is likely to peak around 2020 as a bumpy plateau. In 2050, all liquids production will be less than 60 Mb/d, which is 33% lower than in 2013 0 4 7 11 15 18 22 26 29 33 37 40 44 0 10 20 30 40 50 60 70 80 90 100 110 120 1900 1950 2000 2050 2100 2150 2200 productionGb productionMb/d year world all liquids production & forecast from ultimates with EIA/IEO, IEA/WEO, BP & OPEC/WOO forecasts U = 3 Tb IEO 2011 WOO 2013 WEO 2013 NP WEO 2012 NP BP 2014 world U=3000 Gb crude+NGL U = 2200 Gb crude -XH U NGPL 300 Gb NGPL U XH 500 Gb XH 3% crude-XH ref gain A = 5 Mb/d other liq. (biofuels) Jean Laherrere April 2014
- 9. 9 How easy is it to forecast future oil production? Ask the IEA! They seem to have some trouble in doing so...as per their 1998 forecast, we should be producing 102 Mb/d in 2014 which is 15% higher than actual production 70 80 90 100 110 120 130 1995 2000 2005 2010 2015 2020 2025 2030 2035 Mb/d year Evolution of "Oil supply" (biofuels excluded) forecast from IEA/WEO 1998-2012 WEO1998 WEO2000 WEO2002 WEO2004 WEO2006 WEO2008 WEO2010 NP WEO2012 current WEO2012 NP WEO2012 450 ppm oil supply IEAASS Jean Laherrere March 2013
- 10. 10 Peak oil or Peak demand? That is the question... If demand was the driver, the price should drop as there is plenty of oil as some claim...but oil price cannot drop below production costs which range from 70 $/b in the Bakken to as high as 125 $/b in Kashagan (Caspian Sea - 50 G$ project) Note: Estimates for breakeven prices do not include the costs of acreage acquisition or exploration which, if included, would lead to higher breakeven commodity prices. This might be particularly material for North American onshore resource plays Source: Goldman Sach Research Estimates Breakeven of non-producing & recently on stream oil assets - Marginal Top 360 oil fields -
- 11. 11 Peak Oil drives higher oil prices which in turn drives Peak Demand There is a ceiling on oil prices at 120 $2011/b while there is a wall for oil production at 77 Mb/d
- 12. 12 What about the shale gas revolution in the US? Shale gas will peak soon and the decline will be sharp. NG Production is likely to fall to 10 Tcf in 2040 when AEO forecasts 3 times more with 33 Tcf! 0 5 10 15 20 25 30 35 1900 1920 1940 1960 1980 2000 2020 2040 2060 Tcf year US natural gas production & forecasts AEO dry 2013 AEO dry 2012 WEO 2013 NP U=2000 Tcf gross-repress U=1250 Tcf conventionnal U=750 Tcf unconventional Jean Laherrere Feb 2014
- 13. 13 What about coal & gas? Will they also peak? Fossil fuels are expected to peak around 2025 although there is still a big unknown about coal • Oil production will decline after 2020, natural gas production will decline after 2030 but the big unknown is about coal … • But the fossil fuels production per capita has been on a bumpy plateau between 10 and 11 barrel of oil equivalent since 1970 (while it was 5 only boe in 1950) It will peak around 2020 and will be down to 1950 levels before 2100 0 1,4 2,8 4,2 5,6 7 8,4 9,8 11,2 12,6 14 0 10 20 30 40 50 60 70 80 90 100 1850 1875 1900 1925 1950 1975 2000 2025 2050 2075 2100 2125 2150 2175 2200 Gtoe Gboe year world fossil fuels annual production & forecasts assuming no above ground constraint coal Gboe U=750 Gtoe=5.4 Tboe all liquids Gb oil U = 3 Tb +biofuels natural gas Gboe U = 13 Pcf = 2.2 Tboe fossil fuels U = 10,6 Tboe Jean Laherrere April 2014 0 1 2 3 4 5 6 7 8 9 10 11 12 1850 1900 1950 2000 2050 2100 annualproductionpercapitaboe year world fossil fuels production per capita fossil fuels U = 10,6 Tboe coal Gboe U=750 Gtoe=5.4 Tboe all liquids Gb oil U = 3 Tb +biofuels natural gas Gboe U = 13 Pcf = 2.2 Tboe Jean Laherrere April 2014 population = UN 2012 revision
- 14. 14 The End of Peak Oil Myth? • Production data in the world are very poor, unfriendly, incomplete with very poor or no definitions. • Reserves data are even worse, in particular for the political/financial proved reserves, which are wrongly added, leading to artificial reserve growth. • There are no global rules in the world oil industry, no referees and no red cards for bad reporting! • IEA recognized in 2010 that the world conventional crude oil had peaked in 2006, but since 2005 all liquids display a bumpy plateau within a range of the same order of magnitude that the accuracy of the oil supply data which varies among sources between plus and minus 2 Mb/d. • The boom of the shale oil (now called light tight oil) in the US led some economists to claim that the peak oil theory was dead (the end of peak oil, peak oil myth). • Estimating ultimate for US shale oil leads to forecast that the US tight oil boom will peak soon (EIA forecasts the peak for 2017 to 2020) and will decline faster than forecasted by EIA. • But it is likely that oil (all liquids) peak will occur soon and as there is no sufficient substitute to oil for transport, we need to find an alternative solution...