Naveen table
•Download as DOCX, PDF•
0 likes•157 views

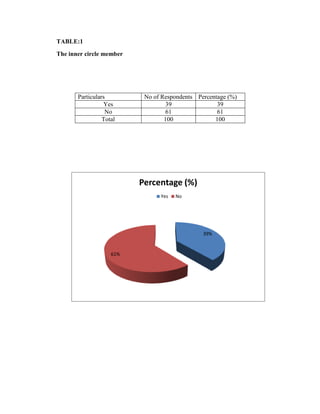
The document contains 6 tables with survey results about customers of Lifestyle stores. Table 1 shows that 39% of respondents are inner circle members while 61% are not. Table 2 shows that 34% of respondents visit Lifestyle stores monthly. Table 3 shows that 47% of respondents find out about offers through SMS. Table 4 shows that 52% of respondents prefer discount offers the most. Table 5 shows that 29% of respondents also like to visit Westside stores. Table 6 shows that 44% of respondents like the ambience most at Lifestyle stores.

Recommended
Recommended
More Related Content
Recently uploaded
Recently uploaded (20)
Featured
Featured (20)
Naveen table
- 1. TABLE:1 The inner circle member Particulars No of Respondents Percentage (%) Yes 39 39 No 61 61 Total 100 100 Percentage (%) Yes No 39% 61%
- 2. TABLE:2 Visit to Lifestyle Particulars No of Respondents Percentage (%) Quarterly 16 16 Monthly 34 34 Twice in a month 27 27 Weekly 23 23 Total 100 100 No of Respondents Quarterly Monthly Twice in a month Weekly 23% 16% 34% 27%
- 3. TABLE:3 Know about the offers in Lifestyle Particulars No of Respondents Percentage (%) SMS 47 47 Friends 20 20 Media 6 6 Others 27 27 Total 100 100 No of Respondents SMS Friends Media Others 27% 47% 6% 20%
- 4. TABLE:4 Offers liked most Particulars No of Respondents Percentage (%) Discount 52 52 Points 25 25 Gifts 13 13 Combo Offer 10 10 Total 100 100
- 5. TABLE:5 Like to visit other than Lifestyle Particulars No of Respondents Percentage (%) Pantaloon’s 23 23 Westside 29 29 Shoppers Stop 27 27 Big Bazaar 16 16 Others 5 5 Total 100 100 No of Respondents Pantaloon’s Westside Shoppers Stop Big Bazaar Others 5% 16% 23% 27% 29%
- 6. TABLE:6 Features liked the most Particulars No of Respondents Percentage (%) Ambience 44 44 Service 23 23 Price 9 9 Product 24 24 Total 100 100 No of Respondents Ambience Service Price Product 24% 44% 9% 23%