SlideShare a Scribd company logo
1 of 13
Download to read offline
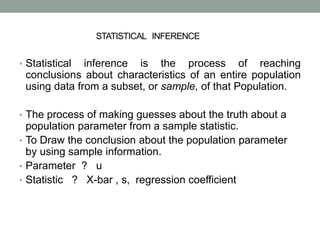
• Statistical inference is the process of reaching
conclusions about characteristics of an entire population
using data from a subset, or sample, of that Population.
• The process of making guesses about the truth about a
population parameter from a sample statistic.
• To Draw the conclusion about the population parameter
by using sample information.
• Parameter ? u
• Statistic ? X-bar , s, regression coefficient
STATISTICAL INFERENCE
Divided into two
branches
Estimation of
parameters
Testing of hypothesis
Problem 1st: C.I for single mean
• The masses, in grams, of thirteen ball bearings taken at
random from a batch are
•
Calculate a 95% C.I for the mean mass of the population.
Solution:
Mean=
σ 𝒙
𝒏
=
𝟑𝟏𝟒.𝟕
𝟏𝟑
= 𝟐𝟒. 𝟐𝟏
𝒔 =
σ(𝑥𝑖 − ഥ
𝒙)𝟐
𝒏 − 𝟏
= 𝟑. 𝟏𝟐 = 𝟏. 𝟕𝟕 ,
𝒗 = 𝒏 − 𝟏 = 𝟏𝟑 − 𝟏 = 𝟏𝟐
21.4 23.1 25.9 23.4 24.5 25.0 25.0 22.5 26.9 26.4 25.8 23.2 21.9
• ഥ
𝑥 ±𝑡𝜕/2v
𝑠
𝑛
• Alpha =1- level of confidence
• Alpha=1-0.95=0.05
• V=n-1= 13-1=12
𝟐𝟒. 𝟐𝟏 ± 𝒕𝟎.𝟎𝟓
𝟐
𝒗
𝟏. 𝟕𝟕
𝟏𝟑
𝒕𝟎.𝟎𝟐𝟓 𝟏𝟐 = 𝟐. 𝟏𝟕𝟗 → (From the t-table)
𝟐𝟒. 𝟐𝟏 ± 𝟐. 𝟏𝟕𝟗
𝟏. 𝟕𝟕
𝟏𝟑
24.21+2.179(0.49)=25.28 Upper-limit
24.21-2.179(0.49)=23.14 Lower-limit
At 95%
Confidence
interval
PERCENTAGE POINT OF STUDENT'S t-DISTRIBUTION
Alpha
d.f. 0.250 0.100 0.050 0.025 0.0125 0.005
1 1.000 3.078 6.314 12.706 31.821 63.657
2 0.816 1.886 2.920 4.303 6.965 9.925
3 0.765 1.638 2.353 3.182 4.541 5.841
4 0.741 1.533 2.132 2.776 3.747 4.604
5 0.727 1.476 2.015 2.571 3.365 4.032
6 0.718 1.440 1.943 2.447 3.143 3.707
7 0.711 1.415 1.895 2.365 2.998 3.499
8 0.706 1.397 1.860 2.306 2.896 3.355
9 0.703 1.383 1.833 2.262 2.821 3.250
10 0.700 1.372 1.812 2.228 2.764 3.169
11 0.697 1.363 1.796 2.201 2.718 3.106
12 0.695 1.356 1.782 2.179 2.681 3.055
13 0.694 1.350 1.771 2.160 2.650 3.012
14 0.692 1.345 1.761 2.145 2.624 2.977
15 0.691 1.341 1.753 2.131 2.602 2.947
16 0.690 1.337 1.746 2.120 2.583 2.921
17 0.689 1.333 1.740 2.110 2.567 2.898
18 0.688 1.330 1.734 2.101 2.552 2.878
19 0.688 1.328 1.729 2.093 2.539 2.861
20 0.687 1.325 1.725 2.086 2.528 2.845
21 0.686 1.323 1.721 2.080 2.518 2.831
22 0.686 1.321 1.717 2.074 2.508 2.819
23 0.685 1.319 1.714 2.069 2.500 2.807
24 0.685 1.318 1.711 2.064 2.492 2.797
25 0.684 1.316 1.708 2.060 2.485 2.787
26 0.684 1.315 1.706 2.056 2.479 2.779
27 0.684 1.314 1.703 2.052 2.473 2.771
28 0.683 1.313 1.701 2.048 2.467 2.763
29 0.683 1.311 1.699 2.045 2.462 2.756
30 0.683 1.310 1.697 2.042 2.457 2.750
40 0.681 1.303 1.684 2.021 2.423 2.704
60 0.679 1.296 1.671 2.000 2.390 2.660
120 0.677 1.289 1.658 1.980 2.358 2.617
• Confidence interval for single mean
• From t-distribution
• when sample information n≤ 30
• From Z-distribution
• when sample information n > 30
Confidence interval estimate of mean In
case of two samples :
• ( ҧ
𝑥1 − ҧ
𝑥2) ± 𝑡𝛼
2
, 𝑣
𝑠𝑝
1
𝑛1
+
1
𝑛2
• ҧ
𝑥1 =mean of 1st sample
• ҧ
𝑥2 =mean of 2nd sample
•
𝛼
2
= 𝑠𝑎𝑚𝑒 𝑎𝑠 𝑖𝑛 𝑠𝑖𝑛𝑔𝑙𝑒 𝑚𝑒𝑎𝑛 𝑐𝑎𝑠𝑒
• V=1st sample number of observation +2nd sample number
of observation - 2
• 𝑠𝑝= pooled standard-deviation
For two random sample:
• 𝑆𝑝
2
=
1
𝑛1+𝑛2−2
σ𝑖
𝑛1
𝑥1𝑖 − ҧ
𝑥1
2 + σ𝑗
𝑛2
𝑥2𝑗 − ҧ
𝑥2
2
• 𝑠𝑝= 𝑆𝑝
2
• 𝑠𝑝=
1
𝑛1+𝑛2−2
σ𝑖
𝑛1
𝑥1𝑖 − ҧ
𝑥1
2 + σ𝑗
𝑛2
𝑥2𝑗 − ҧ
𝑥1
2
V=𝑛1 + 𝑛2 − 2
Problem 2nd:
• Given that
• ҧ
𝑥1 = 75, 𝑛1 = 9, σ 𝑥1𝑖 − ҧ
𝑥1
2
= 1482;
• ҧ
𝑥2 = 60, 𝑛2 = 16, σ 𝑥2𝑗 − ҧ
𝑥2
2
= 1830;
And assuming that the two samples were randomly
selected from population in which equal variance, calculate
CI for 80%
• Solution:
• 𝑠𝑝=
1
𝑛1+𝑛2−2
σ𝑖
𝑛1
𝑥1𝑖 − ҧ
𝑥1
2 + σ𝑗
𝑛2
𝑥2𝑗 − ҧ
𝑥1
2
• 𝑠𝑝 =
1
9+16−2
1482 + 1830 = 144 = 12
• V=𝑛1 + 𝑛2 − 2
• V=9+16-2=23
• Alpha=1-0.80 = 0.20
•
𝛼
2
=
0.20
2
=0.10
• 𝑡0.10 23 → 𝑓𝑟𝑜𝑚 𝑡ℎ𝑒 𝑡 𝑡𝑎𝑏𝑙𝑒 = 1.32
• ҧ
𝑥1 − ҧ
𝑥2=75-60=15
• Substituting these values, we obtain:
• ( ҧ
𝑥1 − ҧ
𝑥2) ± 𝑡𝛼
2
, 𝑣 𝑠𝑝
1
𝑛1
+
1
𝑛2
15±(1.32)(12)
1
9
+
1
16
15±15.84*(0.4167)
15+15.84*0.4167=21.60 Upper limit
15-15.84*0.4167=8.3994 Lower Limit
(8.3994 , 21.60)
Assignment :
Consider the data: Find Confidence interval for two mean in case of 80% and for 95%
1st
sample
x1
10 14 16 8 15 17 19 21 13
2nd
sample
X2
12 13 19 15 8 15 16 18 8
• Solution:
• 𝑠𝑝 = 232.18 = 15.237
• V=𝑛1 + 𝑛2 − 2
• V=9+9-2
• Alpha=1-0.95 = 0.05
•
𝛼
2
=
0.050
2
=0.025
• 𝑡0.025 16 → 𝑓𝑟𝑜𝑚 𝑡ℎ𝑒 𝑡 𝑡𝑎𝑏𝑙𝑒 =2.120
• ( ҧ
𝑥1 − ҧ
𝑥2) ± 𝑡𝛼
2
, 𝑣
𝑠𝑝
1
𝑛1
+
1
𝑛2
• 9 ± 2.120(15.237*0.4711)
• 9 ± 9.597187
• 9+ 9.597187 for upper limit 18.59719
• 9-9.597187 for lower limit -0.5971875

More Related Content

What's hot

Range, quartiles, and interquartile range
Range, quartiles, and interquartile rangeRange, quartiles, and interquartile range
Range, quartiles, and interquartile rangeswarna sudha
 
Data analysis 1
Data analysis 1Data analysis 1
Data analysis 1Bùi Trâm
 
Descriptive statistics
Descriptive statisticsDescriptive statistics
Descriptive statisticsAileen Balbido
 
Fitting Data into Probability Distributions
Fitting Data into Probability DistributionsFitting Data into Probability Distributions
Fitting Data into Probability DistributionsNikhil Chandra Sarkar
 
Statistics-Measures of dispersions
Statistics-Measures of dispersionsStatistics-Measures of dispersions
Statistics-Measures of dispersionsCapricorn
 
Measures of central tendency
Measures of central tendencyMeasures of central tendency
Measures of central tendencyChie Pegollo
 
Measure of Central Tendency
Measure of Central Tendency Measure of Central Tendency
Measure of Central Tendency Umme Habiba
 
Practice Test Chapter 6 (Normal Probability Distributions)
Practice Test Chapter 6 (Normal Probability Distributions)Practice Test Chapter 6 (Normal Probability Distributions)
Practice Test Chapter 6 (Normal Probability Distributions)Long Beach City College
 
Confidence Interval Estimation
Confidence Interval EstimationConfidence Interval Estimation
Confidence Interval EstimationYesica Adicondro
 
Measures of Central Tendency, Variability and Shapes
Measures of Central Tendency, Variability and ShapesMeasures of Central Tendency, Variability and Shapes
Measures of Central Tendency, Variability and ShapesScholarsPoint1
 
Quantile and Expectile Regression
Quantile and Expectile RegressionQuantile and Expectile Regression
Quantile and Expectile RegressionArthur Charpentier
 
Scatterplots, Correlation, and Regression
Scatterplots, Correlation, and RegressionScatterplots, Correlation, and Regression
Scatterplots, Correlation, and RegressionLong Beach City College
 
Basic Descriptive statistics
Basic Descriptive statisticsBasic Descriptive statistics
Basic Descriptive statisticsAjendra Sharma
 
Simple linear regression (final)
Simple linear regression (final)Simple linear regression (final)
Simple linear regression (final)Harsh Upadhyay
 
Pearson Correlation, Spearman Correlation &Linear Regression
Pearson Correlation, Spearman Correlation &Linear RegressionPearson Correlation, Spearman Correlation &Linear Regression
Pearson Correlation, Spearman Correlation &Linear RegressionAzmi Mohd Tamil
 
Point and Interval Estimation
Point and Interval EstimationPoint and Interval Estimation
Point and Interval EstimationShubham Mehta
 

What's hot (20)

Range, quartiles, and interquartile range
Range, quartiles, and interquartile rangeRange, quartiles, and interquartile range
Range, quartiles, and interquartile range
 
Regression Analysis
Regression AnalysisRegression Analysis
Regression Analysis
 
Z scores
Z scoresZ scores
Z scores
 
Data analysis 1
Data analysis 1Data analysis 1
Data analysis 1
 
Descriptive statistics
Descriptive statisticsDescriptive statistics
Descriptive statistics
 
Fitting Data into Probability Distributions
Fitting Data into Probability DistributionsFitting Data into Probability Distributions
Fitting Data into Probability Distributions
 
Statistics-Measures of dispersions
Statistics-Measures of dispersionsStatistics-Measures of dispersions
Statistics-Measures of dispersions
 
Measures of central tendency
Measures of central tendencyMeasures of central tendency
Measures of central tendency
 
Measure of Central Tendency
Measure of Central Tendency Measure of Central Tendency
Measure of Central Tendency
 
Measures of relationship
Measures of relationshipMeasures of relationship
Measures of relationship
 
Practice Test Chapter 6 (Normal Probability Distributions)
Practice Test Chapter 6 (Normal Probability Distributions)Practice Test Chapter 6 (Normal Probability Distributions)
Practice Test Chapter 6 (Normal Probability Distributions)
 
Confidence Interval Estimation
Confidence Interval EstimationConfidence Interval Estimation
Confidence Interval Estimation
 
Measures of Central Tendency, Variability and Shapes
Measures of Central Tendency, Variability and ShapesMeasures of Central Tendency, Variability and Shapes
Measures of Central Tendency, Variability and Shapes
 
Quantile and Expectile Regression
Quantile and Expectile RegressionQuantile and Expectile Regression
Quantile and Expectile Regression
 
Scatterplots, Correlation, and Regression
Scatterplots, Correlation, and RegressionScatterplots, Correlation, and Regression
Scatterplots, Correlation, and Regression
 
Basic Descriptive statistics
Basic Descriptive statisticsBasic Descriptive statistics
Basic Descriptive statistics
 
Simple linear regression (final)
Simple linear regression (final)Simple linear regression (final)
Simple linear regression (final)
 
Pearson Correlation, Spearman Correlation &Linear Regression
Pearson Correlation, Spearman Correlation &Linear RegressionPearson Correlation, Spearman Correlation &Linear Regression
Pearson Correlation, Spearman Correlation &Linear Regression
 
Two Means, Independent Samples
Two Means, Independent SamplesTwo Means, Independent Samples
Two Means, Independent Samples
 
Point and Interval Estimation
Point and Interval EstimationPoint and Interval Estimation
Point and Interval Estimation
 

Similar to Statistical Inference.pdf

AP Statistics - Confidence Intervals with Means - One Sample
AP Statistics - Confidence Intervals with Means - One SampleAP Statistics - Confidence Intervals with Means - One Sample
AP Statistics - Confidence Intervals with Means - One SampleFrances Coronel
 
Lecture 03 Inferential Statistics 1
Lecture 03 Inferential Statistics 1Lecture 03 Inferential Statistics 1
Lecture 03 Inferential Statistics 1Riri Ariyanty
 
New Clustering-based Forecasting Method for Disaggregated End-consumer Electr...
New Clustering-based Forecasting Method for Disaggregated End-consumer Electr...New Clustering-based Forecasting Method for Disaggregated End-consumer Electr...
New Clustering-based Forecasting Method for Disaggregated End-consumer Electr...Peter Laurinec
 
Power_flow..نظم_قدرة.pptx
Power_flow..نظم_قدرة.pptxPower_flow..نظم_قدرة.pptx
Power_flow..نظم_قدرة.pptxAhmedAbdAldafea
 
scical manual fx-250HC
scical manual fx-250HCscical manual fx-250HC
scical manual fx-250HCpearlapplepen
 
Business statistics solved numericals
Business statistics solved numericalsBusiness statistics solved numericals
Business statistics solved numericalsAnurag Srivastava
 
Tarea 2 hidraulica iii-cabrera arias roberto alejandro
Tarea 2 hidraulica iii-cabrera arias roberto alejandroTarea 2 hidraulica iii-cabrera arias roberto alejandro
Tarea 2 hidraulica iii-cabrera arias roberto alejandroAlejandro Cabrera
 
The sexagesimal foundation of mathematics
The sexagesimal foundation of mathematicsThe sexagesimal foundation of mathematics
The sexagesimal foundation of mathematicsMichielKarskens
 
Normal distribution - Unitedworld School of Business
Normal distribution - Unitedworld School of BusinessNormal distribution - Unitedworld School of Business
Normal distribution - Unitedworld School of BusinessArnab Roy Chowdhury
 
EJERCICIOS RESUELTOS DE LOGARITMOS
EJERCICIOS RESUELTOS DE LOGARITMOSEJERCICIOS RESUELTOS DE LOGARITMOS
EJERCICIOS RESUELTOS DE LOGARITMOSADRIANULLOAP
 
Mean, median, and mode ug
Mean, median, and mode ugMean, median, and mode ug
Mean, median, and mode ugAbhishekDas15
 
Regression Analysis , A statistical approch to analysis data.pptx
Regression Analysis , A statistical  approch to analysis data.pptxRegression Analysis , A statistical  approch to analysis data.pptx
Regression Analysis , A statistical approch to analysis data.pptxTifahInternational
 
Introduction to Probability and Statistics 13th Edition Mendenhall Solutions ...
Introduction to Probability and Statistics 13th Edition Mendenhall Solutions ...Introduction to Probability and Statistics 13th Edition Mendenhall Solutions ...
Introduction to Probability and Statistics 13th Edition Mendenhall Solutions ...MaxineBoyd
 
Douglas C. Montgomery - Design and Analysis of Experiments, solutions manual.pdf
Douglas C. Montgomery - Design and Analysis of Experiments, solutions manual.pdfDouglas C. Montgomery - Design and Analysis of Experiments, solutions manual.pdf
Douglas C. Montgomery - Design and Analysis of Experiments, solutions manual.pdfLeonardoPassos39
 
Tachometers.pptx
Tachometers.pptxTachometers.pptx
Tachometers.pptxPMTIndustry
 
Mpc 006 - 02-03 partial and multiple correlation
Mpc 006 - 02-03 partial and multiple correlationMpc 006 - 02-03 partial and multiple correlation
Mpc 006 - 02-03 partial and multiple correlationVasant Kothari
 

Similar to Statistical Inference.pdf (20)

AP Statistics - Confidence Intervals with Means - One Sample
AP Statistics - Confidence Intervals with Means - One SampleAP Statistics - Confidence Intervals with Means - One Sample
AP Statistics - Confidence Intervals with Means - One Sample
 
Lecture 03 Inferential Statistics 1
Lecture 03 Inferential Statistics 1Lecture 03 Inferential Statistics 1
Lecture 03 Inferential Statistics 1
 
New Clustering-based Forecasting Method for Disaggregated End-consumer Electr...
New Clustering-based Forecasting Method for Disaggregated End-consumer Electr...New Clustering-based Forecasting Method for Disaggregated End-consumer Electr...
New Clustering-based Forecasting Method for Disaggregated End-consumer Electr...
 
Power_flow..نظم_قدرة.pptx
Power_flow..نظم_قدرة.pptxPower_flow..نظم_قدرة.pptx
Power_flow..نظم_قدرة.pptx
 
Normal distri
Normal distriNormal distri
Normal distri
 
Sampling
SamplingSampling
Sampling
 
scical manual fx-250HC
scical manual fx-250HCscical manual fx-250HC
scical manual fx-250HC
 
Normal distribution
Normal distribution  Normal distribution
Normal distribution
 
Business statistics solved numericals
Business statistics solved numericalsBusiness statistics solved numericals
Business statistics solved numericals
 
Tarea 2 hidraulica iii-cabrera arias roberto alejandro
Tarea 2 hidraulica iii-cabrera arias roberto alejandroTarea 2 hidraulica iii-cabrera arias roberto alejandro
Tarea 2 hidraulica iii-cabrera arias roberto alejandro
 
The sexagesimal foundation of mathematics
The sexagesimal foundation of mathematicsThe sexagesimal foundation of mathematics
The sexagesimal foundation of mathematics
 
Normal distribution - Unitedworld School of Business
Normal distribution - Unitedworld School of BusinessNormal distribution - Unitedworld School of Business
Normal distribution - Unitedworld School of Business
 
Data Analysis.pptx
Data Analysis.pptxData Analysis.pptx
Data Analysis.pptx
 
EJERCICIOS RESUELTOS DE LOGARITMOS
EJERCICIOS RESUELTOS DE LOGARITMOSEJERCICIOS RESUELTOS DE LOGARITMOS
EJERCICIOS RESUELTOS DE LOGARITMOS
 
Mean, median, and mode ug
Mean, median, and mode ugMean, median, and mode ug
Mean, median, and mode ug
 
Regression Analysis , A statistical approch to analysis data.pptx
Regression Analysis , A statistical  approch to analysis data.pptxRegression Analysis , A statistical  approch to analysis data.pptx
Regression Analysis , A statistical approch to analysis data.pptx
 
Introduction to Probability and Statistics 13th Edition Mendenhall Solutions ...
Introduction to Probability and Statistics 13th Edition Mendenhall Solutions ...Introduction to Probability and Statistics 13th Edition Mendenhall Solutions ...
Introduction to Probability and Statistics 13th Edition Mendenhall Solutions ...
 
Douglas C. Montgomery - Design and Analysis of Experiments, solutions manual.pdf
Douglas C. Montgomery - Design and Analysis of Experiments, solutions manual.pdfDouglas C. Montgomery - Design and Analysis of Experiments, solutions manual.pdf
Douglas C. Montgomery - Design and Analysis of Experiments, solutions manual.pdf
 
Tachometers.pptx
Tachometers.pptxTachometers.pptx
Tachometers.pptx
 
Mpc 006 - 02-03 partial and multiple correlation
Mpc 006 - 02-03 partial and multiple correlationMpc 006 - 02-03 partial and multiple correlation
Mpc 006 - 02-03 partial and multiple correlation
 

More from MuhammadFaizan389

Introduction & Classification of Biofuels.pdf
Introduction & Classification of Biofuels.pdfIntroduction & Classification of Biofuels.pdf
Introduction & Classification of Biofuels.pdfMuhammadFaizan389
 
Adsorption Chromatography Assignment.pdf
Adsorption Chromatography Assignment.pdfAdsorption Chromatography Assignment.pdf
Adsorption Chromatography Assignment.pdfMuhammadFaizan389
 
Analytical Page# 36 to 42.pdf
Analytical Page# 36 to 42.pdfAnalytical Page# 36 to 42.pdf
Analytical Page# 36 to 42.pdfMuhammadFaizan389
 
Analytical Page# 50 to 56.pdf
Analytical Page# 50 to 56.pdfAnalytical Page# 50 to 56.pdf
Analytical Page# 50 to 56.pdfMuhammadFaizan389
 
Coulmn & Ion Exchange Chromatography.pdf
Coulmn & Ion Exchange Chromatography.pdfCoulmn & Ion Exchange Chromatography.pdf
Coulmn & Ion Exchange Chromatography.pdfMuhammadFaizan389
 
Detectors used in HPLC, GC & I.E Chromatography.pdf
Detectors used in HPLC, GC & I.E Chromatography.pdfDetectors used in HPLC, GC & I.E Chromatography.pdf
Detectors used in HPLC, GC & I.E Chromatography.pdfMuhammadFaizan389
 
High Performance Liquid Chromatography.pdf
High Performance Liquid Chromatography.pdfHigh Performance Liquid Chromatography.pdf
High Performance Liquid Chromatography.pdfMuhammadFaizan389
 
Introduction to Chromatography.pdf
Introduction to Chromatography.pdfIntroduction to Chromatography.pdf
Introduction to Chromatography.pdfMuhammadFaizan389
 
Theoretical Consideration of Chromatography.pdf
Theoretical Consideration of Chromatography.pdfTheoretical Consideration of Chromatography.pdf
Theoretical Consideration of Chromatography.pdfMuhammadFaizan389
 
Traditional Methods of Alcohol.pdf
Traditional Methods of Alcohol.pdfTraditional Methods of Alcohol.pdf
Traditional Methods of Alcohol.pdfMuhammadFaizan389
 

More from MuhammadFaizan389 (20)

Introduction & Classification of Biofuels.pdf
Introduction & Classification of Biofuels.pdfIntroduction & Classification of Biofuels.pdf
Introduction & Classification of Biofuels.pdf
 
Adsorption Chromatography Assignment.pdf
Adsorption Chromatography Assignment.pdfAdsorption Chromatography Assignment.pdf
Adsorption Chromatography Assignment.pdf
 
Analytical Page# 36 to 42.pdf
Analytical Page# 36 to 42.pdfAnalytical Page# 36 to 42.pdf
Analytical Page# 36 to 42.pdf
 
Analytical Page# 50 to 56.pdf
Analytical Page# 50 to 56.pdfAnalytical Page# 50 to 56.pdf
Analytical Page# 50 to 56.pdf
 
Coulmn & Ion Exchange Chromatography.pdf
Coulmn & Ion Exchange Chromatography.pdfCoulmn & Ion Exchange Chromatography.pdf
Coulmn & Ion Exchange Chromatography.pdf
 
Detectors used in HPLC, GC & I.E Chromatography.pdf
Detectors used in HPLC, GC & I.E Chromatography.pdfDetectors used in HPLC, GC & I.E Chromatography.pdf
Detectors used in HPLC, GC & I.E Chromatography.pdf
 
Gas Chromatography.pptx
Gas Chromatography.pptxGas Chromatography.pptx
Gas Chromatography.pptx
 
Gas Chromatogrpahy.pdf
Gas Chromatogrpahy.pdfGas Chromatogrpahy.pdf
Gas Chromatogrpahy.pdf
 
High Performance Liquid Chromatography.pdf
High Performance Liquid Chromatography.pdfHigh Performance Liquid Chromatography.pdf
High Performance Liquid Chromatography.pdf
 
Introduction to Chromatography.pdf
Introduction to Chromatography.pdfIntroduction to Chromatography.pdf
Introduction to Chromatography.pdf
 
Ion Chromatography.pptx
Ion Chromatography.pptxIon Chromatography.pptx
Ion Chromatography.pptx
 
Theoretical Consideration of Chromatography.pdf
Theoretical Consideration of Chromatography.pdfTheoretical Consideration of Chromatography.pdf
Theoretical Consideration of Chromatography.pdf
 
Traditional Methods of Alcohol.pdf
Traditional Methods of Alcohol.pdfTraditional Methods of Alcohol.pdf
Traditional Methods of Alcohol.pdf
 
Syngas.pdf
Syngas.pdfSyngas.pdf
Syngas.pdf
 
Photovoltaic Cells.pptx
Photovoltaic Cells.pptxPhotovoltaic Cells.pptx
Photovoltaic Cells.pptx
 
Hydroelectric Power.pptx
Hydroelectric Power.pptxHydroelectric Power.pptx
Hydroelectric Power.pptx
 
Fuel Cells.pptx
Fuel Cells.pptxFuel Cells.pptx
Fuel Cells.pptx
 
Fuel Cell.pdf
Fuel Cell.pdfFuel Cell.pdf
Fuel Cell.pdf
 
BioReactor.pptx
BioReactor.pptxBioReactor.pptx
BioReactor.pptx
 
Biomass.ppt
Biomass.pptBiomass.ppt
Biomass.ppt
 

Recently uploaded

High Class Call Girls Nagpur Grishma Call 7001035870 Meet With Nagpur Escorts
High Class Call Girls Nagpur Grishma Call 7001035870 Meet With Nagpur EscortsHigh Class Call Girls Nagpur Grishma Call 7001035870 Meet With Nagpur Escorts
High Class Call Girls Nagpur Grishma Call 7001035870 Meet With Nagpur Escortsranjana rawat
 
SBP-Market-Operations and market managment
SBP-Market-Operations and market managmentSBP-Market-Operations and market managment
SBP-Market-Operations and market managmentfactical
 
Log your LOA pain with Pension Lab's brilliant campaign
Log your LOA pain with Pension Lab's brilliant campaignLog your LOA pain with Pension Lab's brilliant campaign
Log your LOA pain with Pension Lab's brilliant campaignHenry Tapper
 
fca-bsps-decision-letter-redacted (1).pdf
fca-bsps-decision-letter-redacted (1).pdffca-bsps-decision-letter-redacted (1).pdf
fca-bsps-decision-letter-redacted (1).pdfHenry Tapper
 
Malad Call Girl in Services 9892124323 | ₹,4500 With Room Free Delivery
Malad Call Girl in Services  9892124323 | ₹,4500 With Room Free DeliveryMalad Call Girl in Services  9892124323 | ₹,4500 With Room Free Delivery
Malad Call Girl in Services 9892124323 | ₹,4500 With Room Free DeliveryPooja Nehwal
 
High Class Call Girls Nashik Maya 7001305949 Independent Escort Service Nashik
High Class Call Girls Nashik Maya 7001305949 Independent Escort Service NashikHigh Class Call Girls Nashik Maya 7001305949 Independent Escort Service Nashik
High Class Call Girls Nashik Maya 7001305949 Independent Escort Service NashikCall Girls in Nagpur High Profile
 
Authentic No 1 Amil Baba In Pakistan Authentic No 1 Amil Baba In Karachi No 1...
Authentic No 1 Amil Baba In Pakistan Authentic No 1 Amil Baba In Karachi No 1...Authentic No 1 Amil Baba In Pakistan Authentic No 1 Amil Baba In Karachi No 1...
Authentic No 1 Amil Baba In Pakistan Authentic No 1 Amil Baba In Karachi No 1...First NO1 World Amil baba in Faisalabad
 
Andheri Call Girls In 9825968104 Mumbai Hot Models
Andheri Call Girls In 9825968104 Mumbai Hot ModelsAndheri Call Girls In 9825968104 Mumbai Hot Models
Andheri Call Girls In 9825968104 Mumbai Hot Modelshematsharma006
 
VIP Kolkata Call Girl Jodhpur Park 👉 8250192130 Available With Room
VIP Kolkata Call Girl Jodhpur Park 👉 8250192130  Available With RoomVIP Kolkata Call Girl Jodhpur Park 👉 8250192130  Available With Room
VIP Kolkata Call Girl Jodhpur Park 👉 8250192130 Available With Roomdivyansh0kumar0
 
Financial institutions facilitate financing, economic transactions, issue fun...
Financial institutions facilitate financing, economic transactions, issue fun...Financial institutions facilitate financing, economic transactions, issue fun...
Financial institutions facilitate financing, economic transactions, issue fun...Avanish Goel
 
government_intervention_in_business_ownership[1].pdf
government_intervention_in_business_ownership[1].pdfgovernment_intervention_in_business_ownership[1].pdf
government_intervention_in_business_ownership[1].pdfshaunmashale756
 
Bladex Earnings Call Presentation 1Q2024
Bladex Earnings Call Presentation 1Q2024Bladex Earnings Call Presentation 1Q2024
Bladex Earnings Call Presentation 1Q2024Bladex
 
VIP Call Girls LB Nagar ( Hyderabad ) Phone 8250192130 | ₹5k To 25k With Room...
VIP Call Girls LB Nagar ( Hyderabad ) Phone 8250192130 | ₹5k To 25k With Room...VIP Call Girls LB Nagar ( Hyderabad ) Phone 8250192130 | ₹5k To 25k With Room...
VIP Call Girls LB Nagar ( Hyderabad ) Phone 8250192130 | ₹5k To 25k With Room...Suhani Kapoor
 
Call Girls In Yusuf Sarai Women Seeking Men 9654467111
Call Girls In Yusuf Sarai Women Seeking Men 9654467111Call Girls In Yusuf Sarai Women Seeking Men 9654467111
Call Girls In Yusuf Sarai Women Seeking Men 9654467111Sapana Sha
 
Stock Market Brief Deck for 4/24/24 .pdf
Stock Market Brief Deck for 4/24/24 .pdfStock Market Brief Deck for 4/24/24 .pdf
Stock Market Brief Deck for 4/24/24 .pdfMichael Silva
 
Instant Issue Debit Cards - High School Spirit
Instant Issue Debit Cards - High School SpiritInstant Issue Debit Cards - High School Spirit
Instant Issue Debit Cards - High School Spiritegoetzinger
 
letter-from-the-chair-to-the-fca-relating-to-british-steel-pensions-scheme-15...
letter-from-the-chair-to-the-fca-relating-to-british-steel-pensions-scheme-15...letter-from-the-chair-to-the-fca-relating-to-british-steel-pensions-scheme-15...
letter-from-the-chair-to-the-fca-relating-to-british-steel-pensions-scheme-15...Henry Tapper
 
Monthly Market Risk Update: April 2024 [SlideShare]
Monthly Market Risk Update: April 2024 [SlideShare]Monthly Market Risk Update: April 2024 [SlideShare]
Monthly Market Risk Update: April 2024 [SlideShare]Commonwealth
 
OAT_RI_Ep19 WeighingTheRisks_Apr24_TheYellowMetal.pptx
OAT_RI_Ep19 WeighingTheRisks_Apr24_TheYellowMetal.pptxOAT_RI_Ep19 WeighingTheRisks_Apr24_TheYellowMetal.pptx
OAT_RI_Ep19 WeighingTheRisks_Apr24_TheYellowMetal.pptxhiddenlevers
 

Recently uploaded (20)

High Class Call Girls Nagpur Grishma Call 7001035870 Meet With Nagpur Escorts
High Class Call Girls Nagpur Grishma Call 7001035870 Meet With Nagpur EscortsHigh Class Call Girls Nagpur Grishma Call 7001035870 Meet With Nagpur Escorts
High Class Call Girls Nagpur Grishma Call 7001035870 Meet With Nagpur Escorts
 
SBP-Market-Operations and market managment
SBP-Market-Operations and market managmentSBP-Market-Operations and market managment
SBP-Market-Operations and market managment
 
Log your LOA pain with Pension Lab's brilliant campaign
Log your LOA pain with Pension Lab's brilliant campaignLog your LOA pain with Pension Lab's brilliant campaign
Log your LOA pain with Pension Lab's brilliant campaign
 
fca-bsps-decision-letter-redacted (1).pdf
fca-bsps-decision-letter-redacted (1).pdffca-bsps-decision-letter-redacted (1).pdf
fca-bsps-decision-letter-redacted (1).pdf
 
Malad Call Girl in Services 9892124323 | ₹,4500 With Room Free Delivery
Malad Call Girl in Services  9892124323 | ₹,4500 With Room Free DeliveryMalad Call Girl in Services  9892124323 | ₹,4500 With Room Free Delivery
Malad Call Girl in Services 9892124323 | ₹,4500 With Room Free Delivery
 
High Class Call Girls Nashik Maya 7001305949 Independent Escort Service Nashik
High Class Call Girls Nashik Maya 7001305949 Independent Escort Service NashikHigh Class Call Girls Nashik Maya 7001305949 Independent Escort Service Nashik
High Class Call Girls Nashik Maya 7001305949 Independent Escort Service Nashik
 
Authentic No 1 Amil Baba In Pakistan Authentic No 1 Amil Baba In Karachi No 1...
Authentic No 1 Amil Baba In Pakistan Authentic No 1 Amil Baba In Karachi No 1...Authentic No 1 Amil Baba In Pakistan Authentic No 1 Amil Baba In Karachi No 1...
Authentic No 1 Amil Baba In Pakistan Authentic No 1 Amil Baba In Karachi No 1...
 
Andheri Call Girls In 9825968104 Mumbai Hot Models
Andheri Call Girls In 9825968104 Mumbai Hot ModelsAndheri Call Girls In 9825968104 Mumbai Hot Models
Andheri Call Girls In 9825968104 Mumbai Hot Models
 
Commercial Bank Economic Capsule - April 2024
Commercial Bank Economic Capsule - April 2024Commercial Bank Economic Capsule - April 2024
Commercial Bank Economic Capsule - April 2024
 
VIP Kolkata Call Girl Jodhpur Park 👉 8250192130 Available With Room
VIP Kolkata Call Girl Jodhpur Park 👉 8250192130  Available With RoomVIP Kolkata Call Girl Jodhpur Park 👉 8250192130  Available With Room
VIP Kolkata Call Girl Jodhpur Park 👉 8250192130 Available With Room
 
Financial institutions facilitate financing, economic transactions, issue fun...
Financial institutions facilitate financing, economic transactions, issue fun...Financial institutions facilitate financing, economic transactions, issue fun...
Financial institutions facilitate financing, economic transactions, issue fun...
 
government_intervention_in_business_ownership[1].pdf
government_intervention_in_business_ownership[1].pdfgovernment_intervention_in_business_ownership[1].pdf
government_intervention_in_business_ownership[1].pdf
 
Bladex Earnings Call Presentation 1Q2024
Bladex Earnings Call Presentation 1Q2024Bladex Earnings Call Presentation 1Q2024
Bladex Earnings Call Presentation 1Q2024
 
VIP Call Girls LB Nagar ( Hyderabad ) Phone 8250192130 | ₹5k To 25k With Room...
VIP Call Girls LB Nagar ( Hyderabad ) Phone 8250192130 | ₹5k To 25k With Room...VIP Call Girls LB Nagar ( Hyderabad ) Phone 8250192130 | ₹5k To 25k With Room...
VIP Call Girls LB Nagar ( Hyderabad ) Phone 8250192130 | ₹5k To 25k With Room...
 
Call Girls In Yusuf Sarai Women Seeking Men 9654467111
Call Girls In Yusuf Sarai Women Seeking Men 9654467111Call Girls In Yusuf Sarai Women Seeking Men 9654467111
Call Girls In Yusuf Sarai Women Seeking Men 9654467111
 
Stock Market Brief Deck for 4/24/24 .pdf
Stock Market Brief Deck for 4/24/24 .pdfStock Market Brief Deck for 4/24/24 .pdf
Stock Market Brief Deck for 4/24/24 .pdf
 
Instant Issue Debit Cards - High School Spirit
Instant Issue Debit Cards - High School SpiritInstant Issue Debit Cards - High School Spirit
Instant Issue Debit Cards - High School Spirit
 
letter-from-the-chair-to-the-fca-relating-to-british-steel-pensions-scheme-15...
letter-from-the-chair-to-the-fca-relating-to-british-steel-pensions-scheme-15...letter-from-the-chair-to-the-fca-relating-to-british-steel-pensions-scheme-15...
letter-from-the-chair-to-the-fca-relating-to-british-steel-pensions-scheme-15...
 
Monthly Market Risk Update: April 2024 [SlideShare]
Monthly Market Risk Update: April 2024 [SlideShare]Monthly Market Risk Update: April 2024 [SlideShare]
Monthly Market Risk Update: April 2024 [SlideShare]
 
OAT_RI_Ep19 WeighingTheRisks_Apr24_TheYellowMetal.pptx
OAT_RI_Ep19 WeighingTheRisks_Apr24_TheYellowMetal.pptxOAT_RI_Ep19 WeighingTheRisks_Apr24_TheYellowMetal.pptx
OAT_RI_Ep19 WeighingTheRisks_Apr24_TheYellowMetal.pptx
 

Statistical Inference.pdf

  • 1. • Statistical inference is the process of reaching conclusions about characteristics of an entire population using data from a subset, or sample, of that Population. • The process of making guesses about the truth about a population parameter from a sample statistic. • To Draw the conclusion about the population parameter by using sample information. • Parameter ? u • Statistic ? X-bar , s, regression coefficient STATISTICAL INFERENCE
  • 2. STATISTICAL INFERENCE Divided into two branches Estimation of parameters Testing of hypothesis
  • 3. Problem 1st: C.I for single mean • The masses, in grams, of thirteen ball bearings taken at random from a batch are • Calculate a 95% C.I for the mean mass of the population. Solution: Mean= σ 𝒙 𝒏 = 𝟑𝟏𝟒.𝟕 𝟏𝟑 = 𝟐𝟒. 𝟐𝟏 𝒔 = σ(𝑥𝑖 − ഥ 𝒙)𝟐 𝒏 − 𝟏 = 𝟑. 𝟏𝟐 = 𝟏. 𝟕𝟕 , 𝒗 = 𝒏 − 𝟏 = 𝟏𝟑 − 𝟏 = 𝟏𝟐 21.4 23.1 25.9 23.4 24.5 25.0 25.0 22.5 26.9 26.4 25.8 23.2 21.9
  • 4. • ഥ 𝑥 ±𝑡𝜕/2v 𝑠 𝑛 • Alpha =1- level of confidence • Alpha=1-0.95=0.05 • V=n-1= 13-1=12 𝟐𝟒. 𝟐𝟏 ± 𝒕𝟎.𝟎𝟓 𝟐 𝒗 𝟏. 𝟕𝟕 𝟏𝟑 𝒕𝟎.𝟎𝟐𝟓 𝟏𝟐 = 𝟐. 𝟏𝟕𝟗 → (From the t-table) 𝟐𝟒. 𝟐𝟏 ± 𝟐. 𝟏𝟕𝟗 𝟏. 𝟕𝟕 𝟏𝟑 24.21+2.179(0.49)=25.28 Upper-limit 24.21-2.179(0.49)=23.14 Lower-limit At 95% Confidence interval
  • 5. PERCENTAGE POINT OF STUDENT'S t-DISTRIBUTION Alpha d.f. 0.250 0.100 0.050 0.025 0.0125 0.005 1 1.000 3.078 6.314 12.706 31.821 63.657 2 0.816 1.886 2.920 4.303 6.965 9.925 3 0.765 1.638 2.353 3.182 4.541 5.841 4 0.741 1.533 2.132 2.776 3.747 4.604 5 0.727 1.476 2.015 2.571 3.365 4.032 6 0.718 1.440 1.943 2.447 3.143 3.707 7 0.711 1.415 1.895 2.365 2.998 3.499 8 0.706 1.397 1.860 2.306 2.896 3.355 9 0.703 1.383 1.833 2.262 2.821 3.250 10 0.700 1.372 1.812 2.228 2.764 3.169 11 0.697 1.363 1.796 2.201 2.718 3.106 12 0.695 1.356 1.782 2.179 2.681 3.055 13 0.694 1.350 1.771 2.160 2.650 3.012 14 0.692 1.345 1.761 2.145 2.624 2.977 15 0.691 1.341 1.753 2.131 2.602 2.947 16 0.690 1.337 1.746 2.120 2.583 2.921 17 0.689 1.333 1.740 2.110 2.567 2.898 18 0.688 1.330 1.734 2.101 2.552 2.878 19 0.688 1.328 1.729 2.093 2.539 2.861 20 0.687 1.325 1.725 2.086 2.528 2.845 21 0.686 1.323 1.721 2.080 2.518 2.831 22 0.686 1.321 1.717 2.074 2.508 2.819 23 0.685 1.319 1.714 2.069 2.500 2.807 24 0.685 1.318 1.711 2.064 2.492 2.797 25 0.684 1.316 1.708 2.060 2.485 2.787 26 0.684 1.315 1.706 2.056 2.479 2.779 27 0.684 1.314 1.703 2.052 2.473 2.771 28 0.683 1.313 1.701 2.048 2.467 2.763 29 0.683 1.311 1.699 2.045 2.462 2.756 30 0.683 1.310 1.697 2.042 2.457 2.750 40 0.681 1.303 1.684 2.021 2.423 2.704 60 0.679 1.296 1.671 2.000 2.390 2.660 120 0.677 1.289 1.658 1.980 2.358 2.617
  • 6. • Confidence interval for single mean • From t-distribution • when sample information n≤ 30 • From Z-distribution • when sample information n > 30
  • 7. Confidence interval estimate of mean In case of two samples : • ( ҧ 𝑥1 − ҧ 𝑥2) ± 𝑡𝛼 2 , 𝑣 𝑠𝑝 1 𝑛1 + 1 𝑛2 • ҧ 𝑥1 =mean of 1st sample • ҧ 𝑥2 =mean of 2nd sample • 𝛼 2 = 𝑠𝑎𝑚𝑒 𝑎𝑠 𝑖𝑛 𝑠𝑖𝑛𝑔𝑙𝑒 𝑚𝑒𝑎𝑛 𝑐𝑎𝑠𝑒 • V=1st sample number of observation +2nd sample number of observation - 2 • 𝑠𝑝= pooled standard-deviation
  • 8. For two random sample: • 𝑆𝑝 2 = 1 𝑛1+𝑛2−2 σ𝑖 𝑛1 𝑥1𝑖 − ҧ 𝑥1 2 + σ𝑗 𝑛2 𝑥2𝑗 − ҧ 𝑥2 2 • 𝑠𝑝= 𝑆𝑝 2 • 𝑠𝑝= 1 𝑛1+𝑛2−2 σ𝑖 𝑛1 𝑥1𝑖 − ҧ 𝑥1 2 + σ𝑗 𝑛2 𝑥2𝑗 − ҧ 𝑥1 2 V=𝑛1 + 𝑛2 − 2
  • 9. Problem 2nd: • Given that • ҧ 𝑥1 = 75, 𝑛1 = 9, σ 𝑥1𝑖 − ҧ 𝑥1 2 = 1482; • ҧ 𝑥2 = 60, 𝑛2 = 16, σ 𝑥2𝑗 − ҧ 𝑥2 2 = 1830; And assuming that the two samples were randomly selected from population in which equal variance, calculate CI for 80%
  • 10. • Solution: • 𝑠𝑝= 1 𝑛1+𝑛2−2 σ𝑖 𝑛1 𝑥1𝑖 − ҧ 𝑥1 2 + σ𝑗 𝑛2 𝑥2𝑗 − ҧ 𝑥1 2 • 𝑠𝑝 = 1 9+16−2 1482 + 1830 = 144 = 12 • V=𝑛1 + 𝑛2 − 2 • V=9+16-2=23 • Alpha=1-0.80 = 0.20 • 𝛼 2 = 0.20 2 =0.10 • 𝑡0.10 23 → 𝑓𝑟𝑜𝑚 𝑡ℎ𝑒 𝑡 𝑡𝑎𝑏𝑙𝑒 = 1.32 • ҧ 𝑥1 − ҧ 𝑥2=75-60=15
  • 11. • Substituting these values, we obtain: • ( ҧ 𝑥1 − ҧ 𝑥2) ± 𝑡𝛼 2 , 𝑣 𝑠𝑝 1 𝑛1 + 1 𝑛2 15±(1.32)(12) 1 9 + 1 16 15±15.84*(0.4167) 15+15.84*0.4167=21.60 Upper limit 15-15.84*0.4167=8.3994 Lower Limit (8.3994 , 21.60)
  • 12. Assignment : Consider the data: Find Confidence interval for two mean in case of 80% and for 95% 1st sample x1 10 14 16 8 15 17 19 21 13 2nd sample X2 12 13 19 15 8 15 16 18 8
  • 13. • Solution: • 𝑠𝑝 = 232.18 = 15.237 • V=𝑛1 + 𝑛2 − 2 • V=9+9-2 • Alpha=1-0.95 = 0.05 • 𝛼 2 = 0.050 2 =0.025 • 𝑡0.025 16 → 𝑓𝑟𝑜𝑚 𝑡ℎ𝑒 𝑡 𝑡𝑎𝑏𝑙𝑒 =2.120 • ( ҧ 𝑥1 − ҧ 𝑥2) ± 𝑡𝛼 2 , 𝑣 𝑠𝑝 1 𝑛1 + 1 𝑛2 • 9 ± 2.120(15.237*0.4711) • 9 ± 9.597187 • 9+ 9.597187 for upper limit 18.59719 • 9-9.597187 for lower limit -0.5971875