Some examples of Pi chart, histogram, bar graph, line graph for scientific data
•Download as PPTX, PDF•
0 likes•59 views

pi chart, bar graph, histogram, bar graph, line graph
Report
Share
Report
Share

Recommended
Recommended
More Related Content
Recently uploaded
Recently uploaded (20)
Pests of mustard_Identification_Management_Dr.UPR.pdf
Pests of mustard_Identification_Management_Dr.UPR.pdf
Kochi ❤CALL GIRL 84099*07087 ❤CALL GIRLS IN Kochi ESCORT SERVICE❤CALL GIRL
Kochi ❤CALL GIRL 84099*07087 ❤CALL GIRLS IN Kochi ESCORT SERVICE❤CALL GIRL
dkNET Webinar "Texera: A Scalable Cloud Computing Platform for Sharing Data a...
dkNET Webinar "Texera: A Scalable Cloud Computing Platform for Sharing Data a...
pumpkin fruit fly, water melon fruit fly, cucumber fruit fly
pumpkin fruit fly, water melon fruit fly, cucumber fruit fly
COMPUTING ANTI-DERIVATIVES
(Integration by SUBSTITUTION)
COMPUTING ANTI-DERIVATIVES
(Integration by SUBSTITUTION)
Pulmonary drug delivery system M.pharm -2nd sem P'ceutics
Pulmonary drug delivery system M.pharm -2nd sem P'ceutics
SAMASTIPUR CALL GIRL 7857803690 LOW PRICE ESCORT SERVICE
SAMASTIPUR CALL GIRL 7857803690 LOW PRICE ESCORT SERVICE
Chemical Tests; flame test, positive and negative ions test Edexcel Internati...
Chemical Tests; flame test, positive and negative ions test Edexcel Internati...
FAIRSpectra - Enabling the FAIRification of Spectroscopy and Spectrometry
FAIRSpectra - Enabling the FAIRification of Spectroscopy and Spectrometry
9654467111 Call Girls In Raj Nagar Delhi Short 1500 Night 6000
9654467111 Call Girls In Raj Nagar Delhi Short 1500 Night 6000
Forensic Biology & Its biological significance.pdf
Forensic Biology & Its biological significance.pdf
Asymmetry in the atmosphere of the ultra-hot Jupiter WASP-76 b
Asymmetry in the atmosphere of the ultra-hot Jupiter WASP-76 b
Featured
More than Just Lines on a Map: Best Practices for U.S Bike Routes
This session highlights best practices and lessons learned for U.S. Bike Route System designation, as well as how and why these routes should be integrated into bicycle planning at the local and regional level.
Presenters:
Presenter: Kevin Luecke Toole Design Group
Co-Presenter: Virginia Sullivan Adventure Cycling AssociationMore than Just Lines on a Map: Best Practices for U.S Bike Routes
More than Just Lines on a Map: Best Practices for U.S Bike RoutesProject for Public Spaces & National Center for Biking and Walking
Featured (20)
Content Methodology: A Best Practices Report (Webinar)
Content Methodology: A Best Practices Report (Webinar)
How to Prepare For a Successful Job Search for 2024
How to Prepare For a Successful Job Search for 2024
Social Media Marketing Trends 2024 // The Global Indie Insights
Social Media Marketing Trends 2024 // The Global Indie Insights
Trends In Paid Search: Navigating The Digital Landscape In 2024
Trends In Paid Search: Navigating The Digital Landscape In 2024
5 Public speaking tips from TED - Visualized summary
5 Public speaking tips from TED - Visualized summary
Google's Just Not That Into You: Understanding Core Updates & Search Intent
Google's Just Not That Into You: Understanding Core Updates & Search Intent
The six step guide to practical project management
The six step guide to practical project management
Beginners Guide to TikTok for Search - Rachel Pearson - We are Tilt __ Bright...
Beginners Guide to TikTok for Search - Rachel Pearson - We are Tilt __ Bright...
Unlocking the Power of ChatGPT and AI in Testing - A Real-World Look, present...
Unlocking the Power of ChatGPT and AI in Testing - A Real-World Look, present...
More than Just Lines on a Map: Best Practices for U.S Bike Routes
More than Just Lines on a Map: Best Practices for U.S Bike Routes
Ride the Storm: Navigating Through Unstable Periods / Katerina Rudko (Belka G...
Ride the Storm: Navigating Through Unstable Periods / Katerina Rudko (Belka G...
Some examples of Pi chart, histogram, bar graph, line graph for scientific data
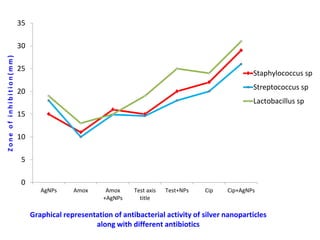
- 1. 0 5 10 15 20 25 30 35 AgNPs Amox Amox +AgNPs Test axis title Test+NPs Cip Cip+AgNPs Staphylococcus sp Streptococcus sp Lactobacillus sp Graphical representation of antibacterial activity of silver nanoparticles along with different antibiotics Z o n e o f i n h i b i t i o n ( m m )
- 2. Health and fitnes Cleaning Food House_hold equipment Medicine Electronic devices Toys Others Applications of Nanoparticles
- 3. petrolium 31% natural gas 22% nuclear 7% coal 17% Renewable energy 25% Solar 2% Geothermal 2% Waste 5% Wind 13% Biofeul 21% Wood 22% Distribution of Useable Energy Sources in Nature Hydroelectric Power 35%
- 4. 0 5 10 15 20 25 30 35 AgNPs Amox Amox +AgNPs Test axis title Test+NPs Cip Cip+AgNPs Staphylococcus sp Streptococcus sp Lactobacillus sp Graphical representation of antibacterial activity of silver nanoparticles along with different antibiotics Z o n e o f i n h i b i t i o n ( m m )
- 5. 0 5 10 15 20 25 30 35 40 45 Broccoli Maize Temperature (C) G r o w t h R e s p o n s e Fig. Temperature response for maize and broccoli plants showing upper, lower and Optimum temperature limits for the vegetative growth phase.
- 6. Health and fitnes Cleaning Food House_hold equipment Medicine Electronic devices Toys Others Applications of Nanoparticles
- 7. 0 2 4 6 8 10 12 14 16 E.coli K.pneumonia P.aeruginosa Proteus ssp AgNP (1) AgNP (2) AgNP (3) AgNO3 Diameter of inhibition zone (mm) B acterial s p ecies