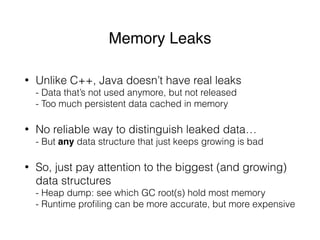
The document discusses memory analysis in Java applications, highlighting common sources of memory waste, such as inefficient data structures, data duplication, and memory leaks. It outlines techniques to optimize memory usage, including the use of efficient collections, de-duplication of strings, and avoiding the creation of small objects. Additionally, it introduces the Jxray tool for analyzing heap dumps to identify memory issues and provides case studies demonstrating memory optimization techniques in various applications.

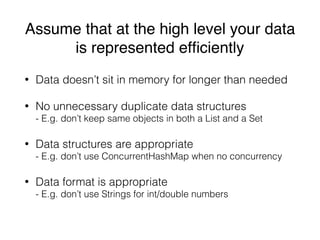
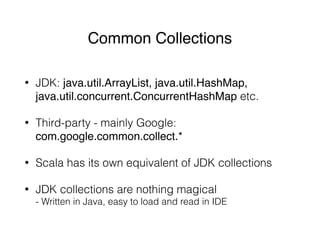
![Summary: small objects are bad
• A small object’s overhead is up to 400% of its
workload
• There are apps with up to 40% of the heap wasted
due to this
• See if you can change your code to “consolidate”
objects or put their contents into flat arrays
• Avoid heap size > 32G! (really ~30G)
- Unless your data is mostly int[], byte[] etc.](https://image.slidesharecdn.com/java-mem-analysis-publicslideshare-170502195101/85/Java-Memory-Analysis-Problems-and-Solutions-7-320.jpg)
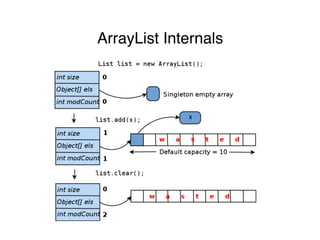
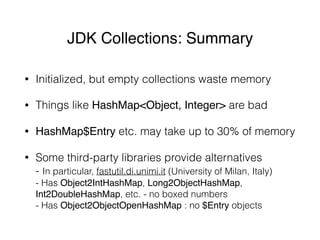
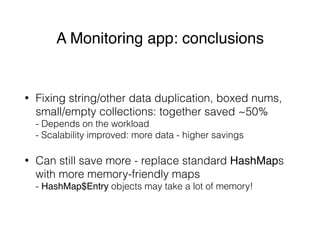
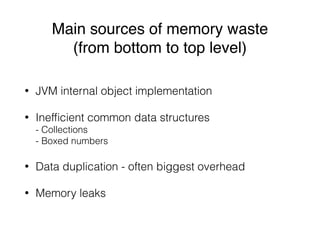
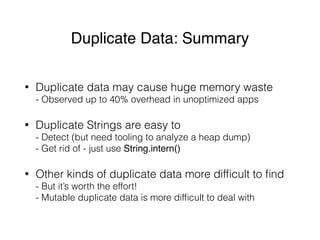
![Data Duplication
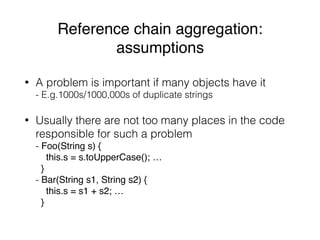
• Can happen for many reasons:
- s = s1 + s2 or s = s.toUpperCase() etc. always
generates a new String object
- intObj = new Integer(intScalar) always generates
a new Integer object
- Duplicate byte[] buffers in I/O, serialization, etc.
• Very hard to detect without tooling
- Small amount of duplication is inevitable
- 20-40% waste is not uncommon in unoptimized apps
• Duplicate Strings are most common and easy to fix](https://image.slidesharecdn.com/java-mem-analysis-publicslideshare-170502195101/85/Java-Memory-Analysis-Problems-and-Solutions-14-320.jpg)
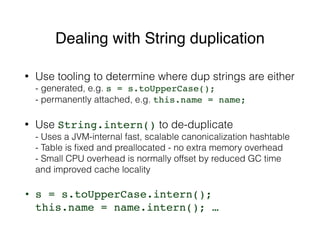
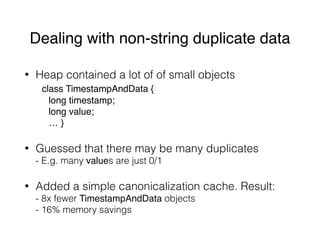
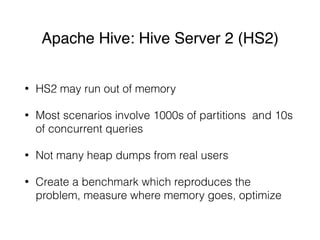
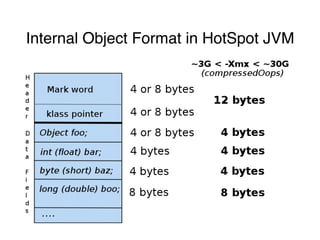
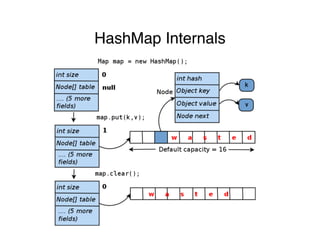
![Other duplicate data
• Can be almost anything. Examples:
- Timestamp objects
- Partitions (with HashMaps and ArrayLists) in Apache Hive
- Various byte[], char[] etc. data buffers everywhere
• So far convenient tooling so far for automatic
detection of arbitrary duplicate objects
• But one can often guess correctly
- Just look at classes that take most memory…](https://image.slidesharecdn.com/java-mem-analysis-publicslideshare-170502195101/85/Java-Memory-Analysis-Problems-and-Solutions-16-320.jpg)
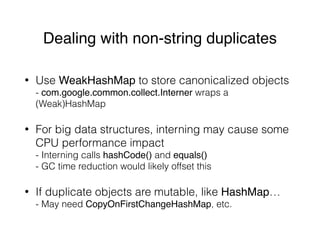
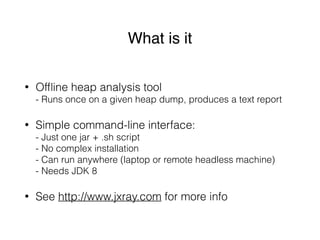
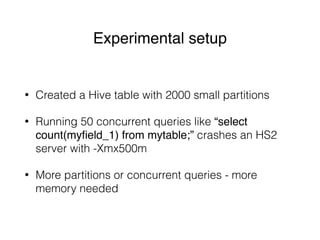
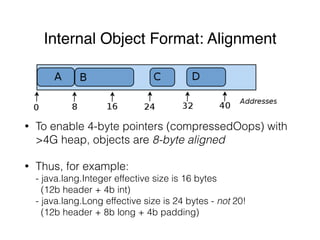
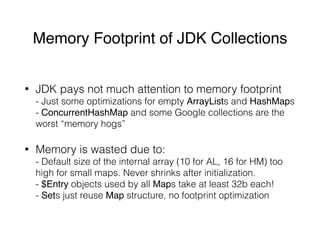
![JXRay: main features
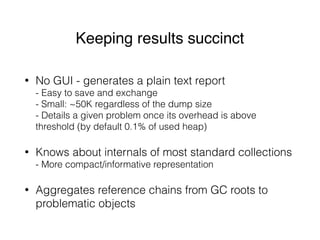
• Shows you what occupies the heap
- Object histogram: which objects take most memory
- Reference chains: which GC roots/data structures keep
biggest object “lumps” in memory
• Shows you where memory is wasted
- Object headers
- Duplicate Strings
- Bad collections (empty; 1-element; small (2-4 element))
- Bad object arrays (empty (all nulls); length 0 or 1; 1-element)
- Boxed numbers
- Duplicate primitive arrays (e.g. byte[] buffers)](https://image.slidesharecdn.com/java-mem-analysis-publicslideshare-170502195101/85/Java-Memory-Analysis-Problems-and-Solutions-22-320.jpg)
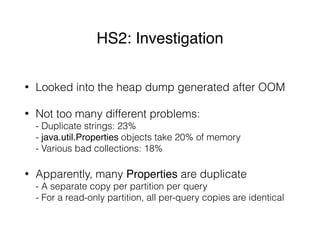
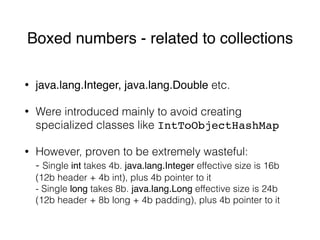
![Treating collections specially
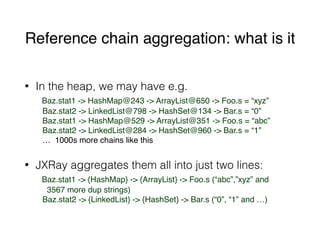
• Object histogram: standard vs JXRay view
HashMap$Entry 21500 objs 430K
HashMap$Entry[] 3200 objs 180K
HashMap 3200 objs 150K
vs
{HashMap} 3200 objs 760K
• Reference chains:
Foo <- HashMap$Entry.value <- HashMap$Entry[] <-
<- HashMap <- Object[] <- ArrayList <- rootX
vs
Foo <- {HashMap.values} <- {ArrayList} <- rootX](https://image.slidesharecdn.com/java-mem-analysis-publicslideshare-170502195101/85/Java-Memory-Analysis-Problems-and-Solutions-26-320.jpg)
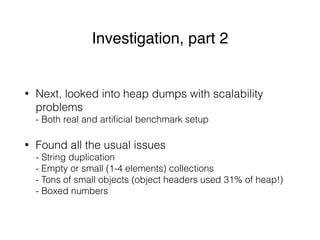
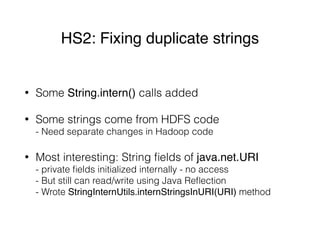
![Investigation, part 1
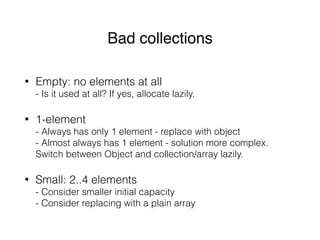
• Started with the smaller dumps with OOMs
- Immediately found duplicate strings
- One string repeated 1000s times used 90% of the heap
- Long SQL query saved in DB many times, then retrieved
- Adding two String.intern() calls solved the problem.. almost
• Duplicate byte[] buffers in a 3rd-party library code
- That still caused noticeable overhead
- Ended up limiting saved query size at high level
- Library/auto-gen code may be difficult to change…](https://image.slidesharecdn.com/java-mem-analysis-publicslideshare-170502195101/85/Java-Memory-Analysis-Problems-and-Solutions-31-320.jpg)