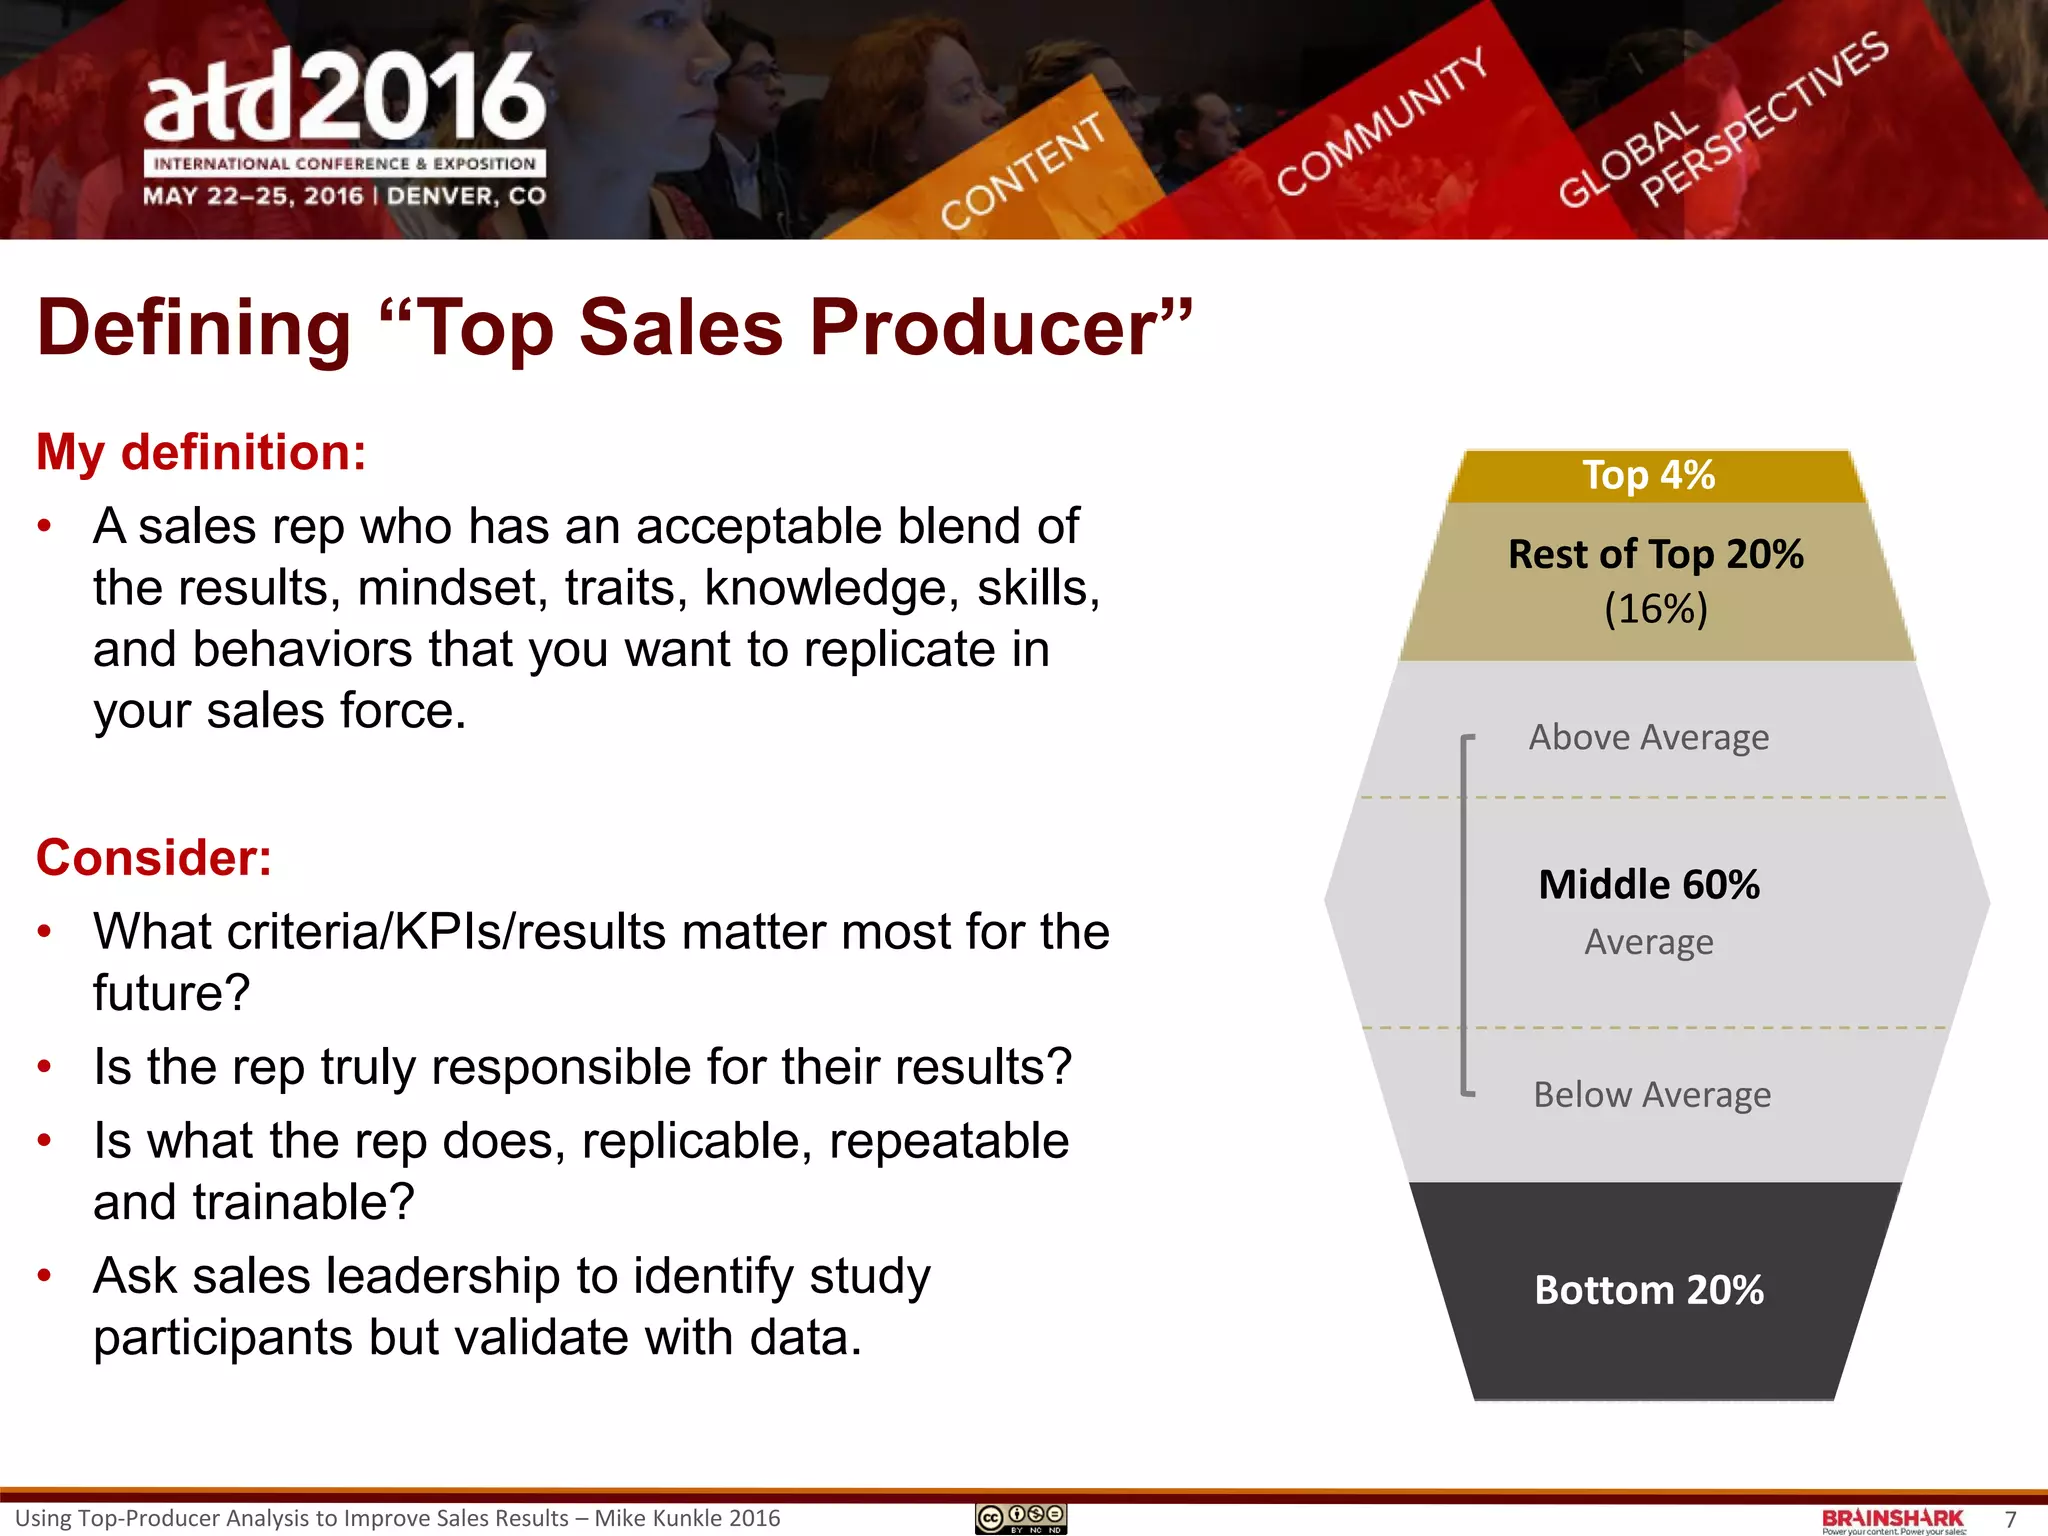
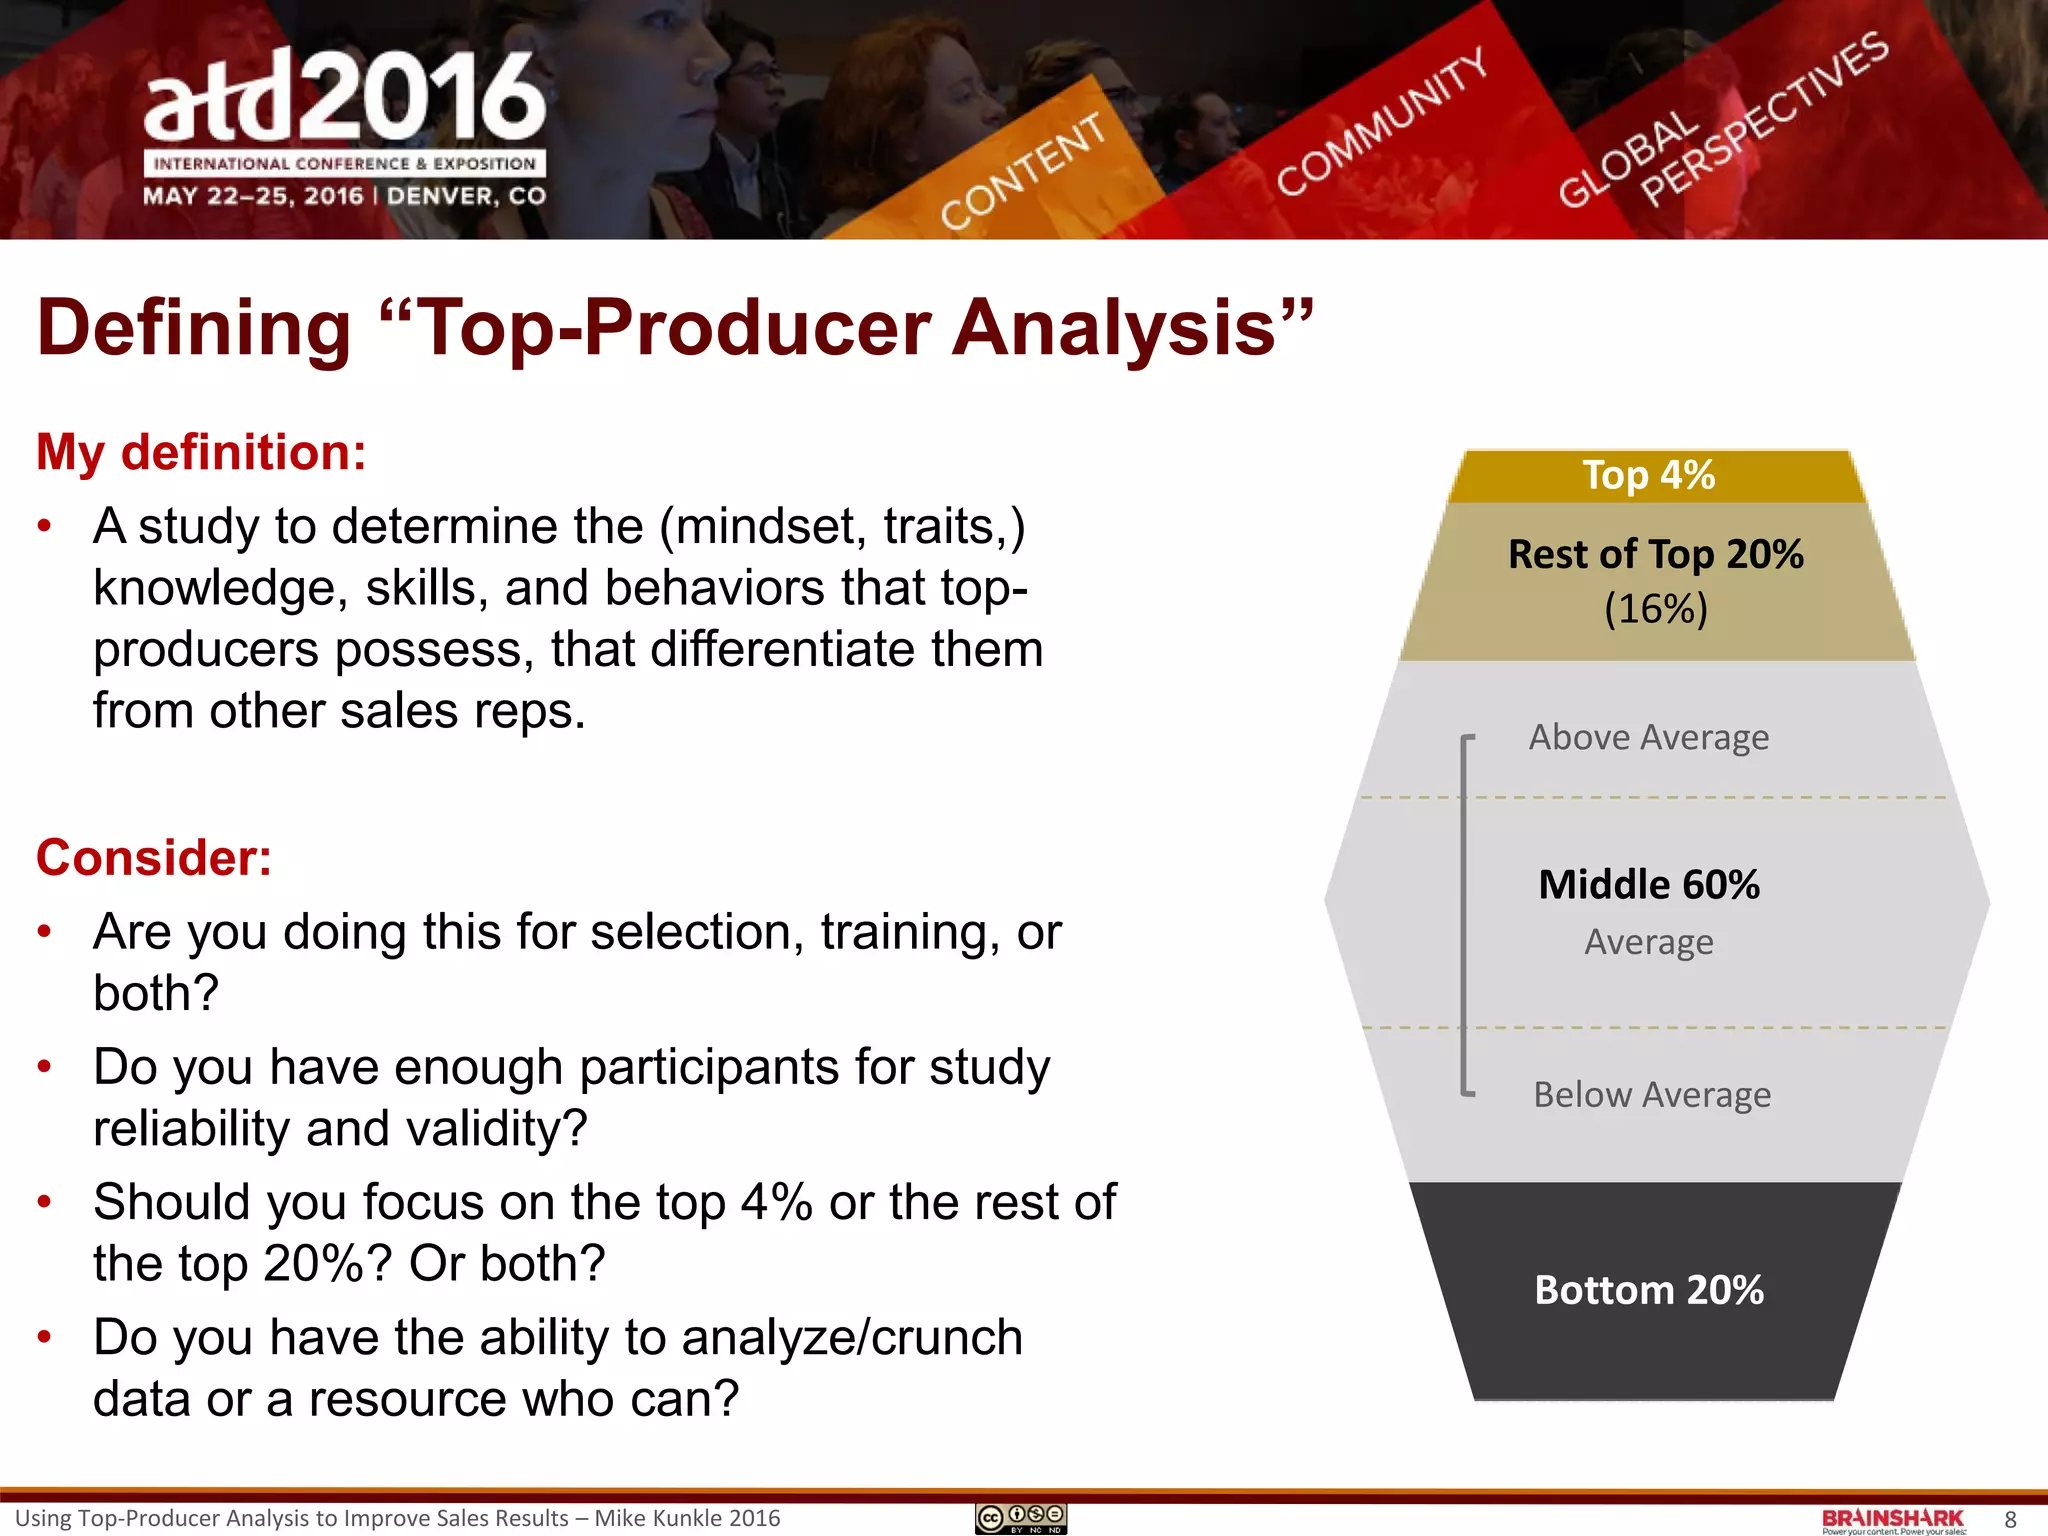
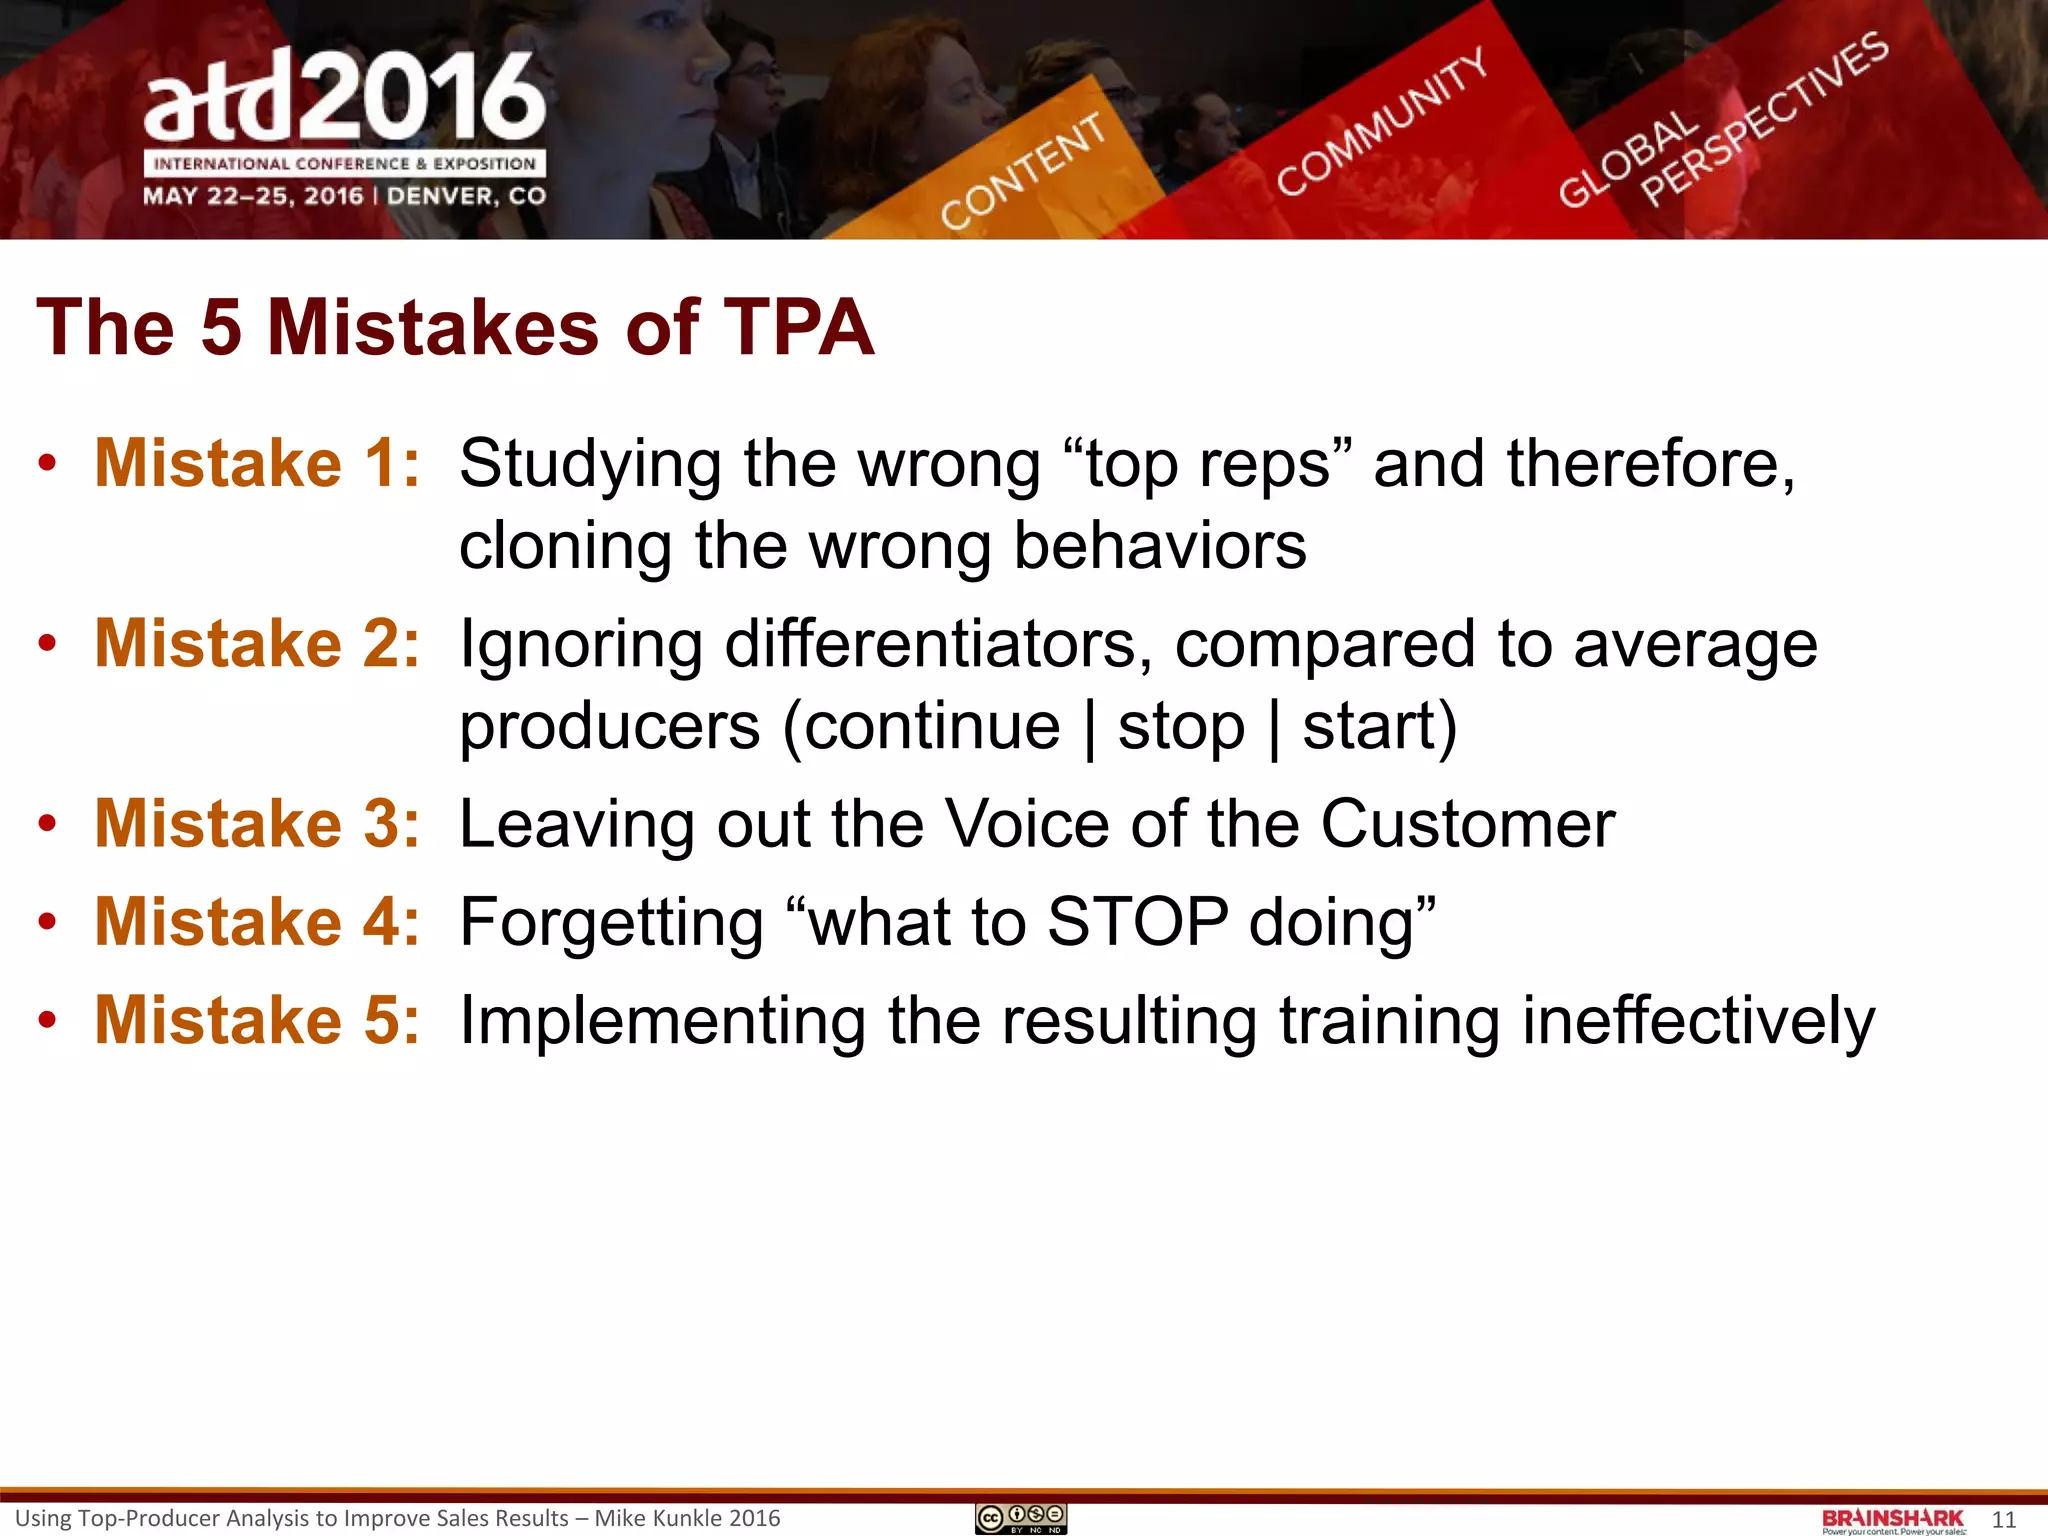
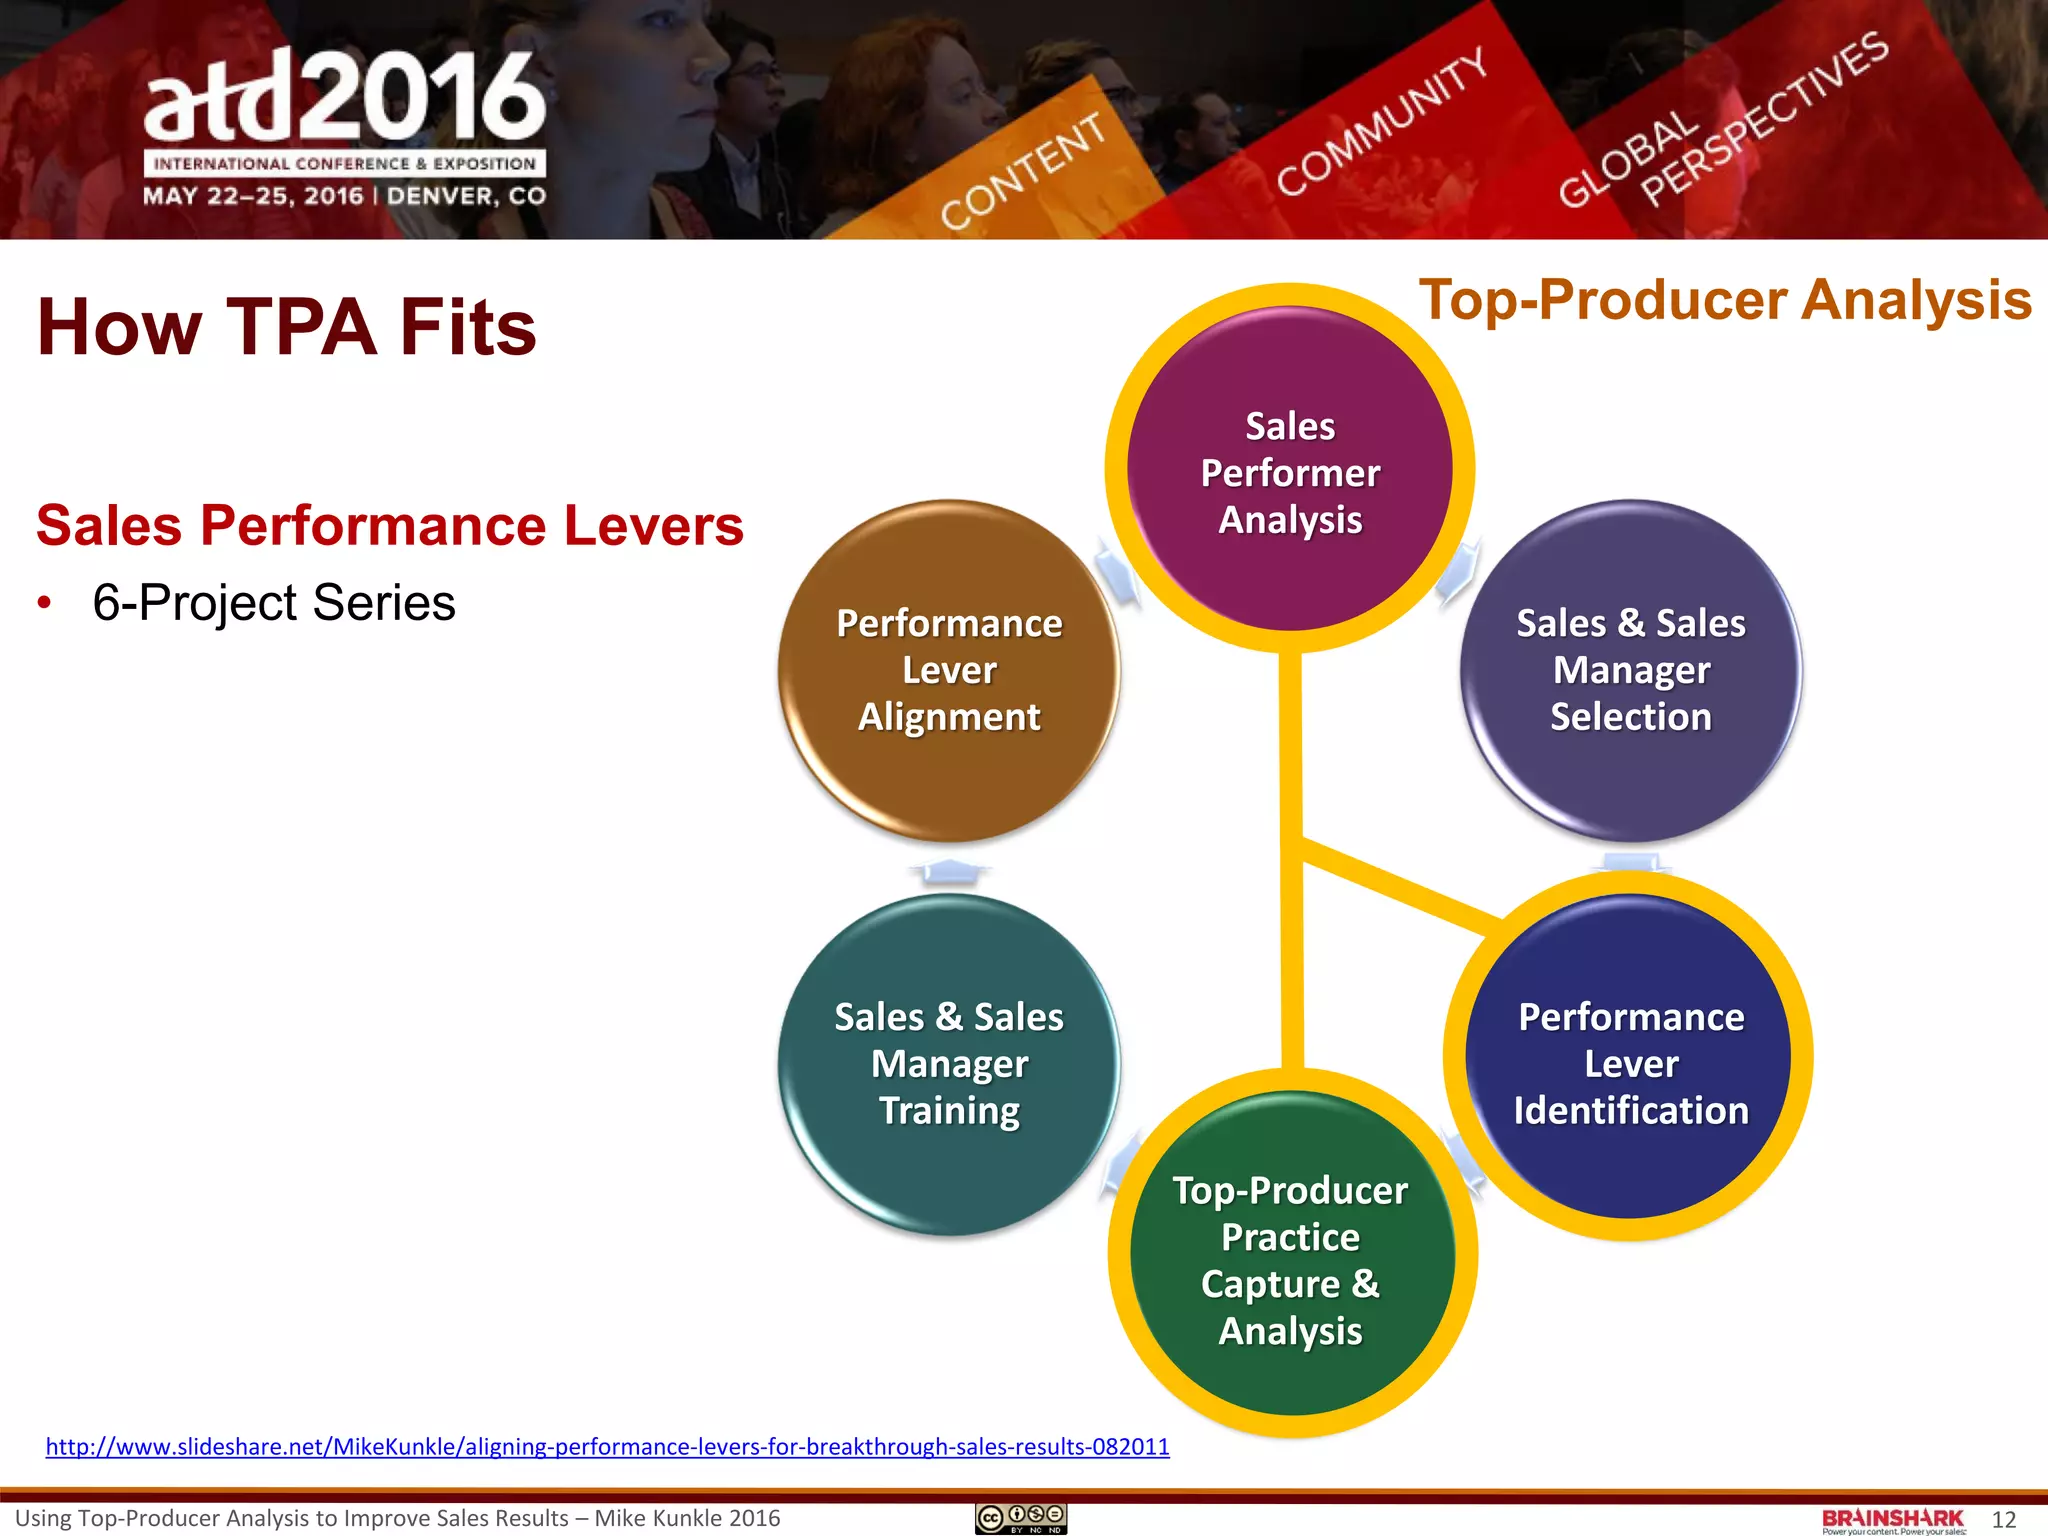
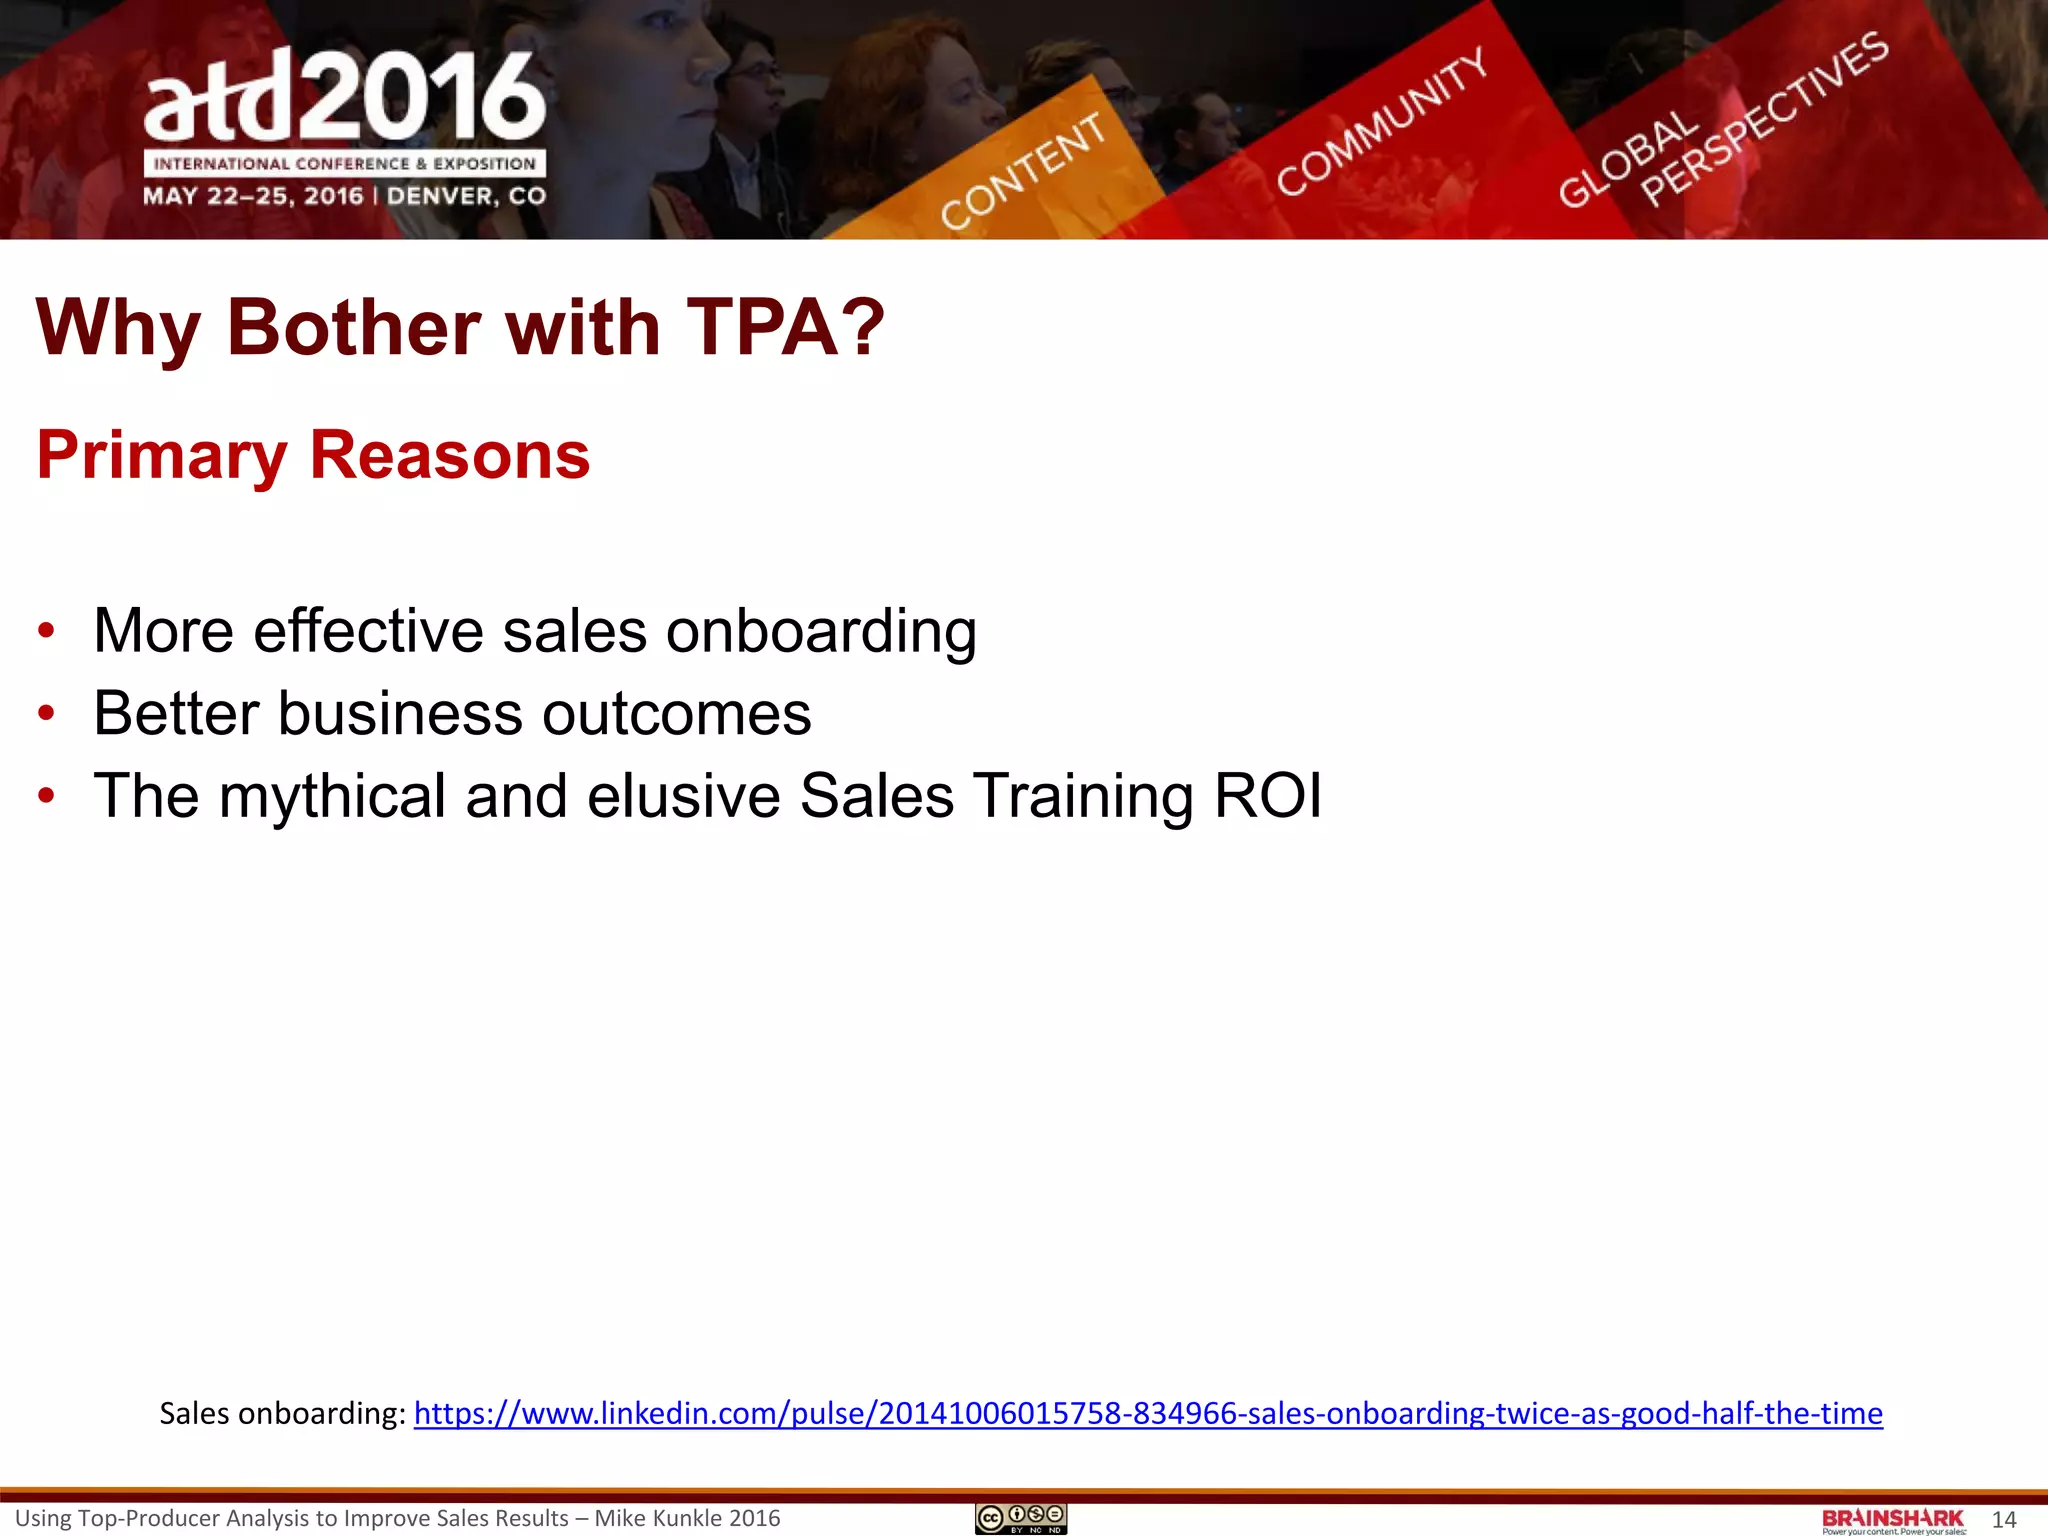
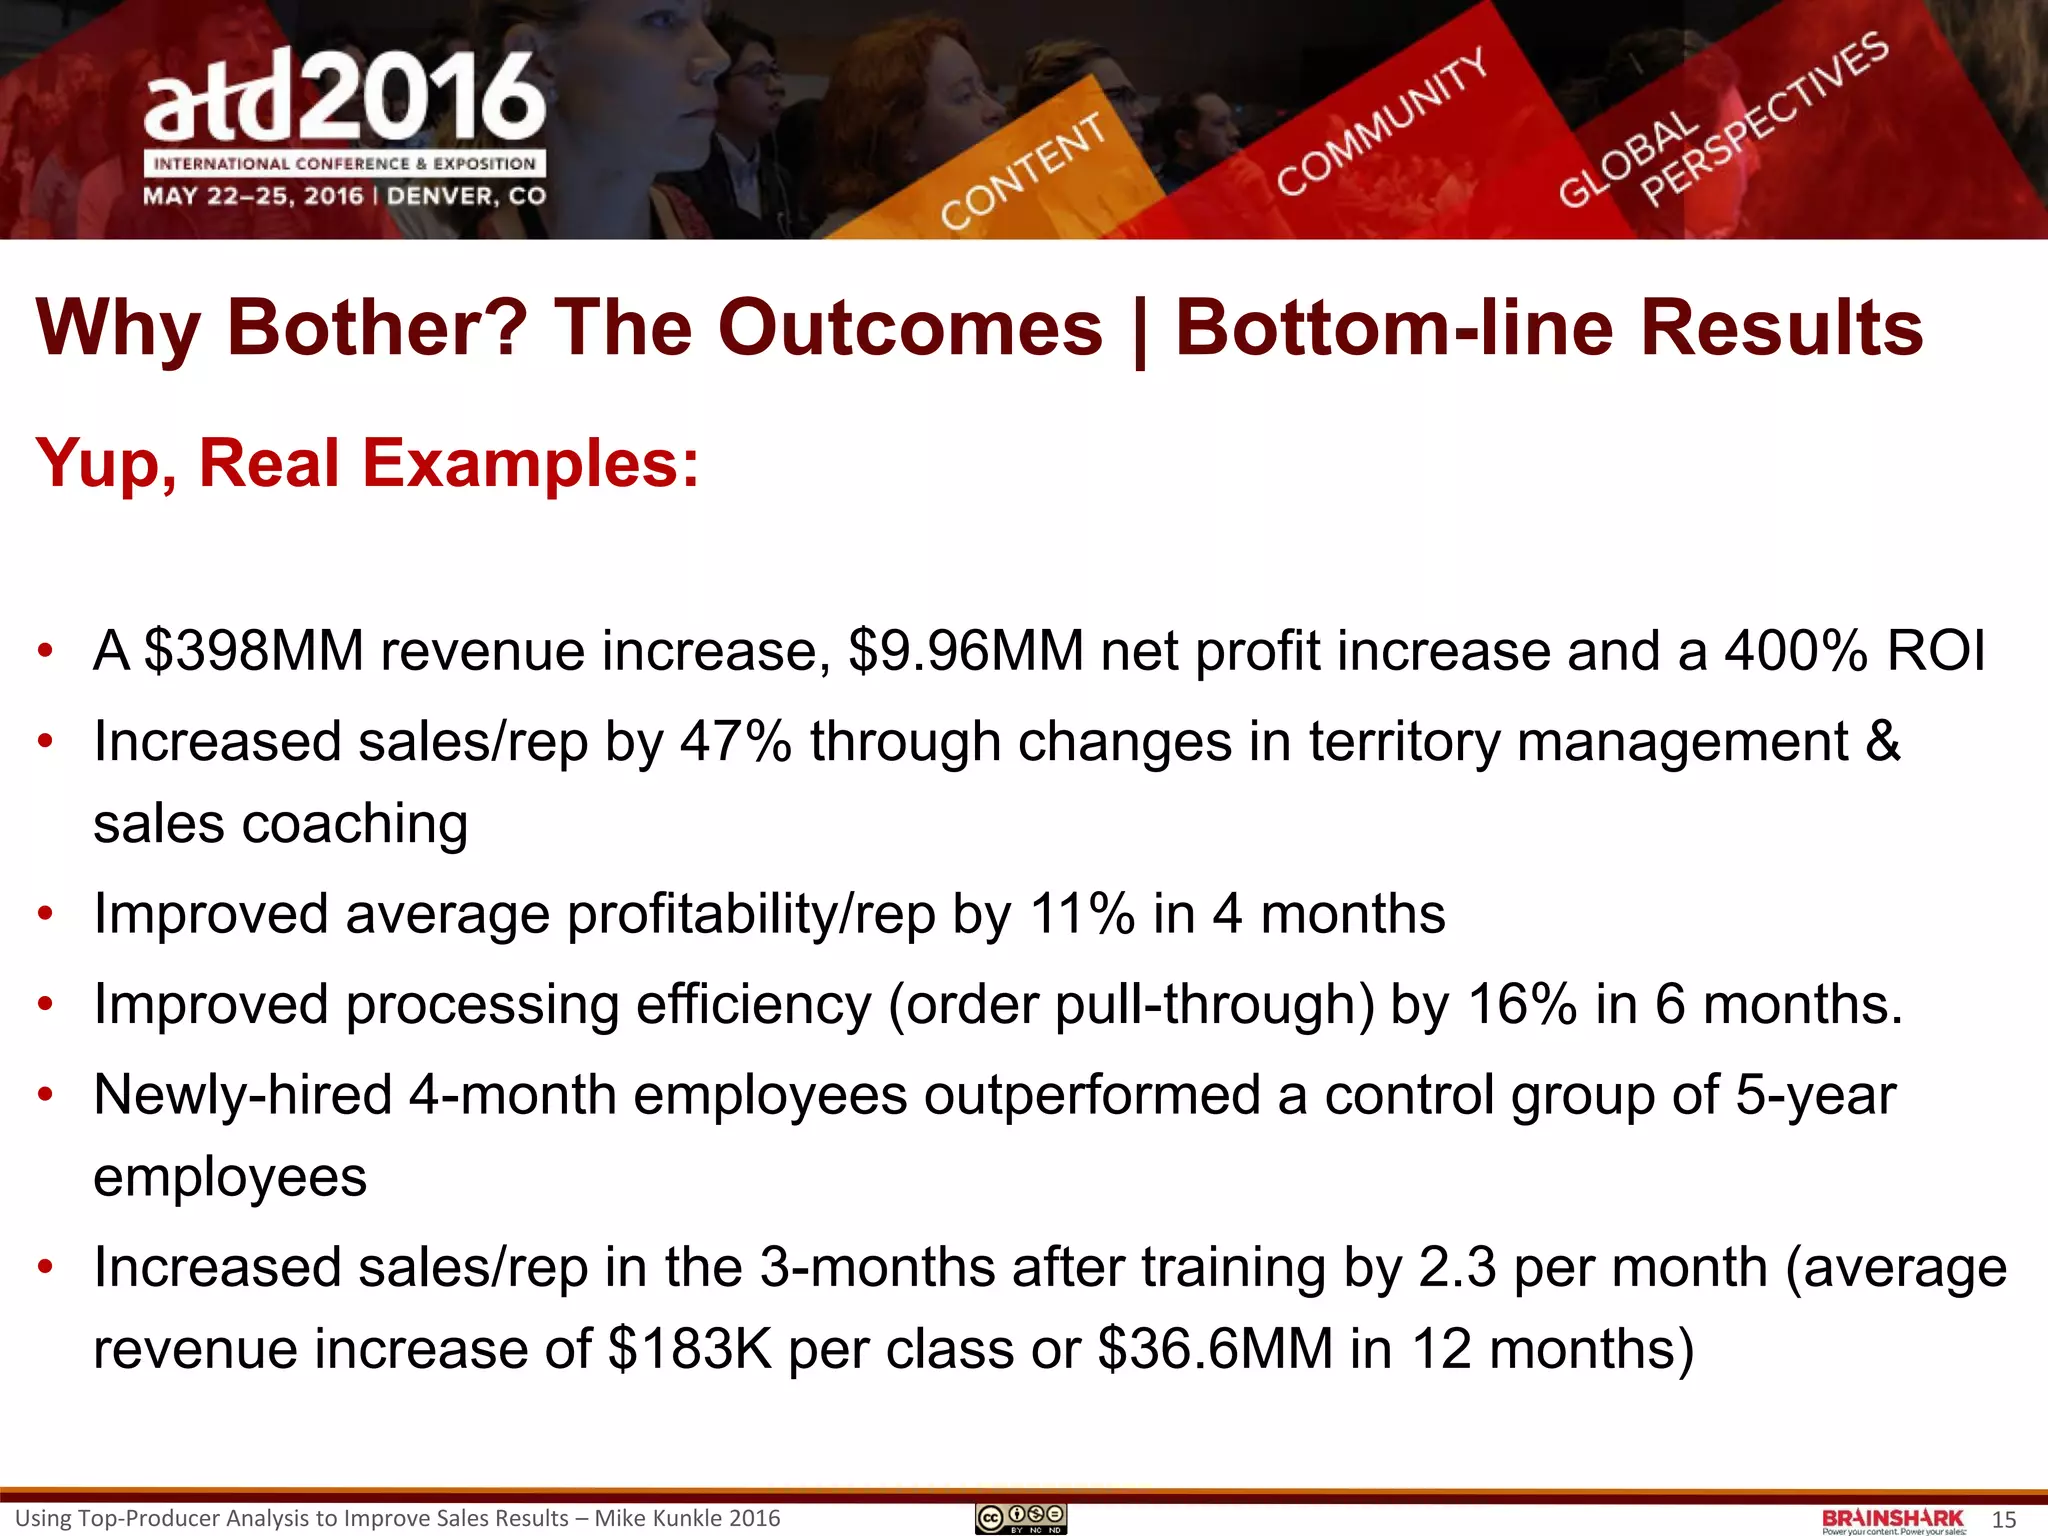
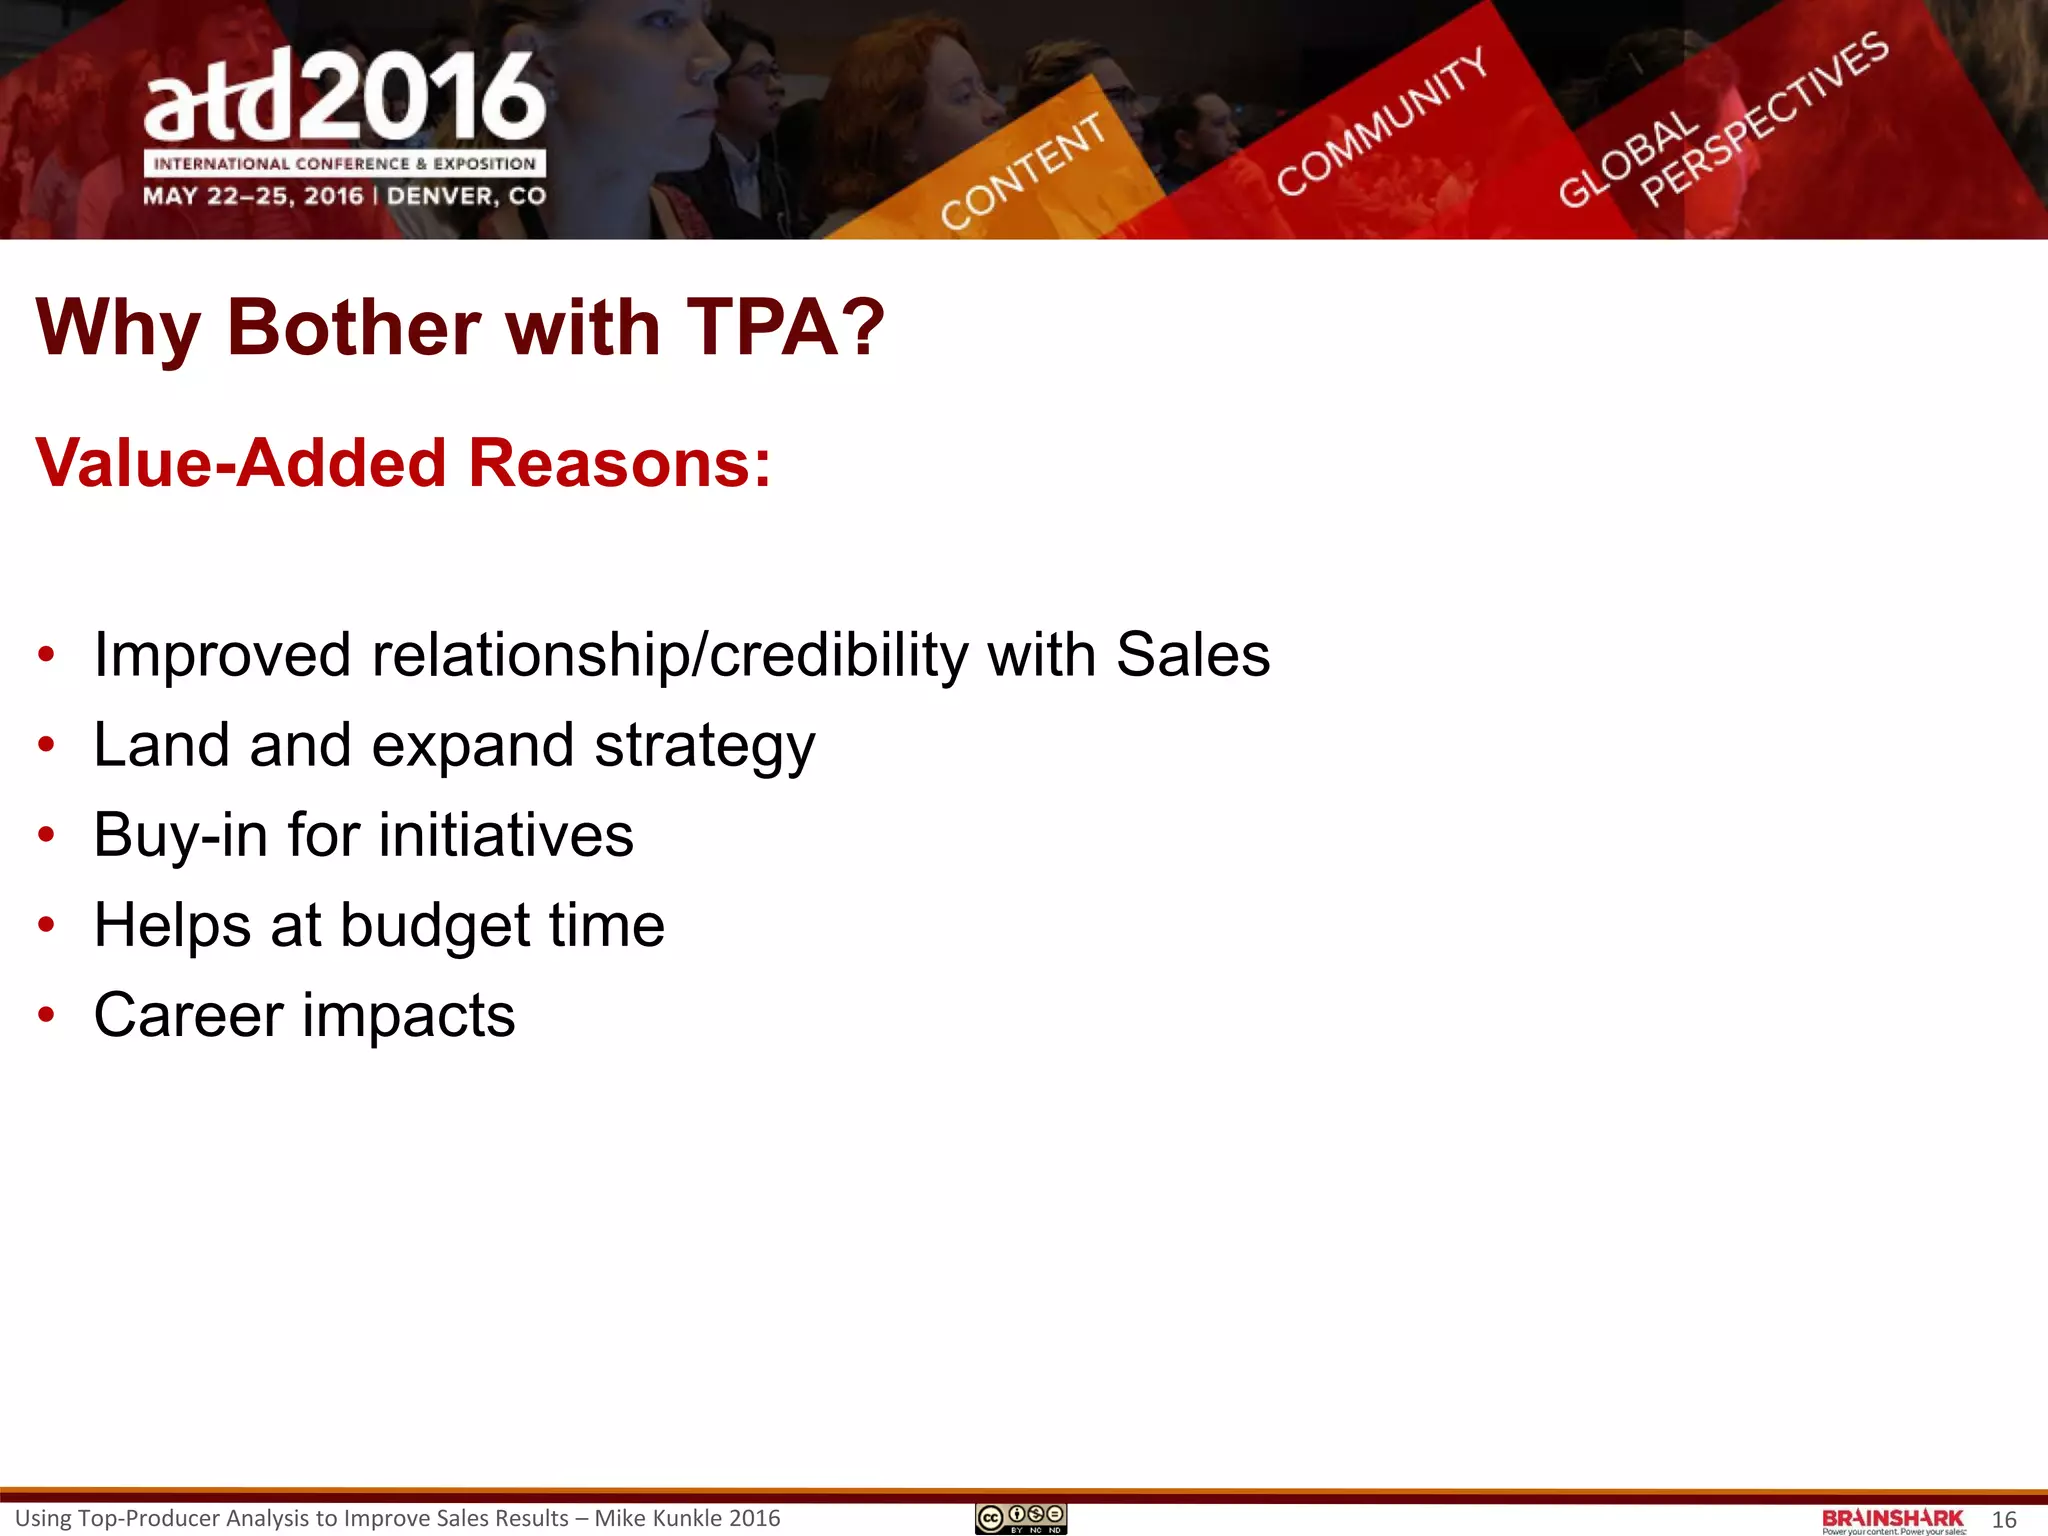
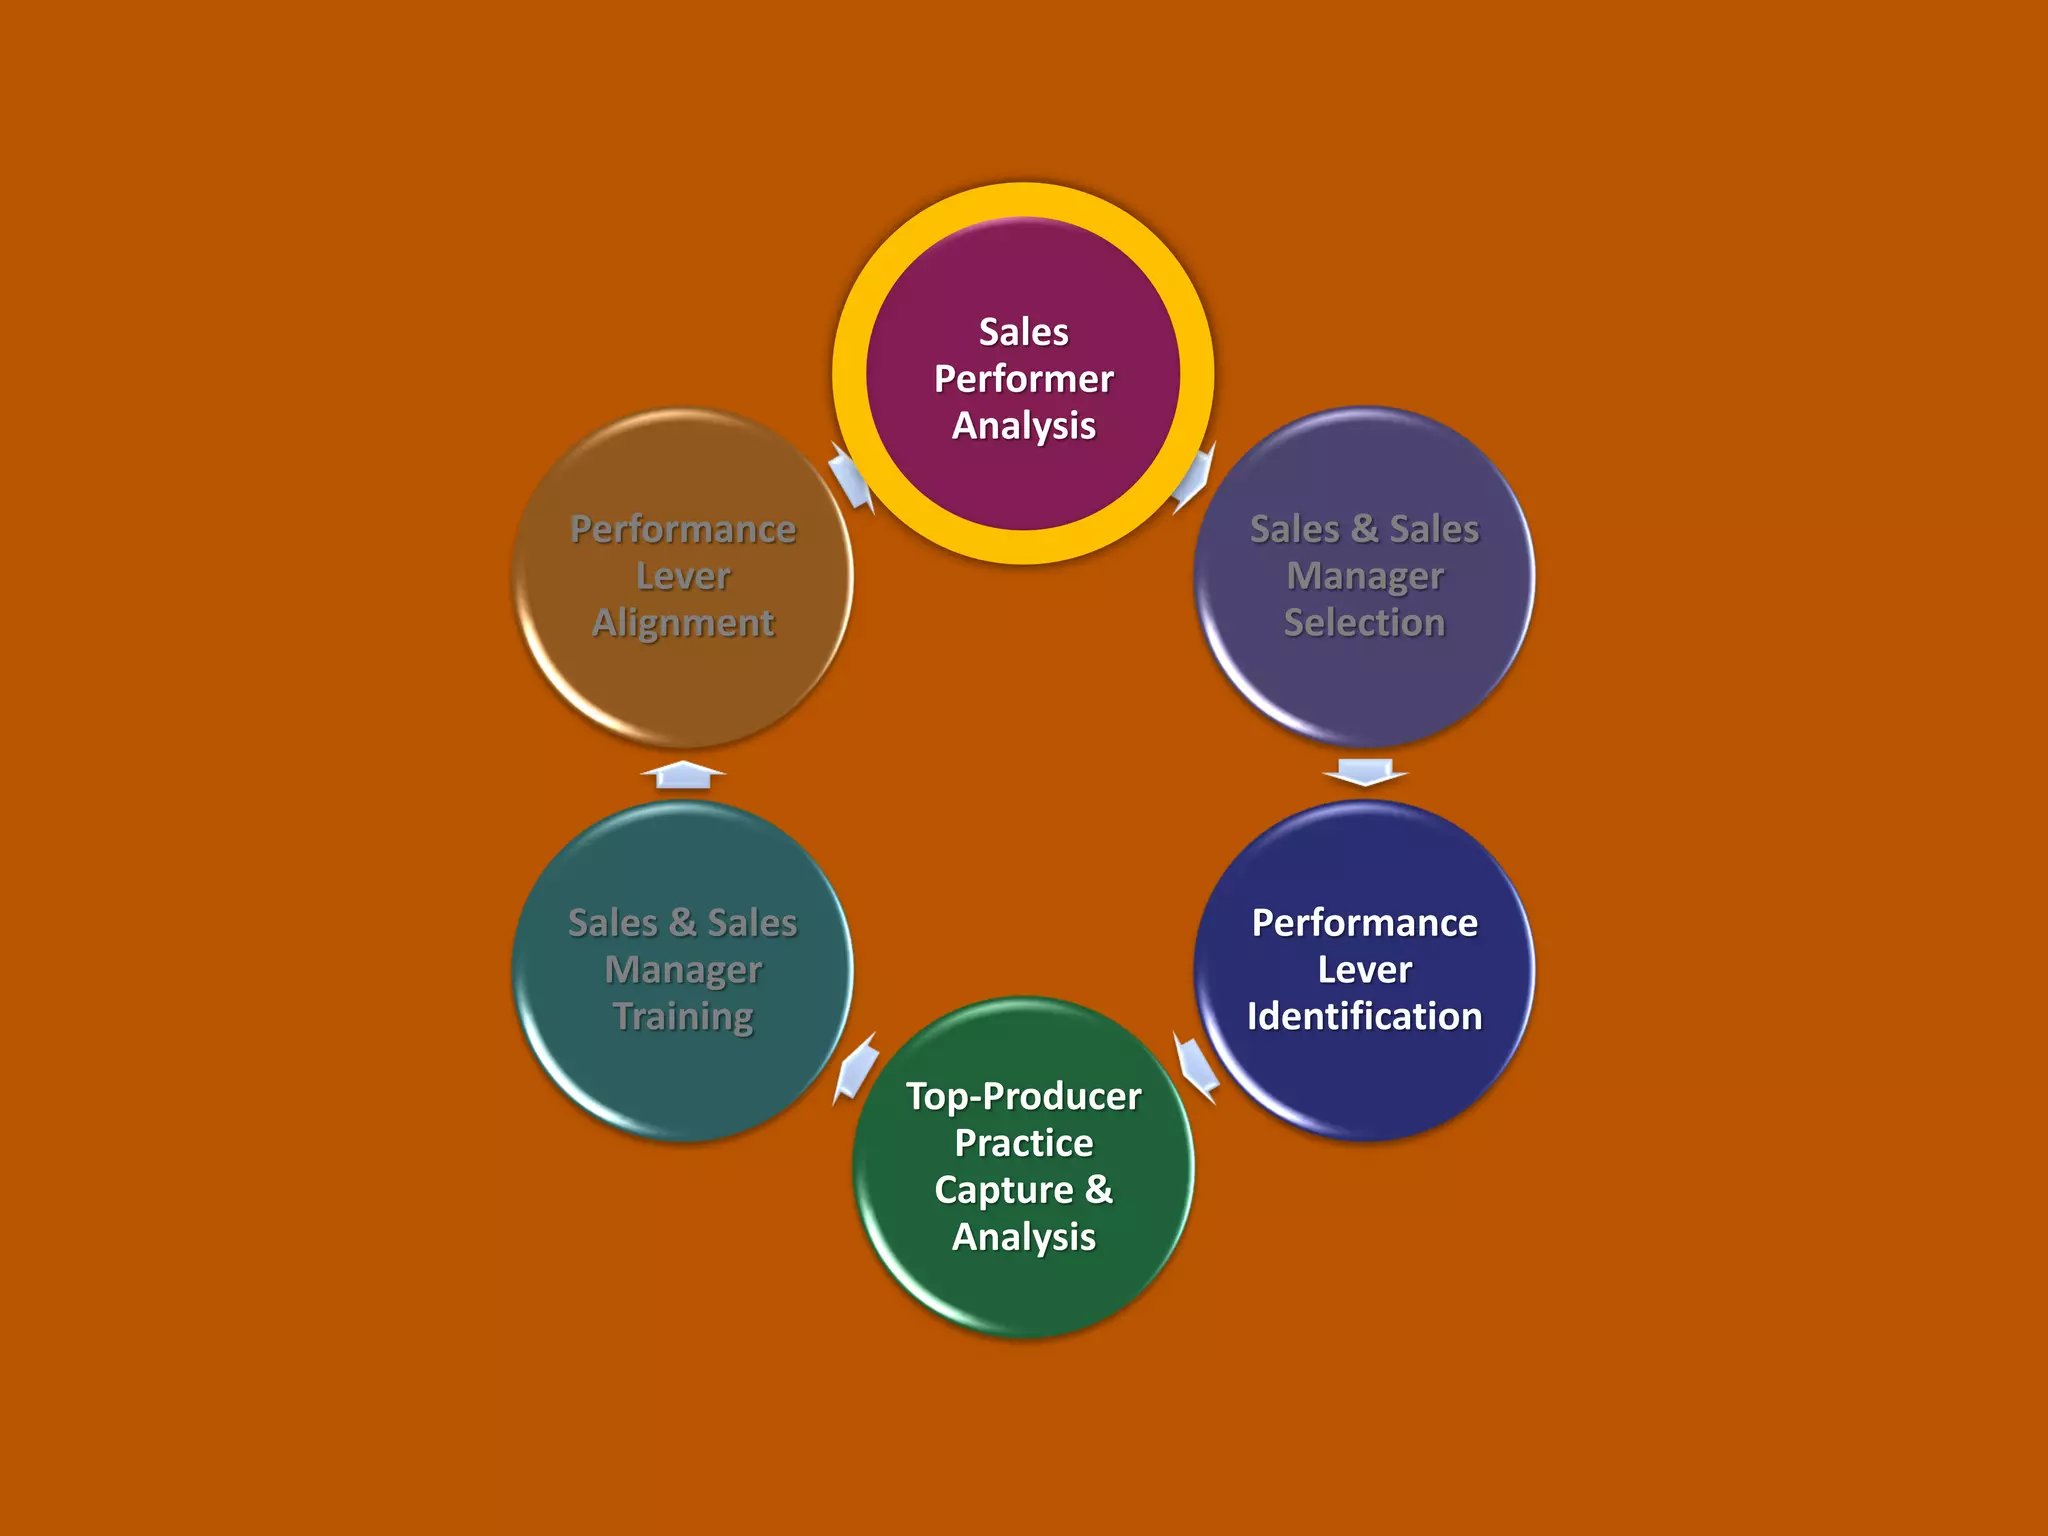
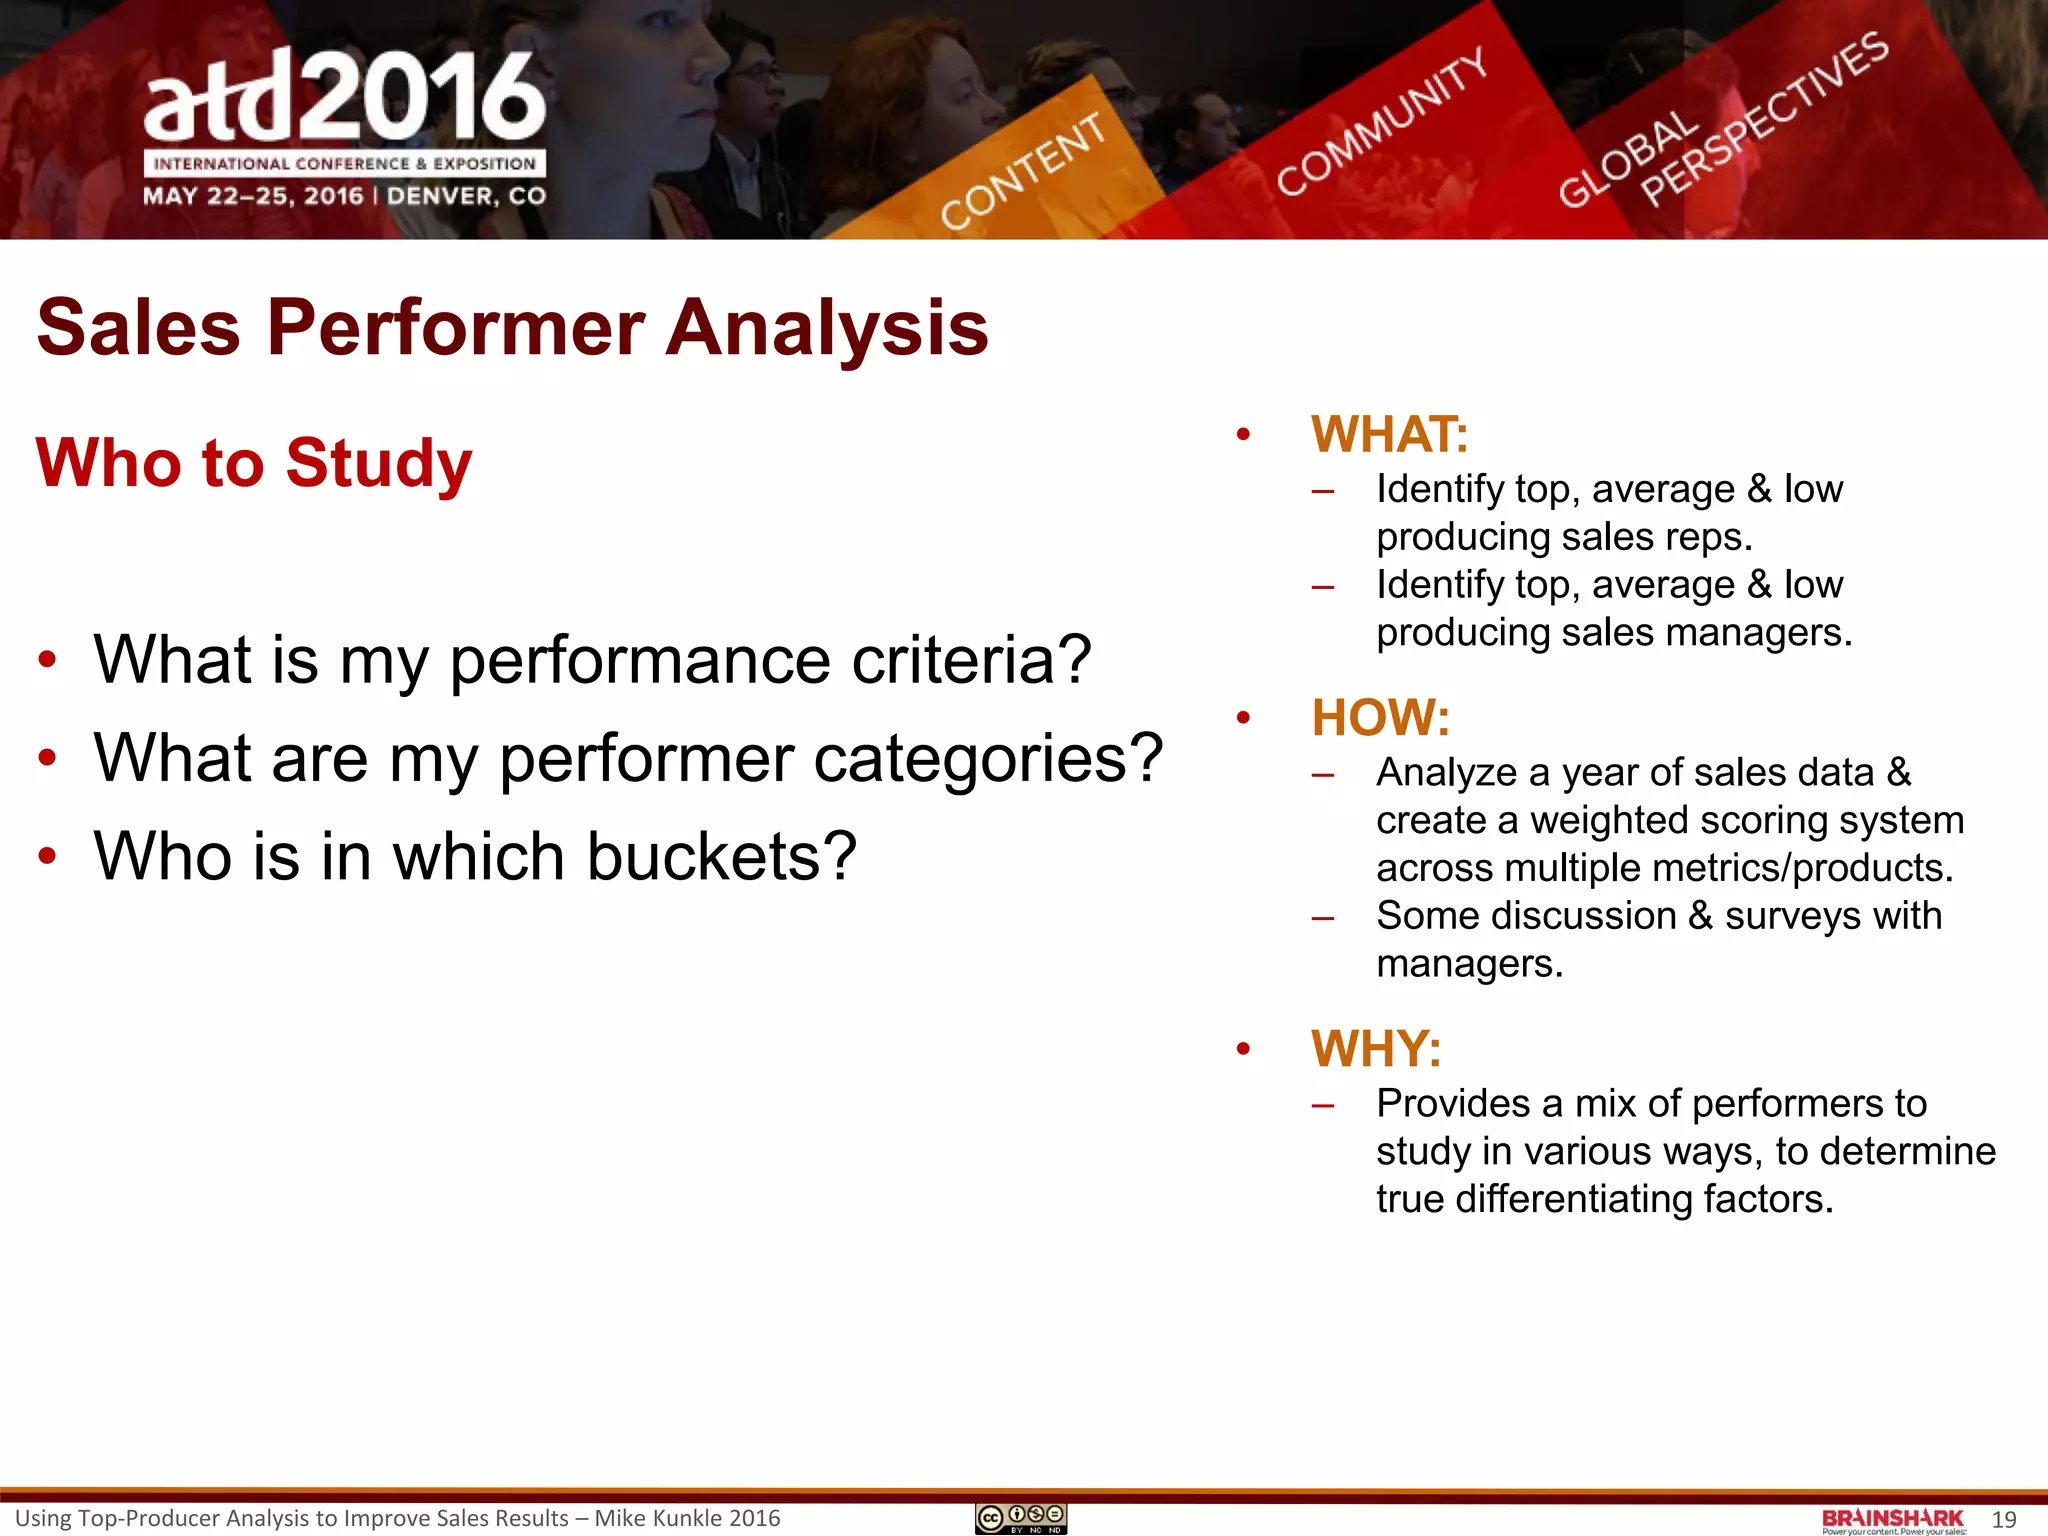
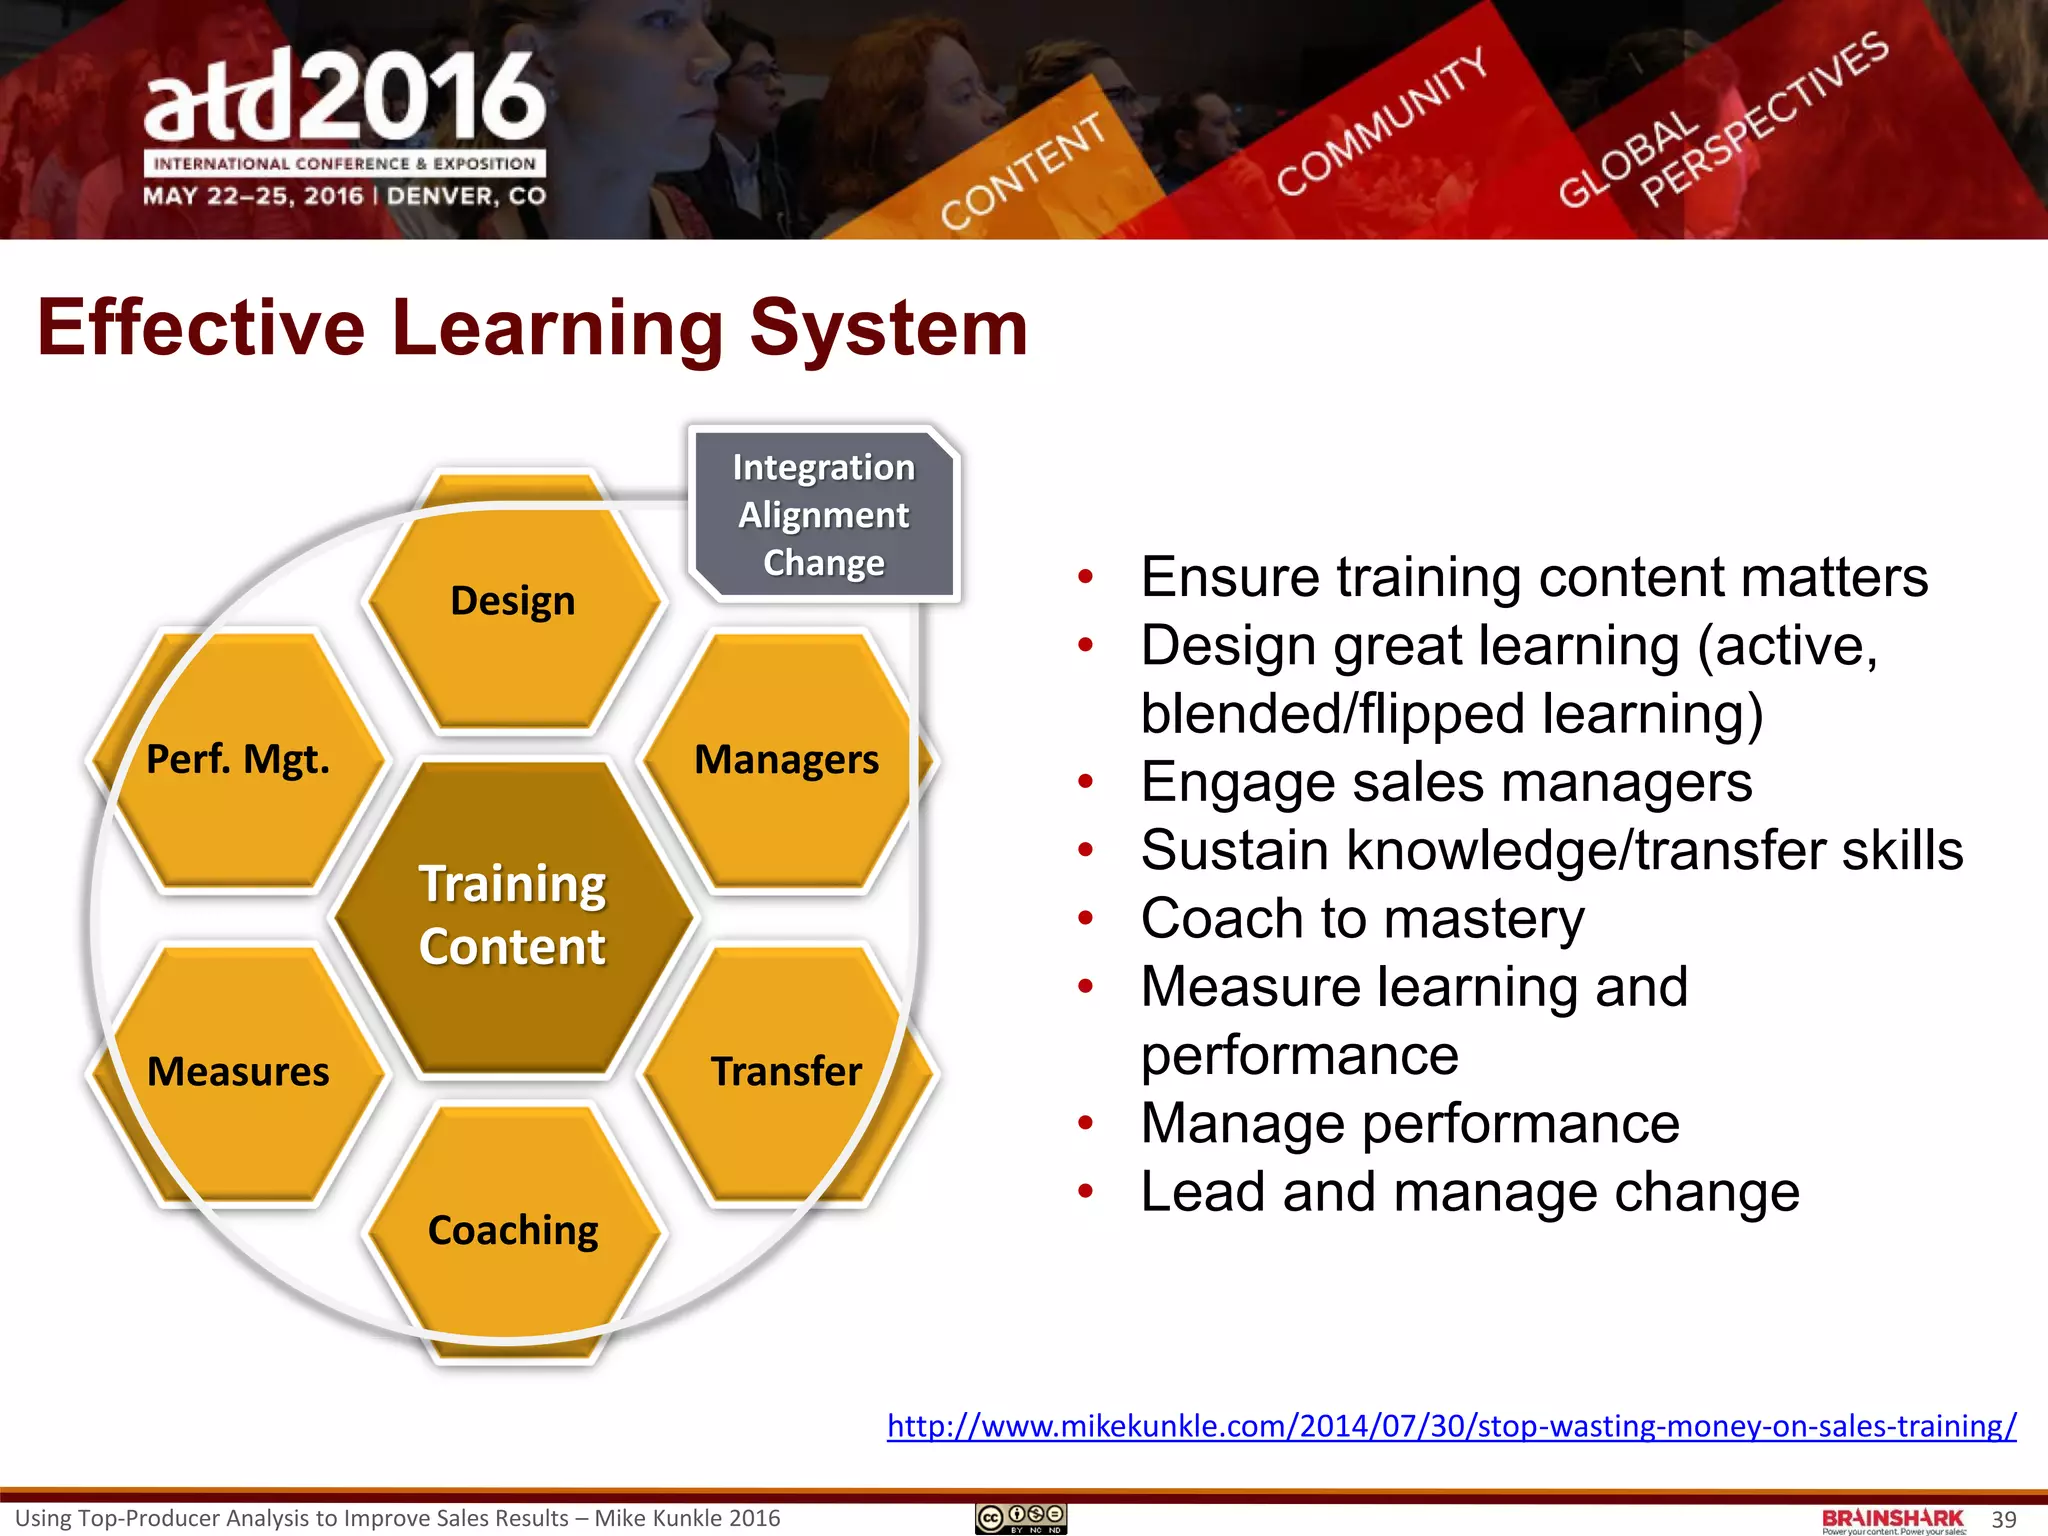
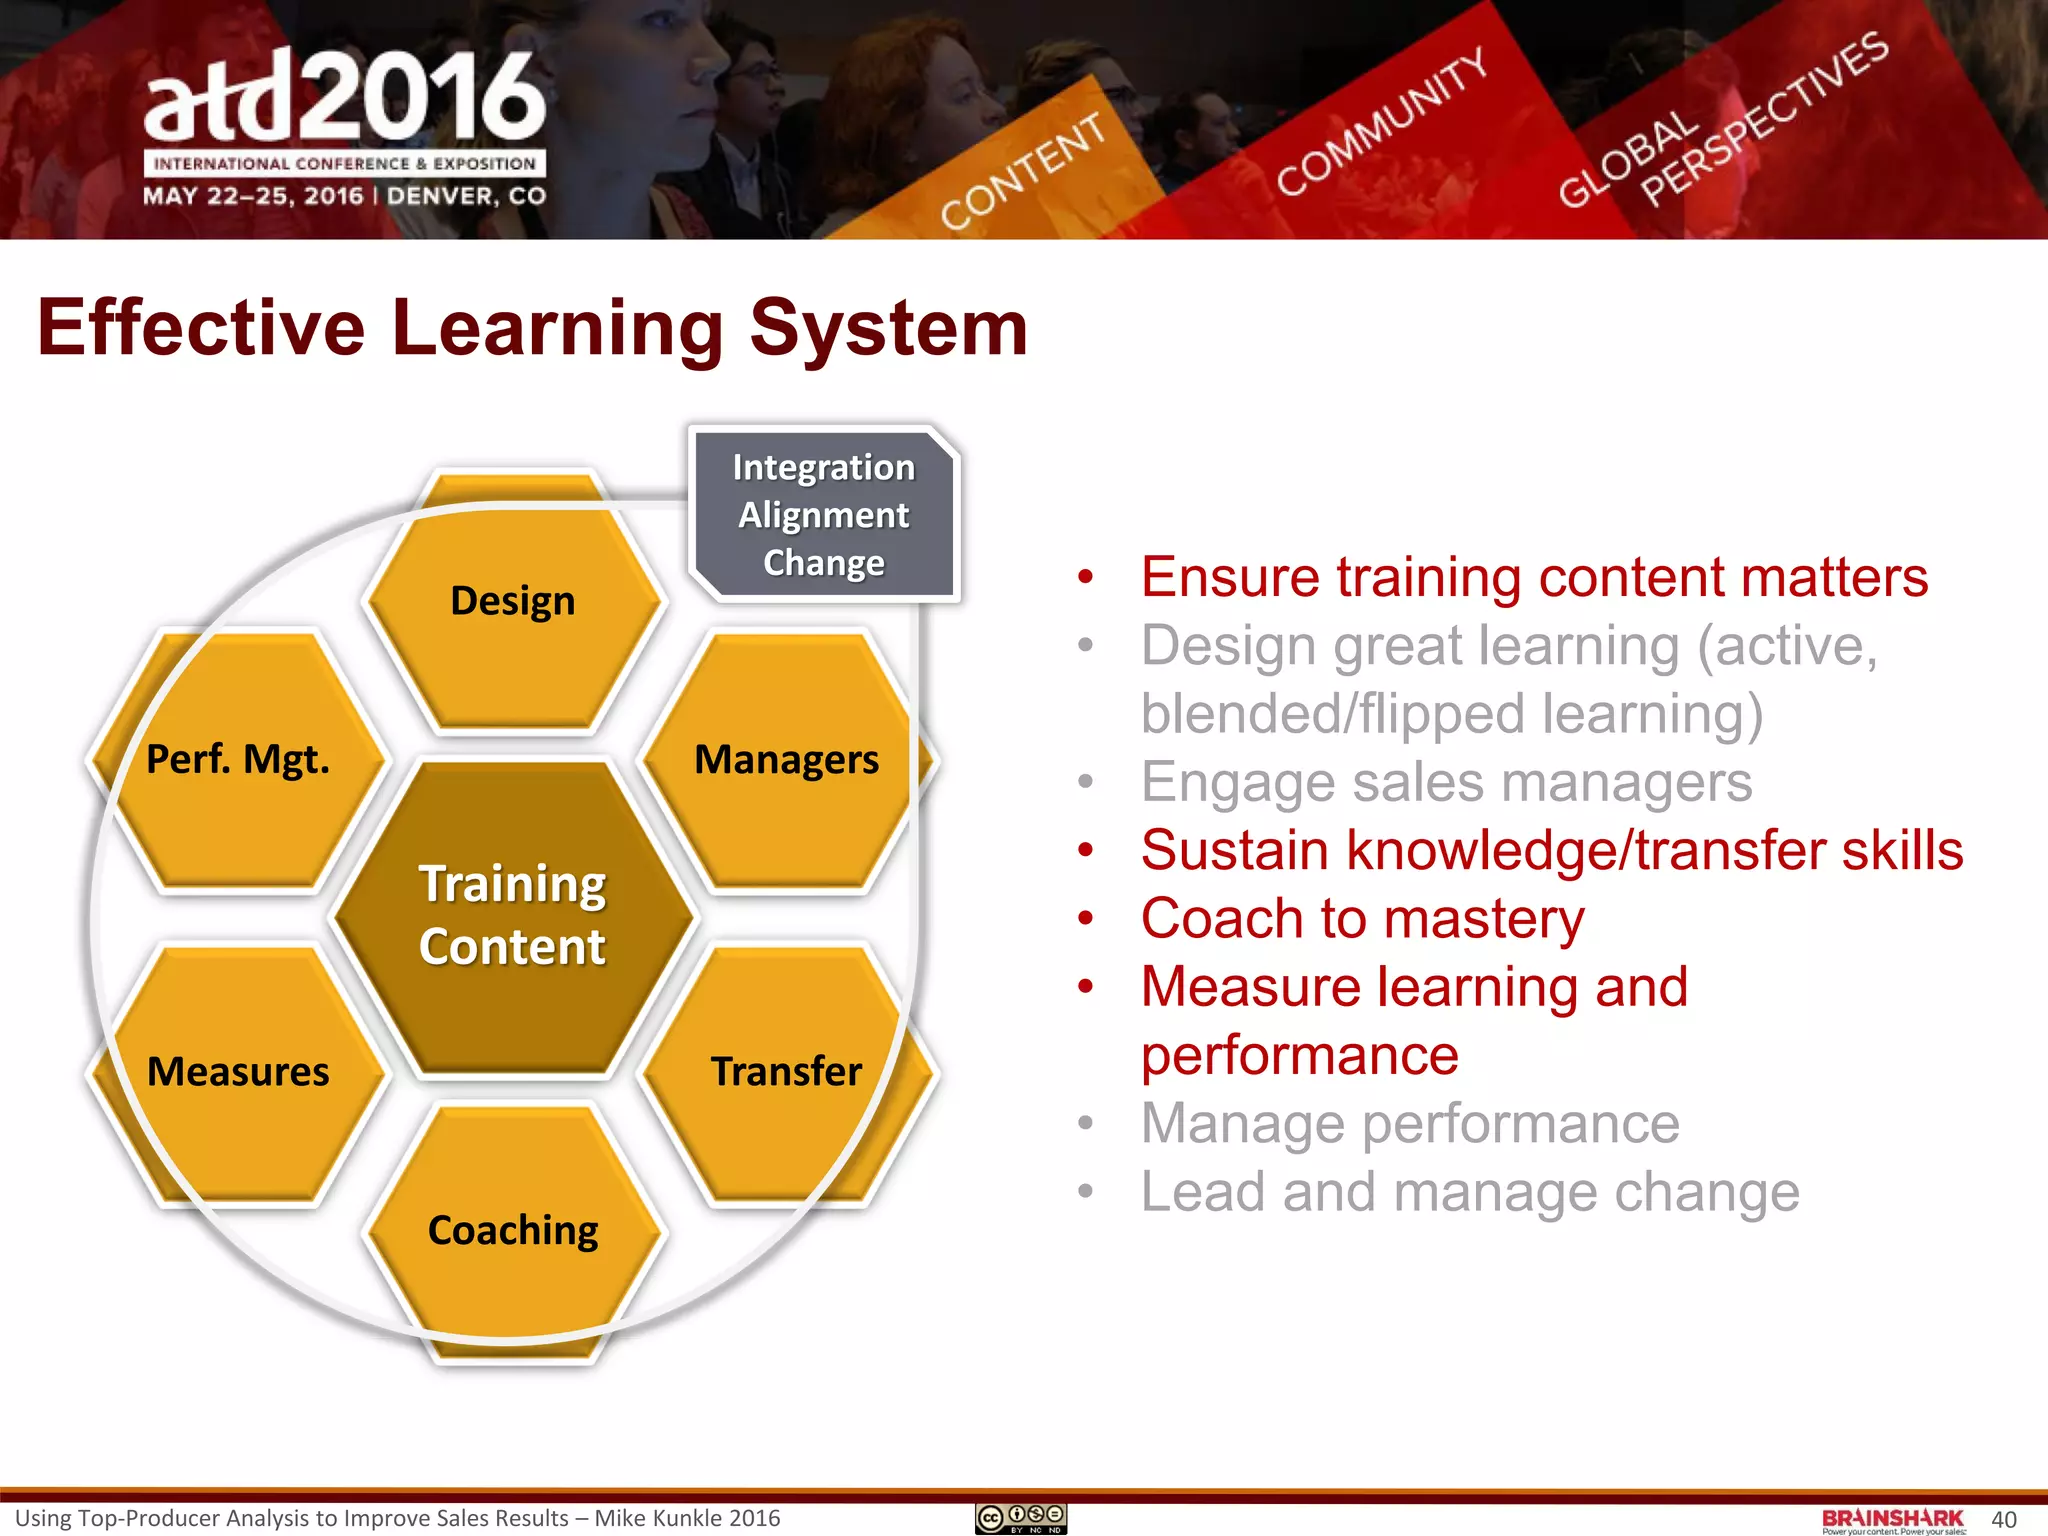
Using Top-Producer Analysis to
Improve Sales Results
Mike Kunkle
Session TU218
.
Tue, May 24 | 1:00 PM - 2:00 PM | 702/704
The Premier Conference for TD Professionals
Come see us at Booth #858
Some Housekeeping
• Join the social circus!
– @Mike_Kunkle
– @Brainshark
– Hashtags: #TopProdAnalysis #atd2016
• SlideShare: http://bit.ly/mkatd2016
• Breaking rules: Deck is a resource
• Feel free to ask questions
• Award-winning Brainshark solutions
for improving sales readiness at
booth #858.
Using Top-Producer Analysis to Improve Sales Results – Mike Kunkle 2016 2
Agenda
• What is Top-Producer Analysis?
• Why do it?
• How to do it?
• What to do with it?
Using Top-Producer Analysis to Improve Sales Results – Mike Kunkle 2016 3
Using Top-Producer Analysis to Improve Sales Results – Mike Kunkle 2016 4
“Advice about how to figure out what’s
right for you, is better than advice
about what to do.”
~ Mike Kunkle
Hey, that’s me!
Final thought before we get started…
5
Top-Producer Analysis
What Is It?
What is Top-Producer Analysis (TPA)?
• Defining “top sales producer”
• Defining “Top-Producer Analysis”
• How bad practice has undermined “best practices”
• The 5 Mistakes to avoid during TPA
• Some context – where TPA fits.
Using Top-Producer Analysis to Improve Sales Results – Mike Kunkle 2016 6
Defining “Top Sales Producer”
My definition:
• A sales rep who has an acceptable blend of
the results, mindset, traits, knowledge, skills,
and behaviors that you want to replicate in
your sales force.
Consider:
• How the top 4% & 16% are different
• What criteria/KPIs/results matter most for the
future?
• Is the rep truly responsible for their results?
• Is what the rep does, replicable, repeatable
and trainable?
• Ask sales leadership to identify study
participants but validate with data.
Top 4%
Bottom 20%
Top 4%
Rest of Top 20%
(16%)
Middle 60%
Above Average
Below Average
Average
Bottom 20%
7Using Top-Producer Analysis to Improve Sales Results – Mike Kunkle 2016
Defining “Top-Producer Analysis”
My definition:
• A study to determine the (mindset, traits,)
knowledge, skills, and behaviors that top-
producers possess, that differentiate them
from other sales reps.
Consider:
• Are you doing this for selection, training, or
both?
• Do you have enough participants for study
reliability and validity?
• Should you focus on the top 4% or the rest of
the top 20%? Or both?
• Do you have the ability to analyze/crunch
data or a resource who can?
Top 4%
Bottom 20%
Top 4%
Rest of Top 20%
(16%)
Middle 60%
Above Average
Below Average
Average
Bottom 20%
Using Top-Producer Analysis to Improve Sales Results – Mike Kunkle 2016 8
Best Practices vs. Top-Producer Practices
Some common concerns on “best”…
• “Best practices aren’t really ‘best’… they’re just good practices.”
• “Who determines whether something is best or not? Isn’t that
immediately invalid?”
• “I’ve never seen a best practices study amount to anything.”
• “I tried that at a previous company and it was a waste of time.” *
* Grrr…
Using Top-Producer Analysis to Improve Sales Results – Mike Kunkle 2016 9
Best Practices vs. Top-Producer Practices
Why TPS is better than “best”
• Sales Utility Belt concept
• Sales Nuance is the new black
• Judgment is the superpower of selling skills.
Sales Judgment: https://www.linkedin.com/pulse/20140816235048-834966-judgment-the-superpower-of-selling-skills
Sales Nuance: https://www.linkedin.com/pulse/what-sales-nuances-why-you-should-care-mike-kunkle
Using Top-Producer Analysis to Improve Sales Results – Mike Kunkle 2016 10
The 5 Mistakes of TPA
• Mistake 1: Studying the wrong “top reps” and therefore,
cloning the wrong behaviors
• Mistake 2: Ignoring differentiators, compared to average
producers (continue | stop | start)
• Mistake 3: Leaving out the Voice of the Customer
• Mistake 4: Forgetting “what to STOP doing”
• Mistake 5: Implementing the resulting training ineffectively.
Using Top-Producer Analysis to Improve Sales Results – Mike Kunkle 2016 11
Sales
Performer
Analysis
Sales & Sales
Manager
Selection
Performance
Lever
Identification
Top-Producer
Practice
Capture &
Analysis
Sales & Sales
Manager
Training
Performance
Lever
Alignment
Using Top-Producer Analysis to Improve Sales Results – Mike Kunkle 2016 12
http://www.slideshare.net/MikeKunkle/aligning-performance-levers-for-breakthrough-sales-results-082011
How TPA Fits
Sales Performance Levers
• 6-Project Series
Performance Levers:
• Critical competencies,
knowledge, skills, behaviors
and conditions which must be
present for ethical, sustained,
high-performance to occur.
Sales
Performer
Analysis
Sales & Sales
Manager
Selection
Performance
Lever
Identification
Top-Producer
Practice
Capture &
Analysis
Sales & Sales
Manager
Training
Performance
Lever
Alignment
Using Top-Producer Analysis to Improve Sales Results – Mike Kunkle 2016 13
Top-Producer Analysis
http://www.slideshare.net/MikeKunkle/aligning-performance-levers-for-breakthrough-sales-results-082011
How TPA Fits
Sales Performance Levers
• 6-Project Series
Performance Levers:
• Critical competencies,
knowledge, skills, behaviors
and conditions which must be
present for ethical, sustained,
high-performance to occur.
14
Top-Producer Analysis
Why Do It?
Why Bother with TPA?
Primary Reasons
• More effective sales onboarding
• Better business outcomes
• The mythical and elusive Sales Training ROI.
Using Top-Producer Analysis to Improve Sales Results – Mike Kunkle 2016 15
Sales onboarding: https://www.linkedin.com/pulse/20141006015758-834966-sales-onboarding-twice-as-good-half-the-time
Why Bother? The Outcomes | Bottom-line Results
Yup, Real Examples:
• A $398MM revenue increase, $9.96MM net profit increase and a 400% ROI
• Increased sales/rep by 47% through changes in territory management &
sales coaching
• Improved average profitability/rep by 11% in 4 months
• Improved processing efficiency (order pull-through) by 16% in 6 months.
• Newly-hired 4-month employees outperformed a control group of 5-year
employees
• Increased sales/rep in the 3-months after training by 2.3 per month (average
revenue increase of $183K per class or $36.6MM in 12 months).
Using Top-Producer Analysis to Improve Sales Results – Mike Kunkle 2016 16
Why Bother with TPA?
Value-Added Reasons:
• Improved relationship/credibility with Sales
• Land and expand strategy
• Buy-in for initiatives
• Helps at budget time
• Career impacts.
Using Top-Producer Analysis to Improve Sales Results – Mike Kunkle 2016 17
Top-Producer Analysis
How To Do It?
19
Sales
Performer
Analysis
Sales & Sales
Manager
Selection
Performance
Lever
Identification
Top-Producer
Practice
Capture &
Analysis
Sales & Sales
Manager
Training
Performance
Lever
Alignment
Sales Performer Analysis
Who to Study
• What is my performance criteria?
• What are my performer categories?
• Who is in which buckets?
Using Top-Producer Analysis to Improve Sales Results – Mike Kunkle 2016 20
• WHAT:
‒ Identify top, average & low
producing sales reps.
‒ Identify top, average & low
producing sales managers.
• HOW:
‒ Analyze a year of sales data &
create a weighted scoring system
across multiple metrics/products.
‒ Some discussion & surveys with
managers.
• WHY:
‒ Provides a mix of performers to
study in various ways, to determine
true differentiating factors.
Example of Sales Metrics / Performance Criteria
Using Top-Producer Analysis to Improve Sales Results – Mike Kunkle 2016 21
Metrics Quarterly Weighting *
Create a weighted scoring system…
# of Sales Med-High (2-3)
$ Volume Low (1)
Velocity Med (1-2)
Avg # Sales/Rep High (3-4)
Avg $ Vol/Rep Med-High (2-3)
Cross-Sell Percent Med (1-2)
* Review the last 12 months & the last quarter. Consider weighting the quarter more heavily. Blend the scores.
Example of Performer Categories
Using Top-Producer Analysis to Improve Sales Results – Mike Kunkle 2016 22
Top New Reps
New = >30 days, <271 days
39
Top = In the Top Quintile of all metrics
Top Seasoned Reps
Seasoned = >365 days (many 5+ years)
307
Top = In the Top Quintile of all metrics
Average Reps Selected randomly, between mean and median production 298
Low Producer Reps Selected randomly from the bottom 20% 348
Top SM Producers Top = In the Top Quintile of all metrics, personal production 15
Top SM Team
Managers
Top = Top Quintile all metrics, w/o SM results + survey of their Mgr 52
Top SM Both
Top = In Top Producer group personally + Top Quintile all metrics w/o SM
results + survey of their Mgr
5
Average SM (Team) Selected randomly, between mean and median production 79
Low Performing SM
(Team)
Selected randomly from the bottom 20% 32
Often “top” includes tiers:
4% | 10% | 15% | 20%
n =
Example of Analysis – Sales Reps
Using Top-Producer Analysis to Improve Sales Results – Mike Kunkle 2016 23
Low
High
4th Quartile
Mean Avg.
Median
Sort Descending
Highlight 4th Quartile
Apply Weighting
Repeat & Total
Highlight 4th Quartile
Consider things like:
• Avg Productivity
‒ Avg # and $/rep/time period
• Engagement: % of team
producing and/or goal %/rep
• Total Team Sales: $ and #
• Avg Time to 1st Sale (new reps)
• Avg Time to productivity (new)
• Pipeline Stats:
‒ Conversion %
‒ Velocity
• Cross-sell Ratios or Penetration
• Trend Indicators (actual # last
month, avg/month over 13
weeks, avg/month past year)
• Survey Their Managers
‒ Remove the “luck” factor
‒ Remove “inherited territory”
‒ Remove “one great rep.”
Example of Analysis – Sales Managers
Using Top-Producer Analysis to Improve Sales Results – Mike Kunkle 2016 24
Data Crunch
Using Top-Producer Analysis to Improve Sales Results – Mike Kunkle 2016 25
Partner with smart people with stats
software to crunch data
26
Sales
Performer
Analysis
Sales & Sales
Manager
Selection
Performance
Lever
Identification
Top-Producer
Practice
Capture &
Analysis
Sales & Sales
Manager
Training
Performance
Lever
Alignment
Using Top-Producer Analysis to Improve Sales Results – Mike Kunkle 2016 27
• WHAT:
‒ Identify the competencies, knowledge, skills,
behaviors and conditions that must exist for
ethical, sustained, high performance to occur.
‒ Formulate hypotheses about what the levers
are for frontline sales and sales management
roles.
‒ Confirm and validate the levers through
research.
• HOW:
Through discussion, surveys, interviews,
focus groups, and observation of frontline
sales reps and their managers.
• WHY:
This will confirm where to focus your efforts
capturing Top-Producer Practices, which
provides training/coaching content.
Performance Lever ID
What to Study
• What are the Performance Levers?
• What’s working?
• Why?
• How will you figure it out?
REMINDER: Performance Levers…
• Critical competencies, knowledge, skills, behaviors and conditions which must be present
for ethical, sustained, high-performance to occur.
http://www.slideshare.net/MikeKunkle/aligning-performance-levers-for-breakthrough-sales-results-082011
Formulating the Hypotheses
• Start with known practices
• Talk with:
– Executives
– Other leaders
– Frontline sales reps
– Frontline sales managers
– Sales operations, enablement, and other sales
support staff
– And, hopefully, customers
• Label the big buckets and detail the tasks
• Don’t get married – you’re just dating
• Build surveys to confirm the hypotheses.
Using Top-Producer Analysis to Improve Sales Results – Mike Kunkle 2016 28
Using Top-Producer Analysis to Improve Sales Results – Mike Kunkle 2016 29
Identify the high-level
Performance Levers (hypotheses)
Document the potential tasks for
the Performance Lever
Ask what you’ve missed
Survey Design
Using Top-Producer Analysis to Improve Sales Results – Mike Kunkle 2016 30
Survey Design
Clearly define Performance Lever
Define the role
Add instructions for
completing the survey
Using Top-Producer Analysis to Improve Sales Results – Mike Kunkle 2016 31
Survey Design
• Rate the statement provided.
• How much do you agree it’s a
Performance Lever?
• If rated 1-2, next question.
• If rated 3-5:
• Importance & Difficulty
• And in some cases:
• Frequency: Actual & Should
• In addition, you should ask what you missed, by Lever, and a handful of other
questions – such as normal demographics & Continue | Start | Stop.
Using empathy statements to acknowledge a prospect’s situation/feelings
Survey Design
Look familiar?
Using Top-Producer Analysis to Improve Sales Results – Mike Kunkle 2016 32
Partner with smart people with stats
software to crunch data
33
Sales
Performer
Analysis
Sales & Sales
Manager
Selection
Performance
Lever
Identification
Top-Producer
Practice
Capture &
Analysis
Sales & Sales
Manager
Training
Performance
Lever
Alignment
Using Top-Producer Analysis to Improve Sales Results – Mike Kunkle 2016 34
TPA: Capture & Analysis
How to Study Them
• What separates the top from
others?
• What is replicable/trainable?
• How will I determine both?
• WHAT:
Document the practices and
differentiating behaviors of top
performers, which can be replicated and
trained.
• HOW:
Through discussion, interviews, focus
groups and observation of the frontline
sales reps and managers identified
during Sales Performer Analysis.
• WHY:
To share practices broadly and
(re)design training around them.
Data Collection Methods
Using Top-Producer Analysis to Improve Sales Results – Mike Kunkle 2016 35
• Interviews
– In-person, phone, web conference
• Focus Groups
– In-person, webinar
• Field Observation
– top performers (A)
– average (B+, B, B-)
– ninth decile (C/D, not new)
– top new reps (great ramp-up)
Getting the Straight Scoop
• What really happens “out there”
• Account for the Hawthorne effect
• Trust, truth and strict confidentiality
• Autonomy, mastery and purpose *
* Thank you, Daniel Pink (author of Drive)
36
Top-Producer Analysis
What To Do With It?
Now what?
How TPA feeds your…
• Effective Selling Systems
• Effective Learning Systems
Using Top-Producer Analysis to Improve Sales Results – Mike Kunkle 2016 37
Effective Selling System
• Ensure market and buyer persona
knowledge
• Align sales process to buying
process with decision/exit criteria
• Create buyer engagement content
that aligns with decision/exit criteria
• Use sales enablement tools to
manage, share, and track content
and improve sales efficiency and
effectiveness
• Use a buyer-oriented, consultative,
solution-focused, outcome-driven
sales methodology
• Train reps to engage buyers in
valuable business conversations and
to create real value and
differentiation, through their
customer, business, financial, and
solution acumen
• Use analytics to track training,
content, sales behavior, and
outcomes
Effective Learning System
Analytics
Buyer Personas
Buying Process &
Exit Criteria
Buyer Engagement
Content Creation
Sales Process &
Methodology
Sales Enablement
Technology
Market &
Business Acumen
Using Top-Producer Analysis to Improve Sales Results – Mike Kunkle 2016 38
Effective Selling System
• Ensure market and buyer persona
knowledge
• Align sales process to buying
process with decision/exit criteria
• Create buyer engagement content
that aligns with decision/exit criteria
• Use sales enablement tools to
manage, share, and track content
and improve sales efficiency and
effectiveness
• Use a buyer-oriented, consultative,
solution-focused, outcome-driven
sales methodology
• Train reps to engage buyers in
valuable business conversations and
to create real value and
differentiation, through their
customer, business, financial, and
solution acumen
• Use analytics to track training,
content, sales behavior, and
outcomes
Effective Learning System
Analytics
Buyer Personas
Buying Process &
Exit Criteria
Buyer Engagement
Content Creation
Sales Process &
Methodology
Sales Enablement
Technology
Market &
Business Acumen
Using Top-Producer Analysis to Improve Sales Results – Mike Kunkle 2016 39
Effective Learning System
Using Top-Producer Analysis to Improve Sales Results – Mike Kunkle 2016 40
• Ensure training content matters
• Design great learning (active,
blended/flipped learning)
• Engage sales managers
• Sustain knowledge/transfer skills
• Coach to mastery
• Measure learning and
performance
• Manage performance
• Lead and manage change
Training
Content
Design
Managers
Transfer
Coaching
Measures
Perf. Mgt.
Integration
Alignment
Change
http://www.mikekunkle.com/2014/07/30/stop-wasting-money-on-sales-training/
Effective Learning System
Using Top-Producer Analysis to Improve Sales Results – Mike Kunkle 2016 41
• Ensure training content matters
• Design great learning (active,
blended/flipped learning)
• Engage sales managers
• Sustain knowledge/transfer skills
• Coach to mastery
• Measure learning and
performance
• Manage performance
• Lead and manage change
Training
Content
Design
Managers
Transfer
Coaching
Measures
Perf. Mgt.
Integration
Alignment
Change
http://www.mikekunkle.com/2014/07/30/stop-wasting-money-on-sales-training/
42
Appendix
Using Top-Producer Analysis to Improve Sales Results – Mike Kunkle 2016
Mike is a training and organization effectiveness
leader with special expertise in sales force
transformation
• After his initial years on the frontline in sales and sales
management, he spent the next 21 years as a corporate
manager or consultant, leading departments and projects
with one purpose – improve sales results.
• Today, in his role at Brainshark, Mike uses his in expertise
in best-in-class learning strategies, methods, processes,
and change leadership to develop the capabilities of sales
representatives and sales managers to drive business
results.
• Mike freely shares his own sales transformation
methodology, speaking at conferences and writing online
(see examples) and can be reached on various social
media sites.
• LinkedIn
• Twitter
• Google+
• SlideShare
Let’s
Connect!
About Mike Kunkle
43
About
Brainshark is a leading sales enablement company that helps businesses harness the power of
content to drive sales productivity.
With Brainshark, companies can:
• TRAIN: Prepare sales teams with on-demand training that accelerates onboarding and keeps
existing reps up-to-speed and in-the-know
• COACH: Hone performance with sales coaching that ensures reps make the most of every
buyer interaction
• ENGAGE: Empower salespeople with dynamic content that can be created quickly, imported
easily and accessed anywhere
• arm reps with the right content and resources for any selling situation to better engage buyers
and close more deals.
• ANALYZE: Brainshark analytics enable organizations to track sales content effectiveness and
make smarter decisions that drive results.
Thousands of companies – including more than half of the Fortune 100 – rely on Brainshark to
improve sales productivity and increase the impact of their sales, marketing, and training. Learn
more at www.brainshark.com
Using Top-Producer Analysis to Improve Sales Results – Mike Kunkle 2016 44
Using Top-Producer Analysis to Improve Sales Results – Mike Kunkle 2016 45
Links
Throughout this deck:
• This deck on SlideShare: http://bit.ly/mkatd2016
• Sales Nuances: https://www.linkedin.com/pulse/what-sales-nuances-why-you-should-care-mike-kunkle
• Sales Judgment: https://www.linkedin.com/pulse/20140816235048-834966-judgment-the-superpower-of-selling-skills
• Aligning Performance Levers: http://www.slideshare.net/MikeKunkle/aligning-performance-levers-for-breakthrough-sales-
results-082011
• Sales Onboarding: https://www.linkedin.com/pulse/20141006015758-834966-sales-onboarding-twice-as-good-half-the-time
• Hawthorne Effect: http://en.wikipedia.org/wiki/Hawthorne_effect
• Drive (Dan Pink’s book): http://www.danpink.com/drive
• Effective Learning Systems: http://www.mikekunkle.com/2014/07/30/stop-wasting-money-on-sales-training/
About Top-Producer Analysis:
• http://www.mikekunkle.com/2013/03/17/how-to-increase-sales-with-top-producer-practices-part1/
• http://www.mikekunkle.com/2013/03/20/how-to-increase-sales-with-top-producer-research-part-2/
• http://blogs.richardson.com/2013/08/05/which-top-producers-should-you-study-to-develop-sales-training-programs/
• http://www.insightsquared.com/2015/08/performance-lever-sales-ops/
• http://blog.hubspot.com/sales/sales-methodology-magic-or-madness
• https://www.td.org/Publications/Blogs/Sales-Enablement-Blog/2014/04/Improve-Sales-Performance-with-22Nd-Century-Selling-
Skills

Using Top-Producer Analysis to Improve Sales Results

  • 1.
    Using Top-Producer Analysisto Improve Sales Results Mike Kunkle Session TU218 . Tue, May 24 | 1:00 PM - 2:00 PM | 702/704 The Premier Conference for TD Professionals Come see us at Booth #858
  • 2.
    Some Housekeeping • Jointhe social circus! – @Mike_Kunkle – @Brainshark – Hashtags: #TopProdAnalysis #atd2016 • SlideShare: http://bit.ly/mkatd2016 • Breaking rules: Deck is a resource • Feel free to ask questions • Award-winning Brainshark solutions for improving sales readiness at booth #858. Using Top-Producer Analysis to Improve Sales Results – Mike Kunkle 2016 2
  • 3.
    Agenda • What isTop-Producer Analysis? • Why do it? • How to do it? • What to do with it? Using Top-Producer Analysis to Improve Sales Results – Mike Kunkle 2016 3
  • 4.
    Using Top-Producer Analysisto Improve Sales Results – Mike Kunkle 2016 4 “Advice about how to figure out what’s right for you, is better than advice about what to do.” ~ Mike Kunkle Hey, that’s me! Final thought before we get started…
  • 5.
  • 6.
    What is Top-ProducerAnalysis (TPA)? • Defining “top sales producer” • Defining “Top-Producer Analysis” • How bad practice has undermined “best practices” • The 5 Mistakes to avoid during TPA • Some context – where TPA fits. Using Top-Producer Analysis to Improve Sales Results – Mike Kunkle 2016 6
  • 7.
    Defining “Top SalesProducer” My definition: • A sales rep who has an acceptable blend of the results, mindset, traits, knowledge, skills, and behaviors that you want to replicate in your sales force. Consider: • How the top 4% & 16% are different • What criteria/KPIs/results matter most for the future? • Is the rep truly responsible for their results? • Is what the rep does, replicable, repeatable and trainable? • Ask sales leadership to identify study participants but validate with data. Top 4% Bottom 20% Top 4% Rest of Top 20% (16%) Middle 60% Above Average Below Average Average Bottom 20% 7Using Top-Producer Analysis to Improve Sales Results – Mike Kunkle 2016
  • 8.
    Defining “Top-Producer Analysis” Mydefinition: • A study to determine the (mindset, traits,) knowledge, skills, and behaviors that top- producers possess, that differentiate them from other sales reps. Consider: • Are you doing this for selection, training, or both? • Do you have enough participants for study reliability and validity? • Should you focus on the top 4% or the rest of the top 20%? Or both? • Do you have the ability to analyze/crunch data or a resource who can? Top 4% Bottom 20% Top 4% Rest of Top 20% (16%) Middle 60% Above Average Below Average Average Bottom 20% Using Top-Producer Analysis to Improve Sales Results – Mike Kunkle 2016 8
  • 9.
    Best Practices vs.Top-Producer Practices Some common concerns on “best”… • “Best practices aren’t really ‘best’… they’re just good practices.” • “Who determines whether something is best or not? Isn’t that immediately invalid?” • “I’ve never seen a best practices study amount to anything.” • “I tried that at a previous company and it was a waste of time.” * * Grrr… Using Top-Producer Analysis to Improve Sales Results – Mike Kunkle 2016 9
  • 10.
    Best Practices vs.Top-Producer Practices Why TPS is better than “best” • Sales Utility Belt concept • Sales Nuance is the new black • Judgment is the superpower of selling skills. Sales Judgment: https://www.linkedin.com/pulse/20140816235048-834966-judgment-the-superpower-of-selling-skills Sales Nuance: https://www.linkedin.com/pulse/what-sales-nuances-why-you-should-care-mike-kunkle Using Top-Producer Analysis to Improve Sales Results – Mike Kunkle 2016 10
  • 11.
    The 5 Mistakesof TPA • Mistake 1: Studying the wrong “top reps” and therefore, cloning the wrong behaviors • Mistake 2: Ignoring differentiators, compared to average producers (continue | stop | start) • Mistake 3: Leaving out the Voice of the Customer • Mistake 4: Forgetting “what to STOP doing” • Mistake 5: Implementing the resulting training ineffectively. Using Top-Producer Analysis to Improve Sales Results – Mike Kunkle 2016 11
  • 12.
    Sales Performer Analysis Sales & Sales Manager Selection Performance Lever Identification Top-Producer Practice Capture& Analysis Sales & Sales Manager Training Performance Lever Alignment Using Top-Producer Analysis to Improve Sales Results – Mike Kunkle 2016 12 http://www.slideshare.net/MikeKunkle/aligning-performance-levers-for-breakthrough-sales-results-082011 How TPA Fits Sales Performance Levers • 6-Project Series Performance Levers: • Critical competencies, knowledge, skills, behaviors and conditions which must be present for ethical, sustained, high-performance to occur.
  • 13.
    Sales Performer Analysis Sales & Sales Manager Selection Performance Lever Identification Top-Producer Practice Capture& Analysis Sales & Sales Manager Training Performance Lever Alignment Using Top-Producer Analysis to Improve Sales Results – Mike Kunkle 2016 13 Top-Producer Analysis http://www.slideshare.net/MikeKunkle/aligning-performance-levers-for-breakthrough-sales-results-082011 How TPA Fits Sales Performance Levers • 6-Project Series Performance Levers: • Critical competencies, knowledge, skills, behaviors and conditions which must be present for ethical, sustained, high-performance to occur.
  • 14.
  • 15.
    Why Bother withTPA? Primary Reasons • More effective sales onboarding • Better business outcomes • The mythical and elusive Sales Training ROI. Using Top-Producer Analysis to Improve Sales Results – Mike Kunkle 2016 15 Sales onboarding: https://www.linkedin.com/pulse/20141006015758-834966-sales-onboarding-twice-as-good-half-the-time
  • 16.
    Why Bother? TheOutcomes | Bottom-line Results Yup, Real Examples: • A $398MM revenue increase, $9.96MM net profit increase and a 400% ROI • Increased sales/rep by 47% through changes in territory management & sales coaching • Improved average profitability/rep by 11% in 4 months • Improved processing efficiency (order pull-through) by 16% in 6 months. • Newly-hired 4-month employees outperformed a control group of 5-year employees • Increased sales/rep in the 3-months after training by 2.3 per month (average revenue increase of $183K per class or $36.6MM in 12 months). Using Top-Producer Analysis to Improve Sales Results – Mike Kunkle 2016 16
  • 17.
    Why Bother withTPA? Value-Added Reasons: • Improved relationship/credibility with Sales • Land and expand strategy • Buy-in for initiatives • Helps at budget time • Career impacts. Using Top-Producer Analysis to Improve Sales Results – Mike Kunkle 2016 17
  • 18.
  • 19.
  • 20.
    Sales Performer Analysis Whoto Study • What is my performance criteria? • What are my performer categories? • Who is in which buckets? Using Top-Producer Analysis to Improve Sales Results – Mike Kunkle 2016 20 • WHAT: ‒ Identify top, average & low producing sales reps. ‒ Identify top, average & low producing sales managers. • HOW: ‒ Analyze a year of sales data & create a weighted scoring system across multiple metrics/products. ‒ Some discussion & surveys with managers. • WHY: ‒ Provides a mix of performers to study in various ways, to determine true differentiating factors.
  • 21.
    Example of SalesMetrics / Performance Criteria Using Top-Producer Analysis to Improve Sales Results – Mike Kunkle 2016 21 Metrics Quarterly Weighting * Create a weighted scoring system… # of Sales Med-High (2-3) $ Volume Low (1) Velocity Med (1-2) Avg # Sales/Rep High (3-4) Avg $ Vol/Rep Med-High (2-3) Cross-Sell Percent Med (1-2) * Review the last 12 months & the last quarter. Consider weighting the quarter more heavily. Blend the scores.
  • 22.
    Example of PerformerCategories Using Top-Producer Analysis to Improve Sales Results – Mike Kunkle 2016 22 Top New Reps New = >30 days, <271 days 39 Top = In the Top Quintile of all metrics Top Seasoned Reps Seasoned = >365 days (many 5+ years) 307 Top = In the Top Quintile of all metrics Average Reps Selected randomly, between mean and median production 298 Low Producer Reps Selected randomly from the bottom 20% 348 Top SM Producers Top = In the Top Quintile of all metrics, personal production 15 Top SM Team Managers Top = Top Quintile all metrics, w/o SM results + survey of their Mgr 52 Top SM Both Top = In Top Producer group personally + Top Quintile all metrics w/o SM results + survey of their Mgr 5 Average SM (Team) Selected randomly, between mean and median production 79 Low Performing SM (Team) Selected randomly from the bottom 20% 32 Often “top” includes tiers: 4% | 10% | 15% | 20% n =
  • 23.
    Example of Analysis– Sales Reps Using Top-Producer Analysis to Improve Sales Results – Mike Kunkle 2016 23 Low High 4th Quartile Mean Avg. Median Sort Descending Highlight 4th Quartile Apply Weighting Repeat & Total Highlight 4th Quartile
  • 24.
    Consider things like: •Avg Productivity ‒ Avg # and $/rep/time period • Engagement: % of team producing and/or goal %/rep • Total Team Sales: $ and # • Avg Time to 1st Sale (new reps) • Avg Time to productivity (new) • Pipeline Stats: ‒ Conversion % ‒ Velocity • Cross-sell Ratios or Penetration • Trend Indicators (actual # last month, avg/month over 13 weeks, avg/month past year) • Survey Their Managers ‒ Remove the “luck” factor ‒ Remove “inherited territory” ‒ Remove “one great rep.” Example of Analysis – Sales Managers Using Top-Producer Analysis to Improve Sales Results – Mike Kunkle 2016 24
  • 25.
    Data Crunch Using Top-ProducerAnalysis to Improve Sales Results – Mike Kunkle 2016 25 Partner with smart people with stats software to crunch data
  • 26.
  • 27.
    Using Top-Producer Analysisto Improve Sales Results – Mike Kunkle 2016 27 • WHAT: ‒ Identify the competencies, knowledge, skills, behaviors and conditions that must exist for ethical, sustained, high performance to occur. ‒ Formulate hypotheses about what the levers are for frontline sales and sales management roles. ‒ Confirm and validate the levers through research. • HOW: Through discussion, surveys, interviews, focus groups, and observation of frontline sales reps and their managers. • WHY: This will confirm where to focus your efforts capturing Top-Producer Practices, which provides training/coaching content. Performance Lever ID What to Study • What are the Performance Levers? • What’s working? • Why? • How will you figure it out? REMINDER: Performance Levers… • Critical competencies, knowledge, skills, behaviors and conditions which must be present for ethical, sustained, high-performance to occur. http://www.slideshare.net/MikeKunkle/aligning-performance-levers-for-breakthrough-sales-results-082011
  • 28.
    Formulating the Hypotheses •Start with known practices • Talk with: – Executives – Other leaders – Frontline sales reps – Frontline sales managers – Sales operations, enablement, and other sales support staff – And, hopefully, customers • Label the big buckets and detail the tasks • Don’t get married – you’re just dating • Build surveys to confirm the hypotheses. Using Top-Producer Analysis to Improve Sales Results – Mike Kunkle 2016 28
  • 29.
    Using Top-Producer Analysisto Improve Sales Results – Mike Kunkle 2016 29 Identify the high-level Performance Levers (hypotheses) Document the potential tasks for the Performance Lever Ask what you’ve missed Survey Design
  • 30.
    Using Top-Producer Analysisto Improve Sales Results – Mike Kunkle 2016 30 Survey Design Clearly define Performance Lever Define the role Add instructions for completing the survey
  • 31.
    Using Top-Producer Analysisto Improve Sales Results – Mike Kunkle 2016 31 Survey Design • Rate the statement provided. • How much do you agree it’s a Performance Lever? • If rated 1-2, next question. • If rated 3-5: • Importance & Difficulty • And in some cases: • Frequency: Actual & Should • In addition, you should ask what you missed, by Lever, and a handful of other questions – such as normal demographics & Continue | Start | Stop. Using empathy statements to acknowledge a prospect’s situation/feelings Survey Design
  • 32.
    Look familiar? Using Top-ProducerAnalysis to Improve Sales Results – Mike Kunkle 2016 32 Partner with smart people with stats software to crunch data
  • 33.
  • 34.
    Using Top-Producer Analysisto Improve Sales Results – Mike Kunkle 2016 34 TPA: Capture & Analysis How to Study Them • What separates the top from others? • What is replicable/trainable? • How will I determine both? • WHAT: Document the practices and differentiating behaviors of top performers, which can be replicated and trained. • HOW: Through discussion, interviews, focus groups and observation of the frontline sales reps and managers identified during Sales Performer Analysis. • WHY: To share practices broadly and (re)design training around them.
  • 35.
    Data Collection Methods UsingTop-Producer Analysis to Improve Sales Results – Mike Kunkle 2016 35 • Interviews – In-person, phone, web conference • Focus Groups – In-person, webinar • Field Observation – top performers (A) – average (B+, B, B-) – ninth decile (C/D, not new) – top new reps (great ramp-up) Getting the Straight Scoop • What really happens “out there” • Account for the Hawthorne effect • Trust, truth and strict confidentiality • Autonomy, mastery and purpose * * Thank you, Daniel Pink (author of Drive)
  • 36.
  • 37.
    Now what? How TPAfeeds your… • Effective Selling Systems • Effective Learning Systems Using Top-Producer Analysis to Improve Sales Results – Mike Kunkle 2016 37
  • 38.
    Effective Selling System •Ensure market and buyer persona knowledge • Align sales process to buying process with decision/exit criteria • Create buyer engagement content that aligns with decision/exit criteria • Use sales enablement tools to manage, share, and track content and improve sales efficiency and effectiveness • Use a buyer-oriented, consultative, solution-focused, outcome-driven sales methodology • Train reps to engage buyers in valuable business conversations and to create real value and differentiation, through their customer, business, financial, and solution acumen • Use analytics to track training, content, sales behavior, and outcomes Effective Learning System Analytics Buyer Personas Buying Process & Exit Criteria Buyer Engagement Content Creation Sales Process & Methodology Sales Enablement Technology Market & Business Acumen Using Top-Producer Analysis to Improve Sales Results – Mike Kunkle 2016 38
  • 39.
    Effective Selling System •Ensure market and buyer persona knowledge • Align sales process to buying process with decision/exit criteria • Create buyer engagement content that aligns with decision/exit criteria • Use sales enablement tools to manage, share, and track content and improve sales efficiency and effectiveness • Use a buyer-oriented, consultative, solution-focused, outcome-driven sales methodology • Train reps to engage buyers in valuable business conversations and to create real value and differentiation, through their customer, business, financial, and solution acumen • Use analytics to track training, content, sales behavior, and outcomes Effective Learning System Analytics Buyer Personas Buying Process & Exit Criteria Buyer Engagement Content Creation Sales Process & Methodology Sales Enablement Technology Market & Business Acumen Using Top-Producer Analysis to Improve Sales Results – Mike Kunkle 2016 39
  • 40.
    Effective Learning System UsingTop-Producer Analysis to Improve Sales Results – Mike Kunkle 2016 40 • Ensure training content matters • Design great learning (active, blended/flipped learning) • Engage sales managers • Sustain knowledge/transfer skills • Coach to mastery • Measure learning and performance • Manage performance • Lead and manage change Training Content Design Managers Transfer Coaching Measures Perf. Mgt. Integration Alignment Change http://www.mikekunkle.com/2014/07/30/stop-wasting-money-on-sales-training/
  • 41.
    Effective Learning System UsingTop-Producer Analysis to Improve Sales Results – Mike Kunkle 2016 41 • Ensure training content matters • Design great learning (active, blended/flipped learning) • Engage sales managers • Sustain knowledge/transfer skills • Coach to mastery • Measure learning and performance • Manage performance • Lead and manage change Training Content Design Managers Transfer Coaching Measures Perf. Mgt. Integration Alignment Change http://www.mikekunkle.com/2014/07/30/stop-wasting-money-on-sales-training/
  • 42.
  • 43.
    Using Top-Producer Analysisto Improve Sales Results – Mike Kunkle 2016 Mike is a training and organization effectiveness leader with special expertise in sales force transformation • After his initial years on the frontline in sales and sales management, he spent the next 21 years as a corporate manager or consultant, leading departments and projects with one purpose – improve sales results. • Today, in his role at Brainshark, Mike uses his in expertise in best-in-class learning strategies, methods, processes, and change leadership to develop the capabilities of sales representatives and sales managers to drive business results. • Mike freely shares his own sales transformation methodology, speaking at conferences and writing online (see examples) and can be reached on various social media sites. • LinkedIn • Twitter • Google+ • SlideShare Let’s Connect! About Mike Kunkle 43
  • 44.
    About Brainshark is aleading sales enablement company that helps businesses harness the power of content to drive sales productivity. With Brainshark, companies can: • TRAIN: Prepare sales teams with on-demand training that accelerates onboarding and keeps existing reps up-to-speed and in-the-know • COACH: Hone performance with sales coaching that ensures reps make the most of every buyer interaction • ENGAGE: Empower salespeople with dynamic content that can be created quickly, imported easily and accessed anywhere • arm reps with the right content and resources for any selling situation to better engage buyers and close more deals. • ANALYZE: Brainshark analytics enable organizations to track sales content effectiveness and make smarter decisions that drive results. Thousands of companies – including more than half of the Fortune 100 – rely on Brainshark to improve sales productivity and increase the impact of their sales, marketing, and training. Learn more at www.brainshark.com Using Top-Producer Analysis to Improve Sales Results – Mike Kunkle 2016 44
  • 45.
    Using Top-Producer Analysisto Improve Sales Results – Mike Kunkle 2016 45 Links Throughout this deck: • This deck on SlideShare: http://bit.ly/mkatd2016 • Sales Nuances: https://www.linkedin.com/pulse/what-sales-nuances-why-you-should-care-mike-kunkle • Sales Judgment: https://www.linkedin.com/pulse/20140816235048-834966-judgment-the-superpower-of-selling-skills • Aligning Performance Levers: http://www.slideshare.net/MikeKunkle/aligning-performance-levers-for-breakthrough-sales- results-082011 • Sales Onboarding: https://www.linkedin.com/pulse/20141006015758-834966-sales-onboarding-twice-as-good-half-the-time • Hawthorne Effect: http://en.wikipedia.org/wiki/Hawthorne_effect • Drive (Dan Pink’s book): http://www.danpink.com/drive • Effective Learning Systems: http://www.mikekunkle.com/2014/07/30/stop-wasting-money-on-sales-training/ About Top-Producer Analysis: • http://www.mikekunkle.com/2013/03/17/how-to-increase-sales-with-top-producer-practices-part1/ • http://www.mikekunkle.com/2013/03/20/how-to-increase-sales-with-top-producer-research-part-2/ • http://blogs.richardson.com/2013/08/05/which-top-producers-should-you-study-to-develop-sales-training-programs/ • http://www.insightsquared.com/2015/08/performance-lever-sales-ops/ • http://blog.hubspot.com/sales/sales-methodology-magic-or-madness • https://www.td.org/Publications/Blogs/Sales-Enablement-Blog/2014/04/Improve-Sales-Performance-with-22Nd-Century-Selling- Skills