5G and 6G refer to generations of mobile network technology, each representin...
Inp tooptimmempropslinkedinpost 25mar18_003
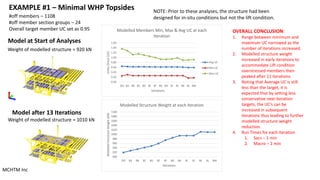
1. OVERALL CONCLUSION:
1. Range between minimum and
maximum UC narrowed as the
number of iterations increased.
2. Modelled structure weight
increased in early iterations to
accommodate Lift condition
overstressed members then
peaked after 11 iterations
3. Noting that Average UC is still
less than the target, it is
expected that by setting less
conservative next-iteration
targets, the UC’s can be
increased in subsequent
iterations thus leading to further
modelled structure weight
reduction.
4. Run Times for each iteration
1. Sacs – 1 min
2. Macro – 2 min
Model at Start of Analyses
MCHTM Inc
EXAMPLE #1 – Minimal WHP Topsides
Model after 13 Iterations
Weight of modelled structure = 920 kN
Weight of modelled structure = 1010 kN
#off members – 1108
#off member section groups – 24
Overall target member UC set as 0.95
NOTE: Prior to these analyses, the structure had been
designed for in-situ conditions but not the lift condition.
0.00
0.20
0.40
0.60
0.80
1.00
1.20
1.40
1.60
OO 8A 8B 8C 8D 8E 8F 8G 8H 8I 8J 8K 8L 8M
UnityCheck(UC)
Iterations
Modelled Members Min, Max & Avg UC at each
Iteration
Avg UC
Min UC
Max UC
900
920
940
960
980
1000
1020
1040
1060
1080
1100
OO 8A 8B 8C 8D 8E 8F 8G 8H 8I 8J 8K 8L 8M
ModelledStructureWeight(kN)
Iterations
Modelled Structure Weight at each Iteration