Market Indicators - General Overview - October 2014
•Download as PPTX, PDF•
0 likes•322 views

The document provides a market snapshot comparing real estate data from October 2014 to October 2013 and from October 2014 to September 2014 for single family homes and condo/townhouses across several counties. The data includes inventory levels, closed sales, median and average prices, total dollar volume, days on market, and new listings. Charts also show historical housing market trends from 2003 through 2014.

Recommended
Recommended
More Related Content
What's hot
What's hot (19)
Viewers also liked
Similar to Market Indicators - General Overview - October 2014
Similar to Market Indicators - General Overview - October 2014 (20)
More from MLSListings Inc
More from MLSListings Inc (20)
Recently uploaded
Recently uploaded (20)
Market Indicators - General Overview - October 2014
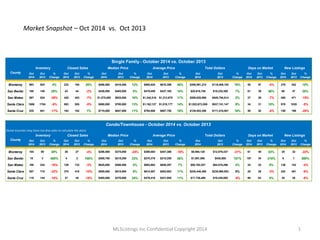
- 1. Market Snapshot – Oct 2014 vs. Oct 2013 Single Family - October 2014 vs. October 2013 Inventory Closed Sales Median Price Average Price Total Dollars Days on Market New Listings Condo/Townhouse - October 2014 vs. October 2013 Inventory Closed Sales Median Price Average Price Total Dollars Days on Market New Listings MLSListings Inc Confidential Copyright 2014 1 Oct 2014 Oct 2013 % Change Oct 2014 Oct 2013 % Change Oct 2014 Oct 2013 % Change Oct 2014 Oct 2013 % Change Oct 2014 Oct 2013 % Change Oct 2014 Oct 2013 % Change Oct 2014 Oct 2013 % Change County Monterey 963 924 4% 232 194 20% $466,500 $416,050 12% $900,824 $610,356 48% $208,991,274 $118,409,152 76% 55 57 -4% 279 242 15% San Benito 180 140 29% 43 44 -2% $426,000 $405,000 5% $479,459 $437,165 10% $20,616,749 $19,235,300 7% 61 39 56% 60 47 28% San Mateo 597 824 -28% 420 453 -7% $1,075,000 $925,000 16% $1,342,016 $1,213,675 11% $559,620,969 $549,794,814 2% 27 29 -7% 400 471 -15% Santa Clara 1606 1704 -6% 883 926 -5% $880,000 $780,000 13% $1,162,127 $1,018,177 14% $1,022,672,559 $937,741,147 9% 34 31 10% 976 1028 -5% Santa Cruz 535 641 -17% 163 162 1% $715,000 $647,000 11% $794,806 $687,750 16% $129,553,388 $111,415,501 16% 50 52 -4% 158 198 -20% (Some Counties may have too few sales to calculate the data) Oct 2014 Oct 2013 % Change Oct 2014 Oct 2013 % Change Oct 2014 Oct 2013 % Change Oct 2014 Oct 2013 % Change Oct 2014 Oct 2013 % Change Oct 2014 Oct 2013 % Change Oct 2014 Oct 2013 % Change County Monterey 104 80 30% 26 27 -4% $286,500 $375,000 -24% $369,004 $447,386 -18% $9,594,120 $12,079,437 -21% 61 40 53% 25 32 -22% San Benito 15 3 400% 4 2 100% $265,750 $215,250 23% $270,375 $215,250 26% $1,081,500 $430,500 151% 107 34 215% 6 1 500% San Mateo 188 224 -16% 129 133 -3% $625,000 $598,500 4% $683,663 $640,297 7% $88,192,527 $84,519,296 4% 24 22 9% 136 142 -4% Santa Clara 557 710 -22% 375 418 -10% $555,000 $515,000 8% $614,507 $553,863 11% $230,440,488 $230,960,953 0% 28 29 -3% 422 451 -6% Santa Cruz 118 144 -18% 37 45 -18% $465,000 $376,000 24% $479,416 $431,955 11% $17,738,400 $19,438,000 -9% 66 63 5% 35 38 -8%
- 2. Market Snapshot – Oct 2014 vs. Sep 2014 Single Family - Current Month vs. Prior Month - October 2014 vs. September 2014 Inventory Closed Sales Median Price Average Price Total Dollars Days on Market New Listings Condo/Townhouse - Current Month vs. Prior Month - October 2014 vs. September 2014 Inventory Closed Sales Median Price Average Price Total Dollars Days on Market New Listings MLSListings Inc Confidential Copyright 2014 2 Sep 2014 Oct 2014 % Change Sep 2014 Oct 2014 % Change Sep 2014 Oct 2014 % Change Sep 2014 Oct 2014 % Change Sep 2014 Oct 2014 % Change Sep 2014 Oct 2014 % Change Sep 2014 Oct 2014 % Change County Monterey 991 963 -3% 208 232 12% $458,750 $466,500 2% $797,242 $900,824 13% $165,826,383 $208,991,274 26% 72 55 -24% 284 279 -2% San Benito 168 180 7% 36 43 19% $429,500 $426,000 -1% $457,272 $479,459 5% $16,461,800 $20,616,749 25% 31 61 97% 53 60 13% San Mateo 695 597 -14% 398 420 6% $1,077,500 $1,075,000 0% $1,389,242 $1,342,016 -3% $560,139,883 $559,620,969 0% 29 27 -7% 515 400 -22% Santa Clara 1765 1606 -9% 873 883 1% $852,500 $880,000 3% $1,110,888 $1,162,127 5% $968,634,492 $1,022,672,559 6% 30 34 13% 1165 976 -16% Santa Cruz 601 535 -11% 183 163 -11% $675,000 $715,000 6% $786,200 $794,806 1% $143,874,632 $129,553,388 -10% 50 50 0% 207 158 -24% (Some Counties may have too few sales to calculate the data) Sep 2014 Oct 2014 % Change Sep 2014 Oct 2014 % Change Sep 2014 Oct 2014 % Change Sep 2014 Oct 2014 % Change Sep 2014 Oct 2014 % Change Sep 2014 Oct 2014 % Change Sep 2014 Oct 2014 % Change County Monterey 117 104 -11% 21 26 24% $365,000 $286,500 -22% $389,214 $369,004 -5% $8,173,500 $9,594,120 17% 72 61 -15% 46 25 -46% San Benito 13 15 15% 3 4 33% $325,000 $265,750 -18% $308,400 $270,375 -12% $925,200 $1,081,500 17% 12 107 792% 6 6 0% San Mateo 195 188 -4% 131 129 -2% $627,000 $625,000 0% $662,886 $683,663 3% $96,838,149 $88,192,527 -9% 21 24 14% 160 136 -15% Santa Clara 622 557 -10% 372 375 1% $535,000 $555,000 4% $600,782 $614,507 2% $223,491,195 $230,440,488 3% 24 28 17% 444 422 -5% Santa Cruz 123 118 -4% 45 37 -18% $425,800 $465,000 9% $458,778 $479,416 4% $20,645,020 $17,738,400 -14% 38 66 74% 44 35 -20%
- 3. Single Family Business Outlook – Home Counties Oct ’13 vs. Oct ’14 MLSListings Inc Confidential Copyright 2014 3 3
- 4. Inventory, Closed Sales, New Listings - Home Counties Jan ’03 – Oct ’14 MLSListings Inc Confidential Copyright 2014 4 4
- 5. Single Family + Condo/Townhouse Inventory - Home Counties Jan ’03 – Oct ’14 MLSListings Inc Confidential Copyright 2014 5 5
- 6. Single Family + Condo/Townhouse Inventory - Home Counties Jan ’05 – Oct ’14 MLSListings Inc Confidential Copyright 2014 6 6
- 7. Single Family Inventory - Home Counties Jan ’04 – Oct ’14 MLSListings Inc Confidential Copyright 2014 7 7
- 8. Single Family Inventory - Home Counties Oct (2004 – 2014) MLSListings Inc Confidential Copyright 2014 8 8
- 9. Single Family Inventory - Home Counties Oct (2004 – 2014) MLSListings Inc Confidential Copyright 2014 9 9
- 10. Single Family Months of Inventory – San Mateo, Santa Clara, Santa Cruz Mar ’03 – Oct ’14 (Rolling Three Month Average) MLSListings Inc Confidential Copyright 2014 10 10
- 11. Single Family Months of Inventory – Monterey and San Benito Counties Mar ’03 – Oct ’14 (Rolling Three Month Average) MLSListings Inc Confidential Copyright 2014 11 11
- 12. Single Family + Condo/Townhouse Closed Sales – Home Counties Jan ’03 – Oct ’14 MLSListings Inc Confidential Copyright 2014 12 12
- 13. Single Family + Condo/Townhouse Closed Sales - Home Counties Jan ’05 – Oct ’14 MLSListings Inc Confidential Copyright 2014 13 13
- 14. Single Family Closed Sales – Home Counties Jan ’04 – Oct ’14 MLSListings Inc Confidential Copyright 2014 14 14
- 15. Single Family Closed Sales – Home Counties Oct (2004 – 2014) MLSListings Inc Confidential Copyright 2014 15 15
- 16. Single Family Closed Sales – Home Counties Oct (2004 – 2014) MLSListings Inc Confidential Copyright 2014 16 16
- 17. Single Family + Condo/Townhouse New Listings - Home Counties Jan ’03 – Oct ’14 MLSListings Inc Confidential Copyright 2014 17 17
- 18. Single Family + Condo/Townhouse New Listings - Home Counties Jan ’05 – Oct ’14 MLSListings Inc Confidential Copyright 2014 18 18
- 19. Single Family New Listings - Home Counties Jan ’04 – Oct ’14 MLSListings Inc Confidential Copyright 2014 19 19
- 20. Single Family New Listings - Home Counties Oct (2004 – 2014) MLSListings Inc Confidential Copyright 2014 20 20
- 21. Single Family New Listings - Home Counties Oct (2004 – 2014) MLSListings Inc Confidential Copyright 2014 21 21
- 22. Single Family + Condo/Townhouse Median Price - Home Counties Jan ’05 – Oct ’14 MLSListings Inc Confidential Copyright 2014 22 22
- 23. Single Family Median Prices - Home Counties Jan ’04 – Oct ’14 MLSListings Inc Confidential Copyright 2014 23 23
- 24. Single Family Median Prices - Home Counties Oct (2004 – 2014) MLSListings Inc Confidential Copyright 2014 24 24
- 25. Single Family Median Prices - Home Counties Oct (2004 – 2014) MLSListings Inc Confidential Copyright 2014 25 25
- 26. Single Family Average Price - Home Counties Jan ’04 – Oct ’14 MLSListings Inc Confidential Copyright 2014 26 26
- 27. Single Family Average Price - Home Counties Oct (2004 – 2014) MLSListings Inc Confidential Copyright 2014 27 27
- 28. Single Family Average Price - Home Counties Oct (2004 – 2014) MLSListings Inc Confidential Copyright 2014 28 28
- 29. Condo/Townhouse Business Outlook – Home Counties Oct ’13 vs. Oct ’14 MLSListings Inc Confidential Copyright 2014 29 29
- 30. Condo/Townhouse Months of Inventory – San Mateo, Santa Clara, Santa Cruz Mar ’03 – Oct ’14 (Rolling Three Month Average) MLSListings Inc Confidential Copyright 2014 30 30
- 31. Condo/Townhouse Months of Inventory – Monterey and San Benito Counties Mar ’03 – Oct ’14 (Rolling Three Month Average) MLSListings Inc Confidential Copyright 2014 31 31