Recommended

Recommended
More Related Content
Similar to Educational and Economic Disparities in Chicago neighborhoods
Similar to Educational and Economic Disparities in Chicago neighborhoods (20)
Recently uploaded
Recently uploaded (20)
Educational and Economic Disparities in Chicago neighborhoods
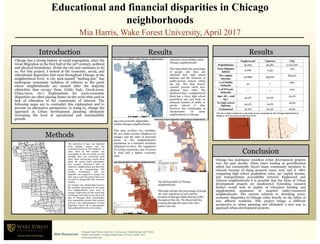
- 1. Contact Information: Web Resources: Acknowledgements: Educational and financial disparities in Chicago neighborhoods Mia Harris, Wake Forest University, April 2017 Chicago has a strong history of racial segregation, since the Great Migration in the first half of the 20th century, political and physical boundaries divide the city and continues to do so. For this project, I looked at the economic, social, and educational disparities that exist throughout Chicago at the neighborhood level. A city nick-named “melting-pot,” has undergone systematic isolation of cultures to the point where neighborhoods are named after the majority ethnicities that occupy them (Little Italy, Greek-town, China-town, etc.) Explanations for socio-economic disparities are often placing blame on the work ethic and/or lack of education of the community of interest. The following maps are to contradict this explanation and to provide an alternative perspective; in doing so, change the approach in Urban development planning ultimately increasing the level of operational and sustainability growth. Introduction Methods Results Chicago has undergone countless urban development projects over the past decade. Often times leading to gentrification which has consistently forced many community members to relocate because of rising property taxes, rent, and X. After comparing high school graduation rates, per capital income, and transportation accessibility between Englewood and Uptown neighborhoods it is possible that the focus of Urban development projects are misdirected. Extending research further would look at quality of education funding and supplemental assistance to targeted under-resourced neighborhoods. The current solution to shrinking socio- economic disparities in Chicago relies heavily on the influx of new affluent residents. This project brings a different perspective to urban planning and ultimately a new way to approach urban development projects. Conclusion Results Austin South Deering Ashburn Englewood Roseland New City O'Hare Hegewisch Dunning Beverly Little Village Riverdale Chatham Norwood Park Portage Park Clearing Humboldt Park Uptown Irving Park Garfield Ridge Lake View West Lawn West Pullman Morgan Park Belmont Cragin South Shore Garfield Park North Park South Chicago West Ridge Grand Crossing Loop Gage Park Avondale Douglas North Lawndale West Town Logan Square West Loop Lower West Side Little Italy, UIC Albany Park Woodlawn Galewood East SidePullman Chicago Lawn Auburn Gresham Brighton Park Bridgeport Lincoln Park Lincoln Square Jefferson Park North Center Mount Greenwood Washington Heights Sauganash,Forest Glen Hyde Park Archer Heights Edgewater Hermosa River North Kenwood Calumet Heights Avalon Park Grand Boulevard Bucktown Montclare Mckinley Park West Elsdon Washington Park United Center Wicker Park Near South Side Rogers Park Oakland Old Town Burnside Jackson Park Fuller Park Edison Park Streeterville Armour Square Chinatown Museum Campus Grant Park Andersonville Gold Coast Ukrainian Village East Village Wrigleyville Sheffield & DePaul Boystown Millenium Park Printers Row Greektown Streeterville The collection of data was obtained from multiple sources and was condensed based on FID numbers. In cases when an FID number was unavailable or did not match up with multiple data sets (occurring most often when referencing census block data), the census block information was crossed referenced with its respective neighborhood and then that name to its corresponding FID number. Fortunately, only one shapefile was required to project the data and as such this project there was no need to change/alter the reference system. To compare the relationship between the variables represented in the maps two neighborhoods were used as models, Englewood (on the south side of Chicago) and Uptown (on the north side of Chicago). Both communities have populations greater than 30,000 and are a fair representation of racial disparities based off of demographic data gathered from the 2010 census. ¯ Legend Grocery Stores/Population Grocery Stores/Population < -1.5 Std. Dev. -1.5 - -0.50 Std. Dev. -0.50 - 0.50 Std. Dev. 0.50 - 1.5 Std. Dev. 1.5 - 2.3 Std. Dev. Per capita Income Per capita Income 0.0 0.010 - 20000 21000 - 29000 30000 - 43000 44000 - 72000 Food and economic disparities within Chicago neighborhoods Age demographic of Chicago neighborhoods Education accessibility within Chicago neighborhoods Legend Chicago Public Schools CTA_RailLines Percentage of population without a high school diploma 16 - 23 24 - 32 33 - 38 39 - 41 42 - 50 0 4 8 12 162 Miles 0 4 8 12 162 Miles 0 4 8 12 162 Miles ¯ ¯ Age demographic of Chicago neighborhoods: This map overlays the percentage of people 18> and <65(shown in red) and the location of Chicago Public Schools (CPS) throughout the city. The black bold line running through the map is the city’s public train line Age and economic disparities within Chicago neighborhoods: This map overlays two variables, the per capita income (displayed in orange) and the ratio of groceries stores to the neighborhood’s population as a standard deviation (displayed in blue). The magnitude of overlap represents ease of access to food and a higher economic class. Education accessibility within Chicago neighborhoods: This map details the percentage of people who have not obtained their high school diploma and the locations of public/private schools within the city. The data doesn’t consider persons which have obtained their GED. The likelihood that a neighborhood block has a lower high school graduation rate and lacks an adequate number of public or private schools is slim. However this relationship in characteristic of many neighborhoods in Chicago Englewood Uptown City Populations 30,654 56,362 2,722,000 Area (Square miles) 3.089 2.351 234 Per capita Income $11888 $35787 $33437 # of Public Schools 32 7 660 # of Private Schools 7 7 404 Age: 18<, and 65< 43.4% 22.2% 33.4% No high school diploma 29.4% 13.6% 18.9% Uninsured 20.6% 20.3% 18.5% This set of data is based on a city-wide survey conducted by the Chicago Department of Health in 2012 and census data from 2010. Chicago Data Portal, Data.Goc, Census.gov, Epidemiology and Public Health Informatics, Chicago Department of Public Health, and Censusreporter.org
Editor's Notes
- including census.gov, data.cityofchicago.org, city-data.org,