Measuring solar radius_from_space_during_the_2003_2006_mercury_transits
LPSC 2016 Poster_3
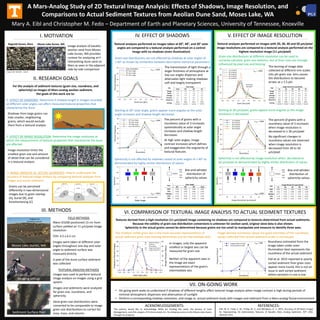
1. VI. COMPARISON OF TEXTURAL IMAGE ANALYSIS TO ACTUAL SEDIMENT TEXTURES
A Mars-Analog Study of 2D Textural Image Analysis: Effects of Shadows, Image Resolution, and
Comparisons to Actual Sediment Textures from Aeolian Dune Sand, Moses Lake, WA
Mary A. Eibl and Christopher M. Fedo – Department of Earth and Planetary Sciences, University of Tennessee, Knoxville
I. MOTIVATION
III. METHODS
FIELD METHODS
Nikon D3200 positioned 13 cm from
surface yielded an 11 μm/pixel image
resolution
FOV: 4.5 x 6.5 cm
Images were taken at different solar
angles throughout one day and solar
angle to sediment surface was
measured directly
A peel of the dune surface sediment
was collected
1. EFFECT OF SHADOWS: Determine if shadow length in images recorded
at different solar angles can affect measured textural properties that
characterize the dune
Grains can be perceived
differently in two-dimensional
images due to grain overlap
(A), burial (B), and
foreshortening (C)
Shadows from large grains can
hide smaller, neighboring
grains, which would exclude
them from a textural analysis
Image resolution limits the
smallest grain size and amount
of detail that can be considered
in a textural analysis
ACKNOWLEDGEMENTS:
The authors would like to acknowledge NASA for funding this work, the Bureau of Land
Management, and Kirk Jungers of FirstLine Seeds Inc. for allowing access to the Moses Lake Dunes
through his property.
2. EFFECT OF IMAGE RESOLUTION: Determine the image resolution at
which the measurement of textural properties that characterize the dune
are affected
3. IMAGE ANALYSIS VS. ACTUAL SEDIMENTS: Help to understand the
accuracy of textural image analysis by comparing textural analyses from
images and actual sediment
For the analysis of sediment textures (grain size, roundness, and
sphericity) on images of Mars-analog aeolian sediment,
the goals of this work are to:
VII. ON-GOING WORK
IV. EFFECT OF SHADOWS V. EFFECT OF IMAGE RESOLUTION
• On-going work seeks to understand if shadows of different lengths affect textural image analysis when image contrast is high during periods of
minimal atmospheric dispersion and attenuation of sunlight
• Perform a corresponding shadow, resolution, and image vs. actual sediment study with images and sediment from a Mars-analog fluvial environment
The percent of grains with a
roundness value of 3 increases
systematically as solar angle
increases and shadow length
decreases
At high solar angles, image
contrast increases which defines
and exaggerates the angularity of
textural features
The transmission of light through a
larger thickness of atmosphere at
low sun angles disperses and
attenuates light making shadows
soft and largely transparent
Textural analyses performed on images taken at 60°, 40°, and 20° solar
angles are compared to a textural analysis performed on a control
image with no shadows (even illumination)
Textures derived from a high-resolution (11 μm/pixel) image containing no shadows are compared to textures determined from actual sediments.
Because the validity of grain-size distribution conversions is unknown for aeolian sand, original sieve data is also shown.
Sphericity in the actual grains cannot be determined because grains are too small to manipulate and measure to identify three axes.
TEXTURAL ANALYSIS METHODS
ImageJ was used to perform textural
image analysis on images using a grid
system
Images and sediments were analyzed
for grain size, roundness, and
sphericity
Sieve grain-size distributions were
converted to be comparable to image
grain-size distributions to correct for
area, mass, and volume
Textural analyses performed on images with 20, 30, 40 and 50 μm/pixel
image resolutions are compared to a textural analysis performed on the
highest resolution image (11 μm/pixel)
The percent of grains with a
roundness value of 3 increases
when image resolution is
decreased to ≥ 30 μm/pixel
No significant changes in
roundness values are observed
when image resolution is
decreased from 30 to 50
μm/pixel
Image analysis of basaltic
aeolian sand from Moses
Lake Dunes, WA provides
context for analyzing and
interpreting dune sand on
Mars as seen in the adjacent
side-by-side comparison
Bagnold Dunes, Mars Moses Lake Dunes, WA
0.5 mm
Sediment Surface Peel
Imaging set-up
Moses Lake Dunes, WA
nTOT = 1600
nTOT = 1600
nTOT = 1600
0.5 mm 0.5 mm
II. RESEARCH GOALS
nTOT = 2000
nTOT = 2000
Grain-size distributions are not affected by shadows at solar angles of
≤ 60° as shown by similarities between descriptive statistical parameters
Starting at 20° solar angle, grains appear more angular as the solar
angle increases and shadow length decreases
Sphericity is not affected by shadows casted at solar angles of ≤ 60° as
demonstrated by highly similar distribution of values
The binning of image data
collected at different mm scales
into phi grain size bins causes
the distributions to become
erratic at ≥ 1.5 phi
Starting at 30 μm/pixel, grains appear more angular as the image
resolution is decreased
Sphericity is not affected by image resolution when decreased to
50 μm/pixel as demonstrated by highly similar distribution of values
nTOT = 800
Image derived roundness values are good estimates of the roundness
values collected from actual sediment under a microscope
Roundness estimated from the
image taken under even
illumination best represents the
roundness of the actual sediment
Eibl et al. 2015 reported in poorly
sorted sediment finer grain sizes
appear more round, this is not an
issue in well sorted sediment
where variation in size is low
The smallest visible grain axis is the most accurate representation of
actual sediment grain sizes (sieving determines size by intermediate axis)
In images, only the apparent
smallest or largest axis can be
measured for grain size
Neither of the apparent axes in
the image are exact
representations of the grain’s
intermediate axis
REFERENCES:
Eibl, M. A., Fedo, C. M., Friday, M. E., and McSween, H. Y., 2015, Accuracy of 2D Rover Images
for Representing 3D Sedimentary Textures of Basaltic Mars Analog Sediment, 46th LPSC,
Abstract 2415.
nTOT = 2000
Genuinely
bimodal?
Box-and-whisker
distribution of
sphericity values
Grain-size distributions at different resolution can be used to
correctly calculate grain size statistics, but at finer sizes are strongly
influenced by pixel size and binning
Box-and-whisker
distribution of
sphericity values
Image Credit: NASA/JPL - Caltech
Imaging and
Sampling Location